. 2015 Aug 14;10(8):e0133850.
doi: 10.1371/journal.pone.0133850. eCollection 2015.

Context Sensitive Modeling of Cancer Drug Sensitivity

Affiliations

Context Sensitive Modeling of Cancer Drug Sensitivity

Bo-Juen Chen et al. PLoS One. .

Abstract

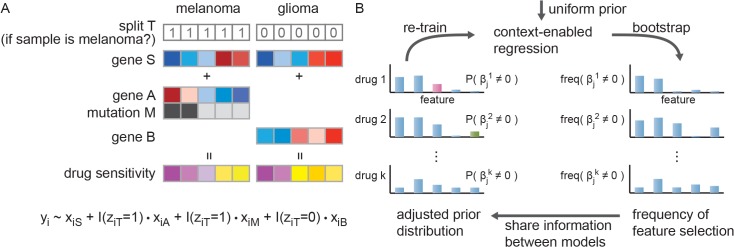
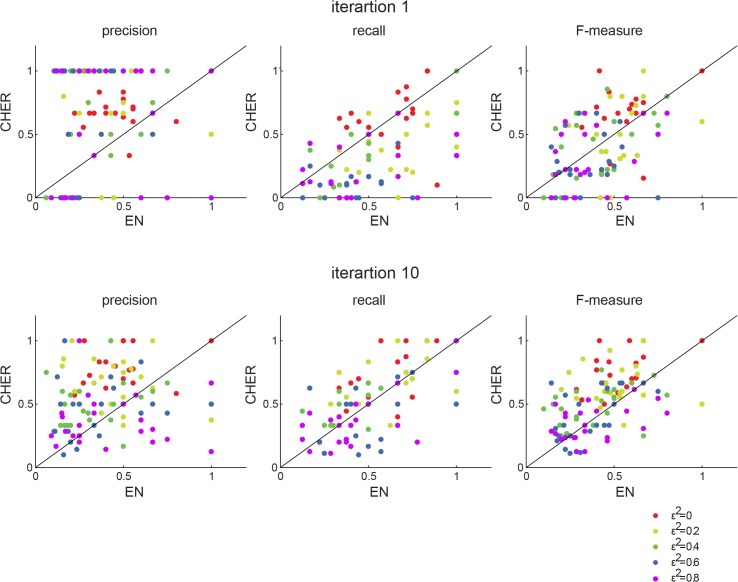
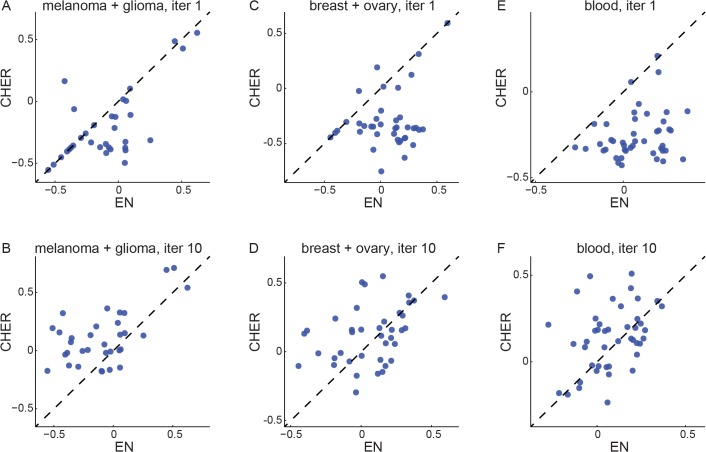
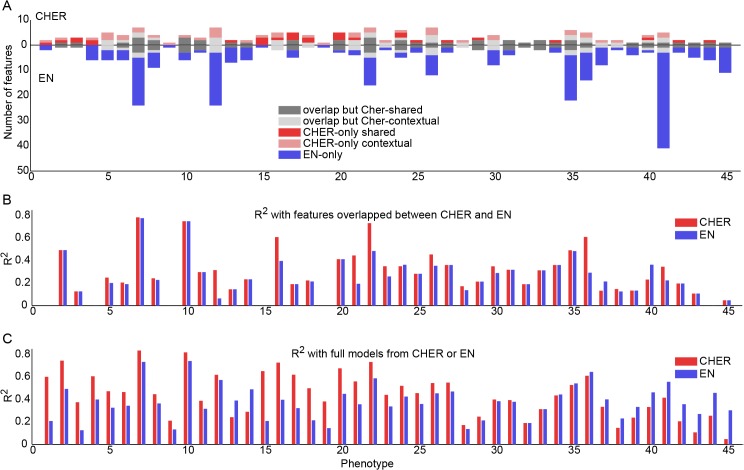
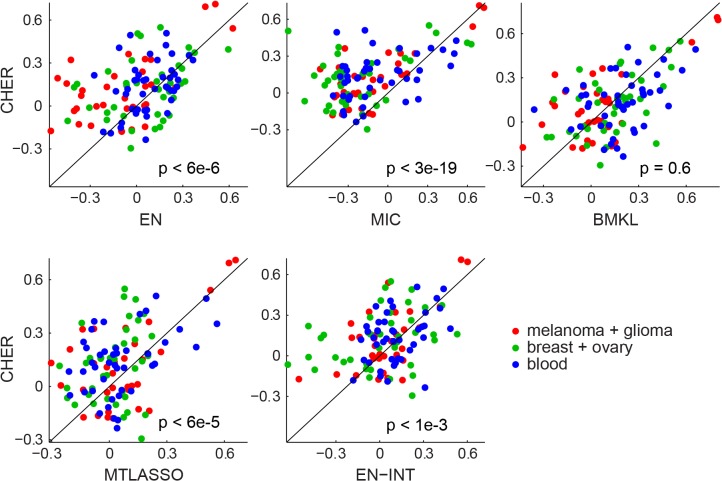
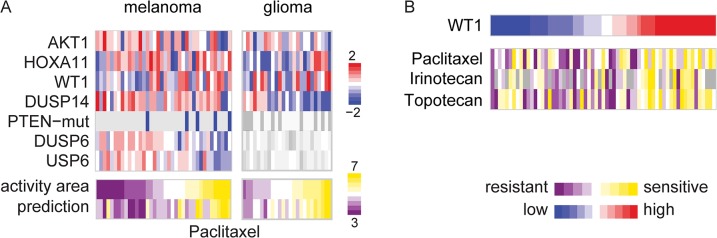
Recent screening of drug sensitivity in large panels of cancer cell lines provides a valuable resource towards developing algorithms that predict drug response. Since more samples provide increased statistical power, most approaches to prediction of drug sensitivity pool multiple cancer types together without distinction. However, pan-cancer results can be misleading due to the confounding effects of tissues or cancer subtypes. On the other hand, independent analysis for each cancer-type is hampered by small sample size. To balance this trade-off, we present CHER (Contextual Heterogeneity Enabled Regression), an algorithm that builds predictive models for drug sensitivity by selecting predictive genomic features and deciding which ones should-and should not-be shared across different cancers, tissues and drugs. CHER provides significantly more accurate models of drug sensitivity than comparable elastic-net-based models. Moreover, CHER provides better insight into the underlying biological processes by finding a sparse set of shared and type-specific genomic features.


Conflict of interest statement

Competing Interests: The authors have declared that no competing interests exist.

Figures

Fig 1
Fig 1. Overview of CHER algorithm.
A. Example of a model learned by CHER, where the drug sensitivity of melanoma samples can be predicted by mutation of M and gene expression of A and S, whereas in glioma, expression of gene S and B are the predictors. CHER takes advantage of pooling samples together to gain statistical power, identifying both shared (gene S) and context-specific features (A, B and M). In cases where the relevant context is unknown, the algorithm searches for the best “split”, if any, to separate samples into two groups. Yi represents drug sensitivity of the ith sample, xi are the corresponding features of the ith sample, zit = 1 presents the ith sample is melanoma, and I(.) is an indicator function. B. Iterative learning scheme of CHER. CHER initially learns models with uniform prior (meaning each genomic feature has the same probability of being included in the model). During each iteration, CHER trains the regression models with bootstrapping, which allows the algorithm to establish the frequency of each feature being selected. Then CHER adjusts the priors according to the distribution of frequency and the similarity between phenotypes.
Fig 2
Fig 2. Comparison of performance of CHER and elastic net on synthetic data.
Bootstrapped elastic net (EN) is compared to bootstrapped CHER. A threshold of 0.3 and 0.5 are applied to the relevant frequency (τ) to determine robust features in CHER and elastic, respectively. The precision, recall, F-measure of each phenotype from EN (x-axis) is plotted against that from CHER (y-axis). The first row shows the results of CHER from the first iteration and the second row the results of CHER from the 10th iteration. Each dot represents a phenotype, colored by the noise level added.
Fig 3
Fig 3. Comparison of performance between CHER and elastic-net (EN).
Pearson’s correlation coefficients between the prediction and the true sensitivity data are calculated for each algorithm and plotted against each other (x-axis: elastic net, y-axis: CHER). Each dot represents a phenotype. A. Predictions for melanoma and glioma samples from the initial iteration of CHER algorithm are compared to those from elastic net. B. Predictions for melanoma and glioma samples from CHER after ten iterations are compared to those from elastic net. C., D. Similarly, but for breast and ovarian cancer samples. E., F. Similarly, but for blood samples.
Fig 4
Fig 4. Comparison of features selected by CHER and elastic net (EN).
A. Number of features selected by both and individual algorithms for each phenotype. For each phenotype (x-axis), numbers of features selected by CHER are represented on the positive y-axis whereas those selected by elastic net are represented on the negative y-axis. Features are separated into five groups, corresponding to features selected by both algorithms or by specific to individual algorithms. Phenotype 1–14 are from CCLE-SkinGlioma and the rest are from CCLE-Blood. B. Adjusted R2 of CHER and elastic net models using the features selected by both algorithms (features of the first two categories in A). C. As B, but all features selected by each algorithm are used. Phenotypes in all three figures are sorted by the difference of R2 between CHER and elastic net from C.
Fig 5
Fig 5. Comparison of CHER with other methods.
Pearson correlation coefficients between the prediction and the sensitivity data are calculated for each algorithm. The correlation coefficients from each algorithm (x-axis) are compared to those from CHER (y-axis). Each dot represents prediction performance for one drug sensitivity. Method abbreviation: EN, the elastic net, MIC, multiple inclusion criterion; BMKL: Bayesian multi-task multi-kernel regression; MTLASSO: multi-task lasso; EN-INT: EN with context-gene interactions. P-values show the significance of CHER’s prediction compared to other methods (one-tail t-test).
Fig 6
Fig 6. Example of predictive model for melanoma and glioma samples.
A. CHER’s model for drug sensitivity to paclitaxel. Each vertical bar represents a data of a sample. All features are gene expression profiles except PTEN, which is a mutation profile feature (blue bars represents samples with mutations). AKT1 and WT1 are predictive for both melanoma and glioma. PTEN-mut, DUSP6 and USP6 are predictive features specific for melanoma whereas DUSP14 is specific for glioma. The greyed out heatmaps represents those features are not predictive for the samples. The predictions are obtained from leave-one-out procedure with the final selected features. B. Expression of WT1 is predictive of the cytotoxic drugs paclitaxel, irinotecan and topotecan, which likely due to IGF1-R activity.

Similar articles

Cited by

References

    1. Altelaar AF, Munoz J, Heck AJ. Next-generation proteomics: towards an integrative view of proteome dynamics. Nature reviews Genetics. 2013;14(1):35–48. Epub 2012/12/05. 10.1038/nrg3356 . - DOI - PubMed
    1. Lee SY, McLeod HL. Pharmacogenetic tests in cancer chemotherapy: what physicians should know for clinical application. The Journal of pathology. 2011;223(1):15–27. Epub 2010/09/08. 10.1002/path.2766 . - DOI - PubMed
    1. McLeod HL. Cancer pharmacogenomics: early promise, but concerted effort needed. Science. 2013;339(6127):1563–6. Epub 2013/03/30. 10.1126/science.1234139 - DOI - PMC - PubMed
    1. Alizadeh AA, Eisen MB, Davis RE, Ma C, Lossos IS, Rosenwald A, et al. Distinct types of diffuse large B-cell lymphoma identified by gene expression profiling. Nature. 2000;403(6769):503–11. Epub 2000/02/17. 10.1038/35000501 . - DOI - PubMed
    1. van de Vijver MJ, He YD, van't Veer LJ, Dai H, Hart AA, Voskuil DW, et al. A gene-expression signature as a predictor of survival in breast cancer. The New England journal of medicine. 2002;347(25):1999–2009. Epub 2002/12/20. 10.1056/NEJMoa021967 . - DOI - PubMed

Publication types

Substances

LinkOut - more resources