. 2015 Aug 14;10(8):e0135579.
doi: 10.1371/journal.pone.0135579. eCollection 2015.

Impact of the Regulators SigB, Rot, SarA and sarS on the Toxic Shock Tst Promoter and TSST-1 Expression in Staphylococcus aureus

Affiliations

Impact of the Regulators SigB, Rot, SarA and sarS on the Toxic Shock Tst Promoter and TSST-1 Expression in Staphylococcus aureus

Diego O Andrey et al. PLoS One. .

Abstract

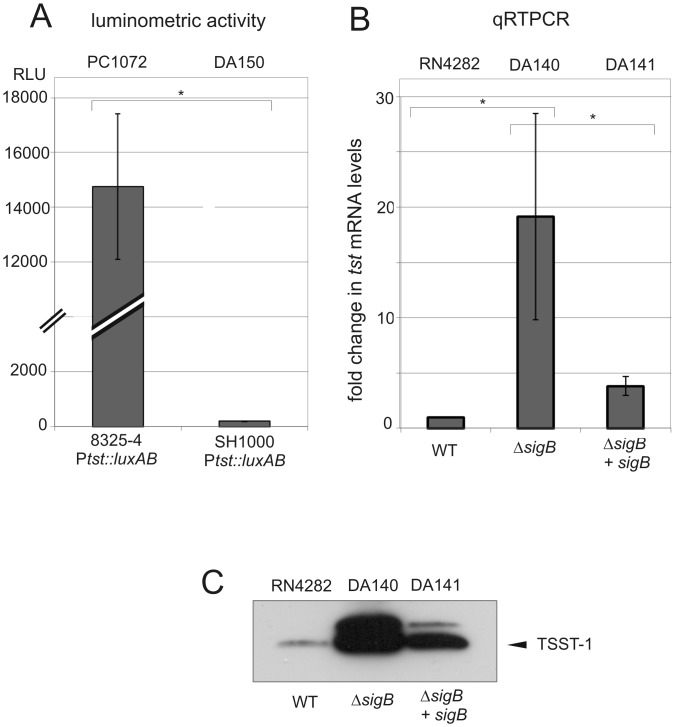
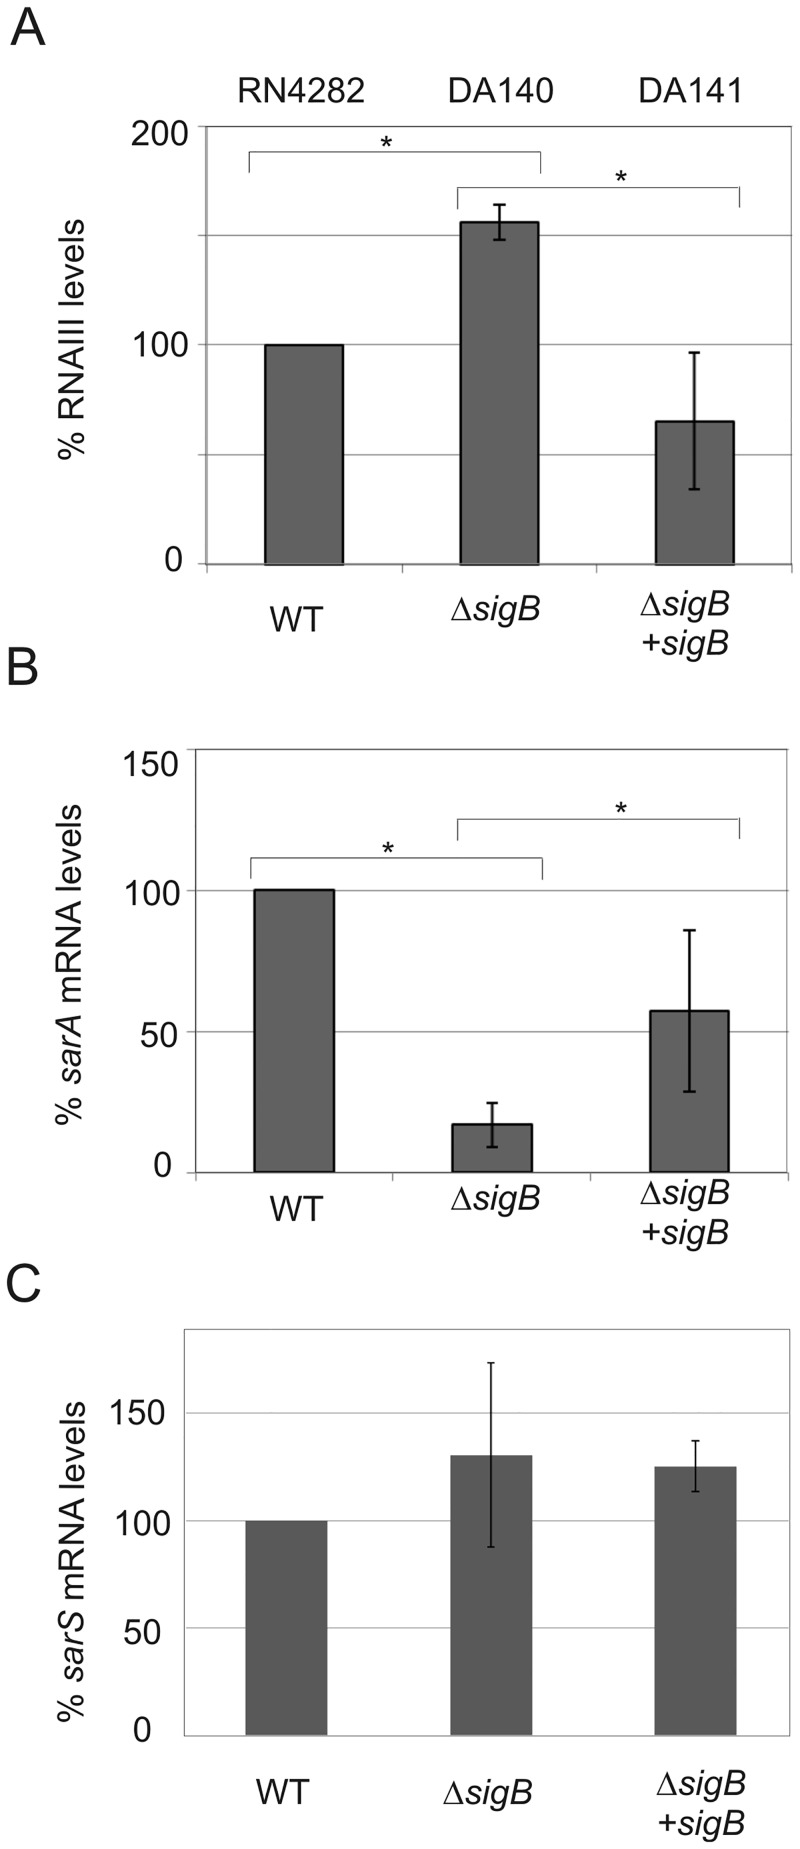
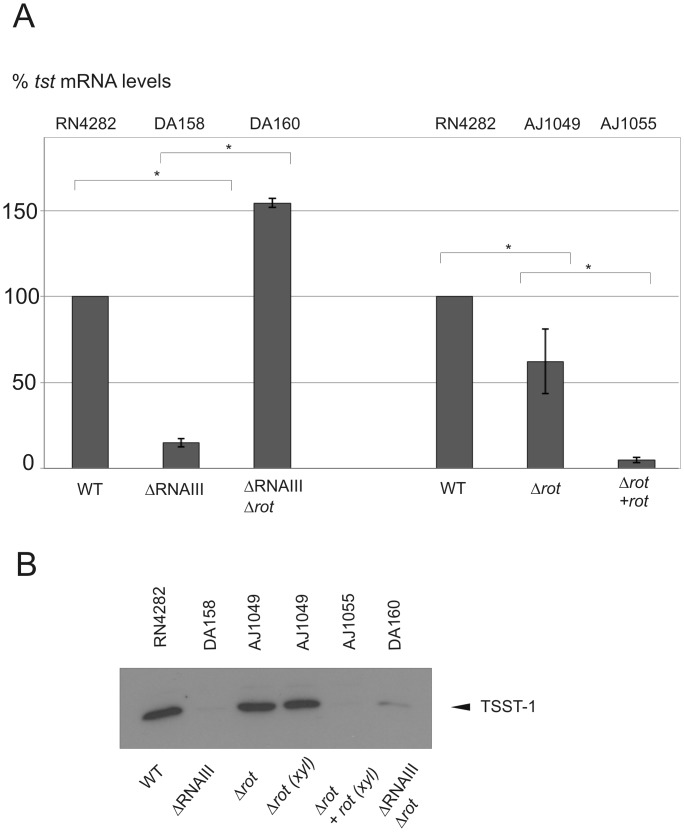
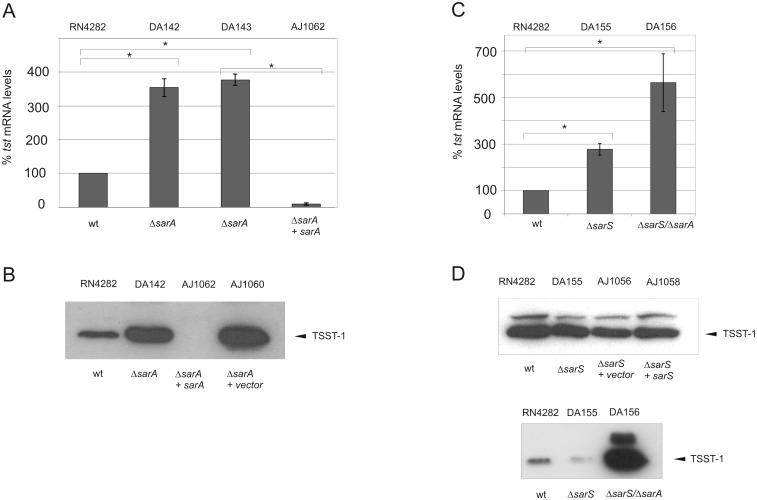
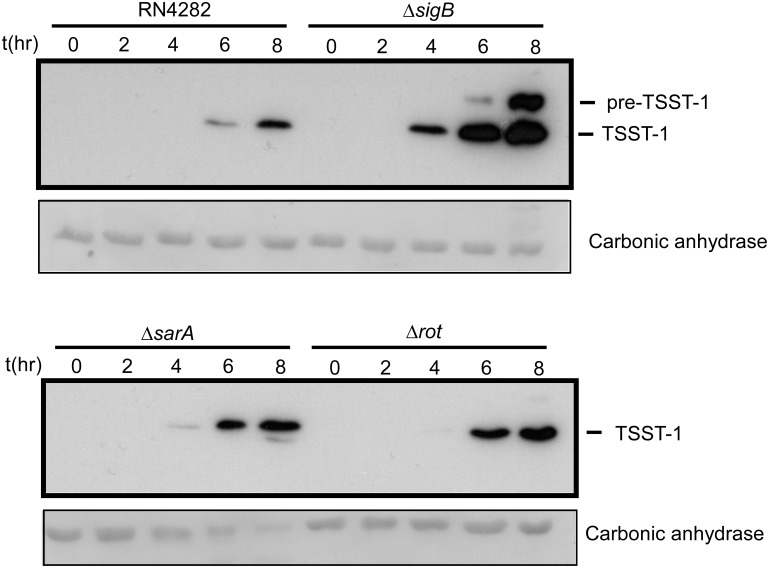
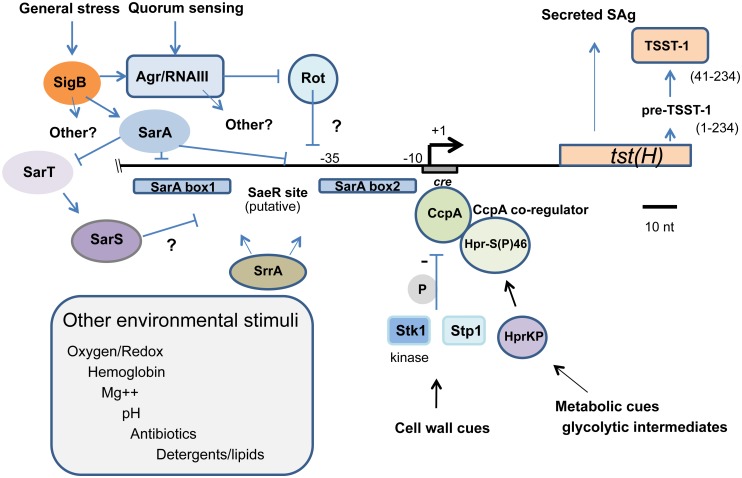
Staphylococcus aureus is an important pathogen manifesting virulence through diverse disease forms, ranging from acute skin infections to life-threatening bacteremia or systemic toxic shock syndromes. In the latter case, the prototypical superantigen is TSST-1 (Toxic Shock Syndrome Toxin 1), encoded by tst(H), and carried on a mobile genetic element that is not present in all S. aureus strains. Transcriptional regulation of tst is only partially understood. In this study, we dissected the role of sarA, sarS (sarH1), RNAIII, rot, and the alternative stress sigma factor sigB (σB). By examining tst promoter regulation predominantly in the context of its native sequence within the SaPI1 pathogenicity island of strain RN4282, we discovered that σB emerged as a particularly important tst regulator. We did not detect a consensus σB site within the tst promoter, and thus the effect of σB is likely indirect. We found that σB strongly repressed the expression of the toxin via at least two distinct regulatory pathways dependent upon sarA and agr. Furthermore rot, a member of SarA family, was shown to repress tst expression when overexpressed, although its deletion had no consistent measurable effect. We could not find any detectable effect of sarS, either by deletion or overexpression, suggesting that this regulator plays a minimal role in TSST-1 expression except when combined with disruption of sarA. Collectively, our results extend our understanding of complex multifactorial regulation of tst, revealing several layers of negative regulation. In addition to environmental stimuli thought to impact TSST-1 production, these findings support a model whereby sporadic mutation in a few key negative regulators can profoundly affect and enhance TSST-1 expression.


Conflict of interest statement

Competing Interests: The authors have declared that no competing interests exist.

Figures

Fig 1
Fig 1. The effect of rsbU or sigB disruption on tst expression.
A. Luciferase reporter assay for the tst promoter. The histogram shows measured luminometric activity of the indicated strains in post-exponential growth phase (Materials and Methods). RLU: relative light units. B. Quantitative qRT-PCR measurements of tst transcripts levels in sigB wt, sigB mutant, and sigB complemented strains, in post-exponential growth phase, setting reference RN4282 as 1. Bars show +/- standard deviations. All data were compiled from three independent experiments. Statistical significance was evaluated by Student’s paired t test, and data were considered significant when P was <0.05 C. Western blot of TSST-1, using anti-TSST-1 polyclonal antibody after precipitation from supernatants of the indicated strains. Note the appearance of a strong band corresponding to unprocessed precursor TSST-1 detected in the absence of sigB and diminished upon reintroduction of multicopy sigB (upper band). The experiment shown is representative of several independent experiments.
Fig 2
Fig 2. The effect of sigB disruption on RNAIII (A), sarA (B) and sarS (C) transcript levels in RN4282 and its derivatives using quantitative qRT-PCR measurements of RNA expression.
Relative changes are shown in each panel using RN4282 as 100%. Bars show +/- standard deviations and all data were compiled from three independent experiments. Statistical significance was evaluated by Student’s paired t test, and data were considered significant when P was <0.05.
Fig 3
Fig 3. The effect of RNAIII and rot disruption or overexpression on tst and TSST-1 in RN4282.
A. Quantitative qRT-PCR measurements of tst expression and setting RN4282 as 100%. Bars show +/- standard deviations. All data were compiled from three independent experiments. Statistical significance was evaluated by Student’s paired t test, and data were considered significant when P was <0.05. B. Western blot of TSST-1, using anti-TSST-1 polyclonal antibody after precipitation from supernatants of the indicated strains. In lane 4 and 5 both samples include xylose to discard effect of the latter on tst expression. The experiment shown is representative of several independent experiments.
Fig 4
Fig 4. The effect of sarA and sarS on tst and TSST-1 toxin expression in RN4282.
A and C. Quantitative qRT-PCR measurements of tst expression in the indicated strains, setting RN4282 as 100%. Bars show +/- standard deviations. All data were compiled from three independent experiments. Statistical significance was evaluated by Student’s paired t test, and data were considered significant when P was <0.05. B and D. Western blot of TSST-1, using anti-TSST-1 polyclonal antibody after precipitation from OD-normalized supernatants of the indicated strains (Materials and Methods). The experiment shown is representative of several independent experiments.
Fig 5
Fig 5. Western blot showing the time course production of TSST-1 in supernatants of the indicated wild type or mutant strains.
Samples, at each time point, were OD600 normalized to each other. Prior to supernatant concentration, samples were spiked with a fixed amount of pure carbonic anhydrase as an internal preparation loading control, and is shown as the Ponceau stained band from the PVDF membrane (Materials and Methods). Note the strong production of TSST-1 from the ΔsigB strain (DA140).
Fig 6
Fig 6. Model depicting the regulation of the TSST-1 superantigen in S. aureus.
The horizontal line shows the position of the transcriptional start site (+1) determined in RN4282 and 37 nucleotides upstream of the translation start site [40]. The positions of SarA boxes 1 and 2 are shown and correspond to their positions determined by both SarA consensus and direct DNA binding assay [40]. Negative regulators determined in the study reported herein include σ B, SarA, and Rot. SarA modulation of SarS is thought to occur via SarA negative regulation of the SarS activator SarT [65]. Catabolite control protein a (CcpA) binding to its cognate cis- acting cre site mediates additional tst repression by integrating signals from glycolytic intermediates via phosphorylation of the CcpA co-regulator as well as direct phosphorylation (grey P) via the Stk1 kinase which affects its DNA binding affinity [25, 44, 69]. The Stk1 S/T kinase and its cognate phosphatase, Stp1, may impart additional levels of control via the phosphorylation of SarA and the nucleoid protein, Hu, for example [45, 70, 71]. SrrA, the response regulator of the SrrAB two-component sensor, is thought to control tst regulation in response to oxygen and coenzyme Q [29, 30, 69, 100]. SrrA specific binding has been detected in the tst promoter region (Andrey, manuscript in preparation). DNA sequence with strong similarity to the consensus DNA binding site for the response regulator SaeR is shown. Although the precise involvement of SaeRS in tst regulation is unknown, it may help coordinate response to pH together with sigB [34, 101, 102]. Additional environmental stimuli known to affect TSST-1 expression are boxed although the precise genetic factors mediating these effects have yet to be defined [, –107].

References

    1. Lowy FD. Staphylococcus aureus infections. N Engl J Med. 1998;339(8):520–32. Epub 1998/08/26. . - PubMed
    1. Gorwitz RJ, Kruszon-Moran D, McAllister SK, McQuillan G, McDougal LK, Fosheim GE, et al. Changes in the prevalence of nasal colonization with Staphylococcus aureus in the United States, 2001–2004. J Infect Dis. 2008;197(9):1226–34. Epub 2008/04/22. 10.1086/533494 . - DOI - PubMed
    1. Foster TJ. Colonization and infection of the human host by staphylococci: adhesion, survival and immune evasion. Vet Dermatol. 2009;20(5–6):456–70. Epub 2010/02/25. doi: VDE825 [pii] 10.1111/j.1365-3164.2009.00825.x . - DOI - PubMed
    1. Novick RP. Mobile genetic elements and bacterial toxinoses: the superantigen-encoding pathogenicity islands of Staphylococcus aureus. Plasmid. 2003;49(2):93–105. Epub 2003/05/03. doi: S0147619X02001579 [pii]. . - PubMed
    1. Rooijakkers SH, van Kessel KP, van Strijp JA. Staphylococcal innate immune evasion. Trends Microbiol. 2005;13(12):596–601. Epub 2005/10/26. doi: S0966-842X(05)00280-5 [pii] 10.1016/j.tim.2005.10.002 . - DOI - PubMed

Publication types

MeSH terms

LinkOut - more resources