. 2015 Aug 14;10(8):e0125095.
doi: 10.1371/journal.pone.0125095. eCollection 2015.

Drought Increases Consumer Pressure on Oyster Reefs in Florida, USA

Affiliations

Drought Increases Consumer Pressure on Oyster Reefs in Florida, USA

Hanna G Garland et al. PLoS One. .

Abstract

Coastal economies and ecosystems have historically depended on oyster reefs, but this habitat has declined globally by 85% because of anthropogenic activities. In a Florida estuary, we investigated the cause of newly reported losses of oysters. We found that the oyster reefs have deteriorated from north to south and that this deterioration was positively correlated with the abundance of carnivorous conchs and water salinity. In experiments across these gradients, oysters survived regardless of salinity if conchs were excluded. After determining that conchs were the proximal cause of oyster loss, we tested whether elevated water salinity was linked to conch abundance either by increasing conch growth and survivorship or by decreasing the abundance of a predator of conchs. In field experiments across a salinity gradient, we failed to detect spatial variation in predation on conchs or in conch growth and survivorship. A laboratory experiment, however, demonstrated the role of salinity by showing that conch larvae failed to survive at low salinities. Because this estuary's salinity increased in 2006 in response to reduced inputs of freshwater, we concluded that the ultimate cause of oyster decline was an increase in salinity. According to records from 2002 to 2012, oyster harvests have remained steady in the northernmost estuaries of this ecoregion (characterized by high reef biomass, low salinity, and low conch abundance) but have declined in the southernmost estuaries (characterized by lower reef biomass, increases in salinity, and increases in conch abundance). Oyster conservation in this ecoregion, which is probably one of the few that still support viable oyster populations, may be undermined by drought-induced increases in salinity causing an increased abundance of carnivorous conchs.


Conflict of interest statement

Competing Interests: The authors have declared that no competing interests exist.

Figures

Fig 1
Fig 1. Variation in oyster reefs, crown conchs, and water salinity across study sites in the Matanzas River Estuary (MRE).
(A) Map of six study locations in the MRE with the first inset illustrating the Floridian ecoregion, and the second inset illustrating the location of the MRE (star symbol) within this ecoregion. (B) The mortality index (open bars, primary Y-axis) and living biomass of adult oysters (closed circles, secondary Y-axis) on oyster reefs throughout the MRE; different letters above the horizontal lines denote significant differences based on Scheffe’s post-hoc test (p < 0.05). (C) Crown conch abundance (open bars, primary Y-axis) and size (closed circles, secondary Y-axis) on oyster reefs throughout the MRE. (D) Salinity of water across sites in the MRE. All maps were produced in ArcGIS by E. Pettis.
Fig 2
Fig 2. Results from two field experiments in the Matanzas River estuary.
In field experiment 1, the (A) mean (SE) survivorship of adult oysters after 2 weeks, and (B) the relationship between the effect size of consumer pressure on adult oysters and crown conch abundance in control treatments (black); the same effect size also plotted as a function of conch abundance observed in annual surveys (gray). In field experiment 2, the (C) mean (SE) survivorship of juvenile oysters after 2 weeks. In (A), closed bars denote exclosure treatments, gray bars denote exclosure controls, and open bars denote control treatments. In (C) open bars denote the northern site and closed bars denote the southern site. For (A) and (C), different letters above bars denote significant differences (p < 0.05) based on Tukey’s post-hoc test.
Fig 3
Fig 3. Relationships between crown conchs and water salinity based on observational and experimental evidence.
(A) The relationship between crown conch abundance and water salinity of the six study sites in the Matanzas River estuary. (B) In experiment 3, results of logistic regression that examined the probability of larval mortality as a function of salinity after 14 days of exposure.
Fig 4
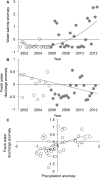
Fig 4. Environmental variation of the Matanzas River estuary.
(A) From 2002 to 2011, the seasonal anomaly of water salinity. (B) From 2002 to 2012, the seasonal anomaly of freshwater discharge. (C) The relationship between the seasonal anomaly of freshwater discharge and the seasonal anomaly of local precipitation. In (A-B), open symbols denote data points before 2006, and gray symbols denote data after 2006. All data were normalized according to the overall seasonal mean and seasonal standard deviation ([overall mean—seasonal mean] / overall standard deviation).
Fig 5
Fig 5. In an estuary north and south of the Matanzas River estuary, variation in the catch per unit effort of oysters, water salinity, crown conchs, and biomass of oyster reefs.
(A) Map of the Floridian ecoregion illustrating the location of the Matanzas River Estuary (star symbol) as well as a northern (open square) and southern (closed square) estuary. (B) The annual CPUE of oysters from 2000 to 2011 for the northern and southernmost estuaries. (C) Mean (SE) salinity of water in the northernmost and southernmost estuary. Mean (SE) abundance of conchs (D) and oyster biomass (E) in the northernmost and southernmost estuaries of this ecoregion. Asterisks denote significant differences (p < 0.05). All maps were produced in ArcGIS by E. Pettis.

References

    1. Dayton PK. Toward an understanding of community resilience and the potential effects of enrichments to the benthos at McMurdo Sound, Antarctica. Proc Colloq Cons Prob Antarctica. 1972; 81–96.
    1. Ellison AM, Bank MS, Clinton BD, Colburn EA, Elliott K, Ford CR, et al. Loss of foundation species: Consequences for the structure and dynamics of forested ecosystems. Front Ecol and Environ. 2005; 3: 479–486.
    1. Crain CM, Silliman BR, Bertness SL, Bertness MD. Physical and biotic drivers of plant distribution across estuarine salinity gradients. Ecol. 2004; 85: 2539–2549.
    1. Choler P, Michalet R, Callaway RM. Facilitation and competition on gradients in alpine plant communities. Ecol. 2001; 82: 3295–3308.
    1. Silliman BR, van de Koppel J, McCoy MW, Diller J, Kasozi GN, Earl K, et al. Degradation and resilience in Louisiana salt marshes after the BP-Deepwater Horizon oil spill. Proc Nat Acad Sci. 2012; 109: 11234–11239. 10.1073/pnas.1204922109 - DOI - PMC - PubMed

Publication types

LinkOut - more resources