. 2015 Nov;25(11):1600-9.
doi: 10.1101/gr.189068.114. Epub 2015 Aug 14.

GC skew defines distinct RNA polymerase pause sites in CpG island promoters

Affiliations

GC skew defines distinct RNA polymerase pause sites in CpG island promoters

Wendy A Kellner et al. Genome Res. 2015 Nov.

Abstract

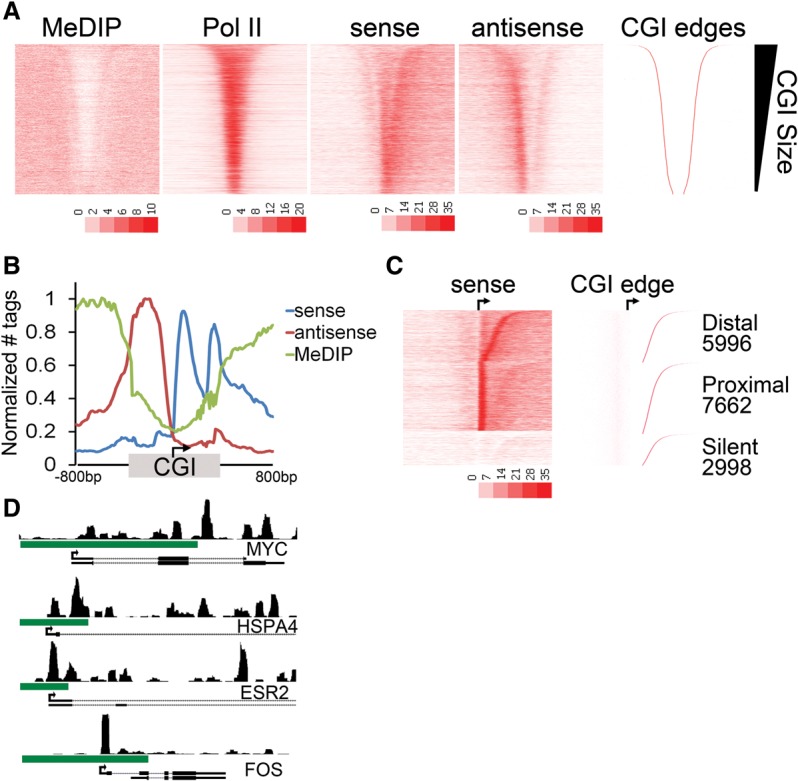
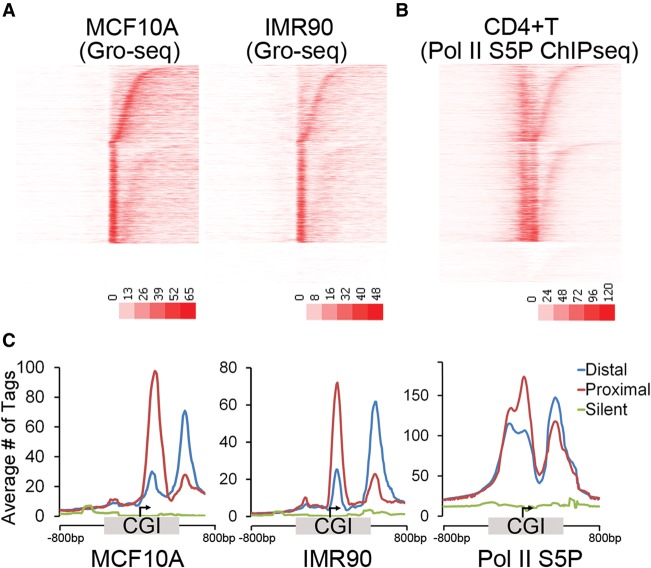
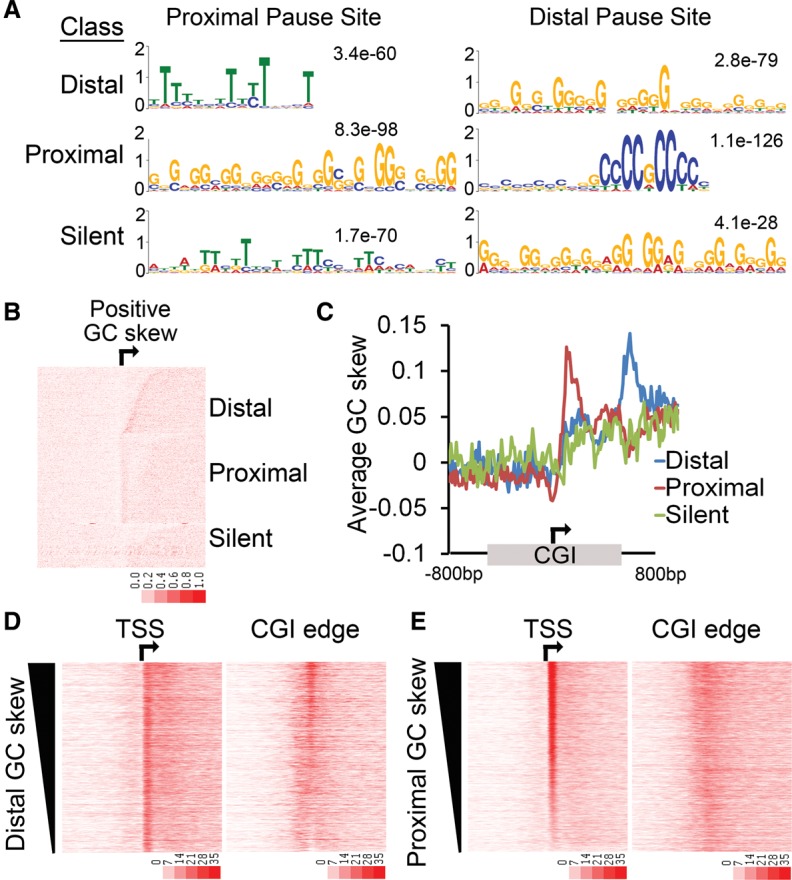
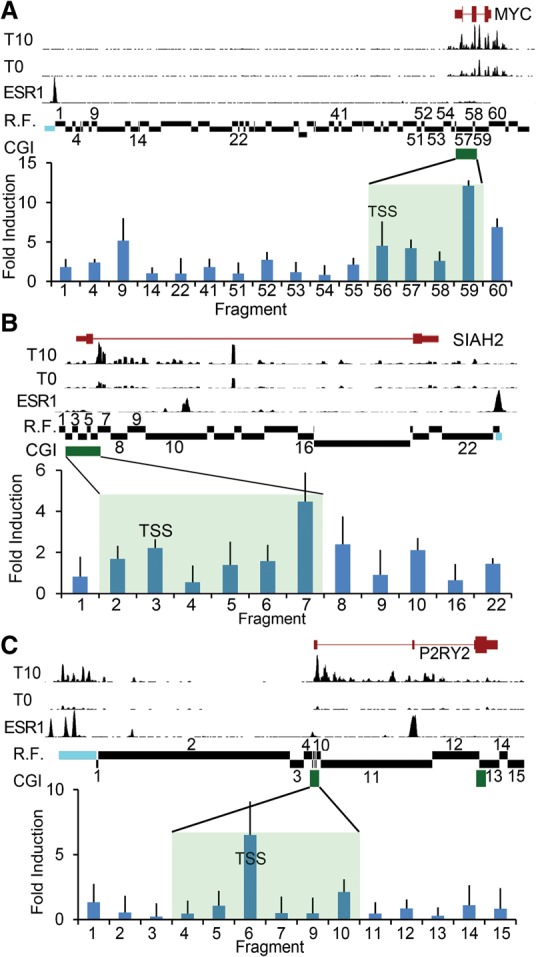
CpG islands (CGIs) are associated with over half of human gene promoters and are characterized by a unique chromatin environment and high levels of bidirectional transcriptional activity relative to surrounding genomic regions, suggesting that RNA polymerase (Pol II) progression past the CGI boundaries is restricted. Here we describe a novel transcriptional regulatory step wherein Pol II encounters an additional barrier to elongation distinct from the promoter-proximal pause and occurring at the downstream boundary of the CGI domain. For most CGI-associated promoters, Pol II exhibits a dominant pause at either the promoter-proximal or this distal site that correlates, both in position and in intensity, with local regions of high GC skew, a sequence feature known to form unique secondary structures. Upon signal-induced gene activation, long-range enhancer contacts at the dominant pause site are selectively enhanced, suggesting a new role for enhancers at the downstream pause. These data point to an additional level of control over transcriptional output at a subset of CGI-associated genes that is linked to DNA sequence and the integrity of the CGI domain.


Figures

Figure 1.
Figure 1.
A second (distal) Pol II pause at the CGI shore. (A) Heatmap representation of MeDIP-seq, total Pol II ChIP-seq, and GRO-seq sense (plus strand) and antisense (minus strand) tag density is plotted for ±3 kb around the midpoint of the CGI and sorted by CGI size (CGI-associated promoters; n = 16,657). The upstream and downstream boundaries of the CGI domain (right) is shown for comparison. (B) Average tag densities of nascent transcripts (GRO-seq; sense, antisense) and DNA methylation (MeDIP-seq) across CGI-associated promoters. Promoters were oriented to the direction of transcription, and the distances from the TSS to the upstream and downstream CGI edge were independently scaled and anchored to the TSS (arrow). An additional 800 bp to either side of the CGI (unscaled) is included. Data are normalized between data sets by setting the maximum tags per 20 bp bin within each data set to one. (C) The relative GRO-seq tag density for the 100 bp under the proximal peak versus the 100 bp at the CGI edge was used to parse genes into proximal or distal pausing classes. Promoters with no tags in either region were considered silent. CGIs in each class were sorted by the distance from the TSS to the downstream CGI edge (indicated to the right). (D) Browser image of MCF7 GRO-seq sense tags covering an 8-kb window surrounding the promoter regions of MYC, HSPA4, ESR2, and FOS. Green bar indicates CGI.
Figure 2.
Figure 2.
Predominant Pol II pausing class is conserved across cell types. (A) Heatmap representation of the GRO-seq sense tag density from MCF10A and IMR90 cells. CGI promoters are oriented to transcription and sorted within each class by the distance from the TSS to the downstream CGI edge using the same sort order as Figure 1C. (B) Pol II (S5 phosphorylated) ChIP-seq tag density from CD4+ T cells oriented and sorted as in Figure 1C. (C) Average tag densities of nascent transcripts (GRO-seq sense) and phospho-S5-Pol II for promoters in the three pausing classes shown in A and B. CGI-associated promoters were oriented to transcription and the distance from the TSS to the upstream and downstream CGI edge independently scaled and anchored to the TSS (arrow). The average tags per 20-bp bin for 800 bp to either side of the CGI (unscaled) are included.
Figure 3.
Figure 3.
Pol II pausing correlates with GC skew. (A) MEME-ChIP was performed on the 100-bp sequence underlying the proximal pause and the distal pause for the promoters in each pausing class (distal, proximal, silent). An enrichment of G-rich sequences correlates with the predominant Pol II pause point for each class. (B) Heatmap representation of GC skew. The degree of GC skew was calculated in 20-bp bins. CGI promoters from the three classes are oriented and sorted by the distance from the TSS to the downstream CGI edge using the same sort order as Figure 1C. (C) Average GC skew across the three different pausing classes. CGI-associated promoters were oriented, and the distances from the TSS to the upstream and downstream CGI edge were independently scaled and anchored to the TSS (arrow). An additional 800 bases to either side of the CGI (unscaled) is included. (D,E) MCF7 cell GRO-seq sense tag density around the TSS (arrow) or the downstream edge of the CGI (±3 kb). All CGI promoters were sorted by decreasing GC skew for the 100 bases underlying the distal pause (D) or the proximal pause (E).
Figure 4.
Figure 4.
Distal enhancer interactions correlate with pausing class. A chromatin conformation capture (3C) assay was performed to investigate the interaction between known estrogen-bound enhancer elements upstream of the following: (A) MYC (shown is Chr 8: 128,679,000–128,763,000), (B) SIAH2 (Chr 3: 150,455,000–150,483,000), and (C) P2RY2 (Chr 11: 72,903,000–72,950,000) loci. The relative positions of the CGI (green bar, shaded region) and the fragment containing the TSS are indicated. Estrogen-depleted MCF7 cells were induced with 100 nM estradiol (E2) or vehicle (ethanol) for 10 min followed by crosslinking, restriction digestion, and ligation. An anchor probe was designed against the known estrogen receptor-bound enhancer (blue) and tested for ligation with the indicated restriction fragments (R.F.) by qPCR. Data are reported as mean ± SD of the fold-induction of E2-induced interaction relative to uninduced from three independent experiments assayed in triplicate. Shown for comparison are GRO-seq sense strand data from MCF7 cells depleted of estrogen for 3 d (T0) and induced with 100 nM estradiol for 10 min (T10) (Hah et al. 2011). For GRO-seq tracks, y-axis scale (total tag count every 10 bases): MYC = 1300, SIAH2 = 250, P2RY2 = 225. Shown for comparison are estrogen receptor alpha (ESR1) ChIP-seq data derived from GSM594602. For the ESR1 ChIP-seq track, y-axis scale (total tag count every 10 bp): MYC = 150, SIAH2 = 154, P2RY2 = 324. Data demonstrate estrogen-induced ESR1 binding at the enhancer and transcriptional activity at both the promoter and enhancer.

References

    1. Adelman K, Lis JT. 2012. Promoter-proximal pausing of RNA polymerase II: emerging roles in metazoans. Nat Rev Genet 13: 720–731. - PMC - PubMed
    1. Aguilera A, Garcia-Muse T. 2012. R loops: from transcription byproducts to threats to genome stability. Mol Cell 46: 115–124. - PubMed
    1. Anand P, Brown JD, Lin CY, Qi J, Zhang R, Artero PC, Alaiti MA, Bullard J, Alazem K, Margulies KB, et al. 2013. BET bromodomains mediate transcriptional pause release in heart failure. Cell 154: 569–582. - PMC - PubMed
    1. Belotserkovskii BP, Liu R, Tornaletti S, Krasilnikova MM, Mirkin SM, Hanawalt PC. 2010. Mechanisms and implications of transcription blockage by guanine-rich DNA sequences. Proc Natl Acad Sci 107: 12816–12821. - PMC - PubMed
    1. Bock C, Paulsen M, Tierling S, Mikeska T, Lengauer T, Walter J. 2006. CpG island methylation in human lymphocytes is highly correlated with DNA sequence, repeats, and predicted DNA structure. PLoS Genet 2: e26. - PMC - PubMed

Publication types

LinkOut - more resources