. 2015 Aug 14;4(9):1143-53.
doi: 10.1242/bio.011957.

Flagellar membranes are rich in raft-forming phospholipids

Affiliations

Flagellar membranes are rich in raft-forming phospholipids

Mauro Serricchio et al. Biol Open. .

Abstract

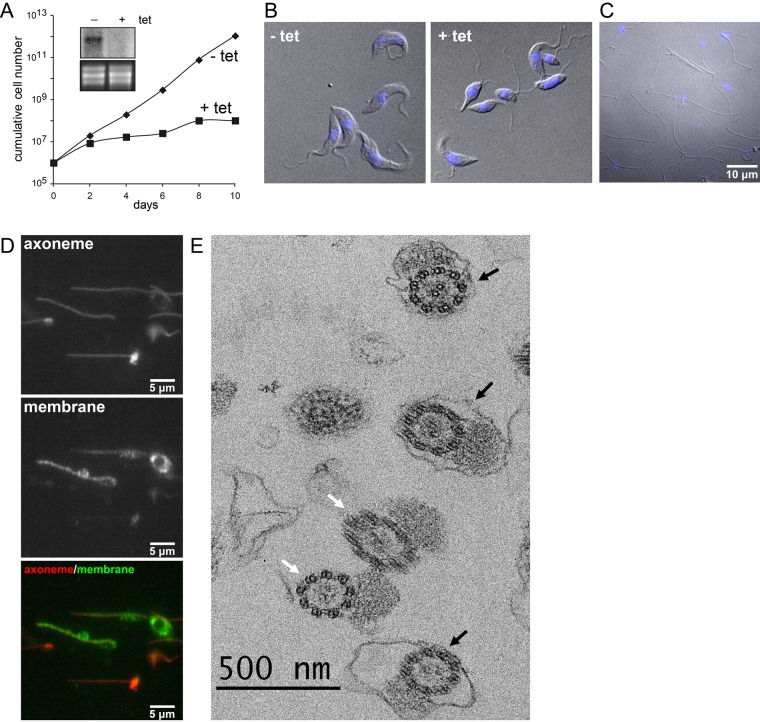
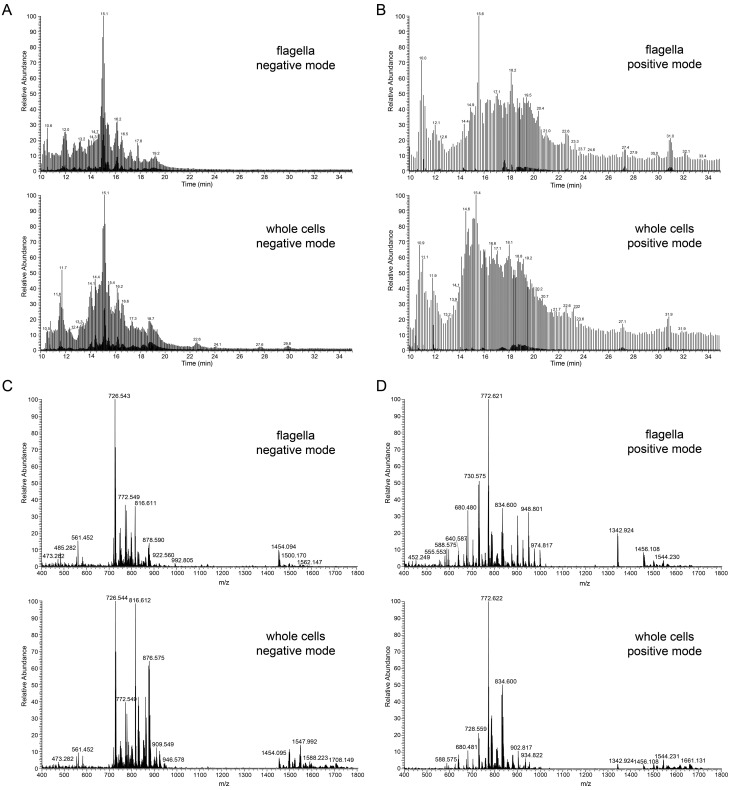
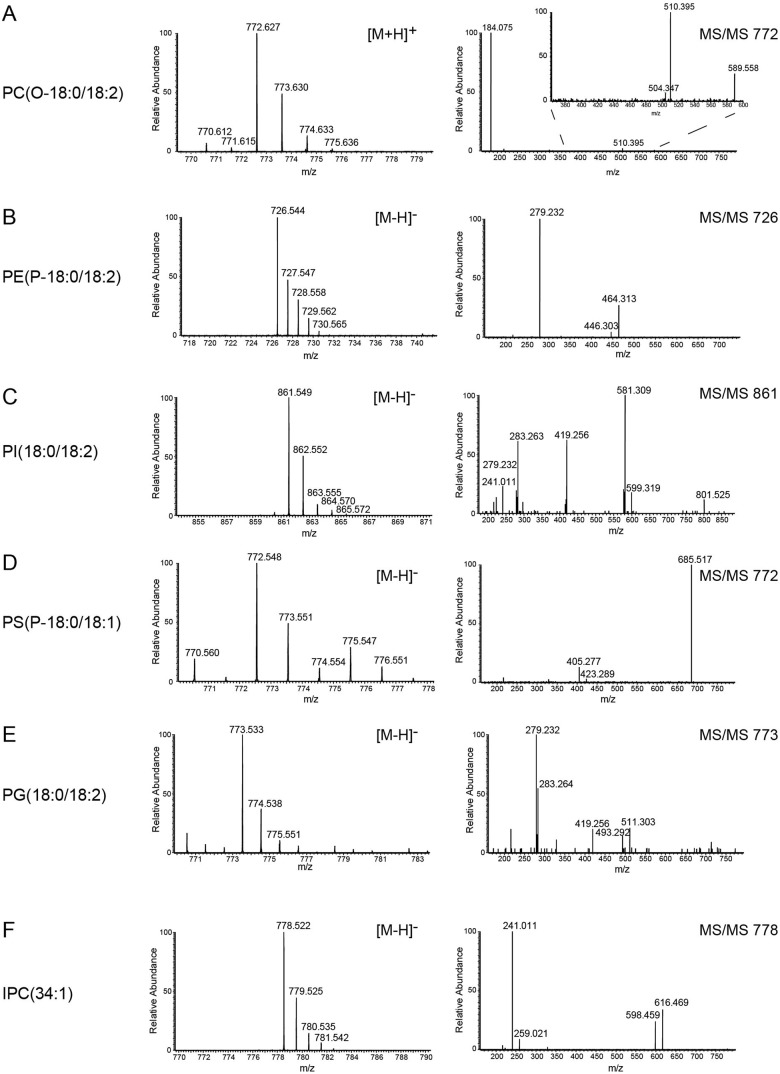
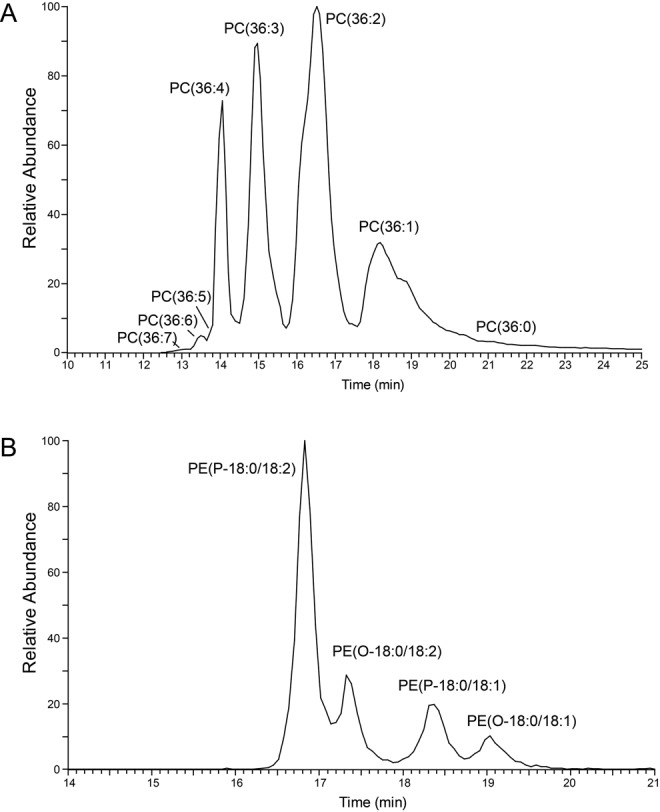
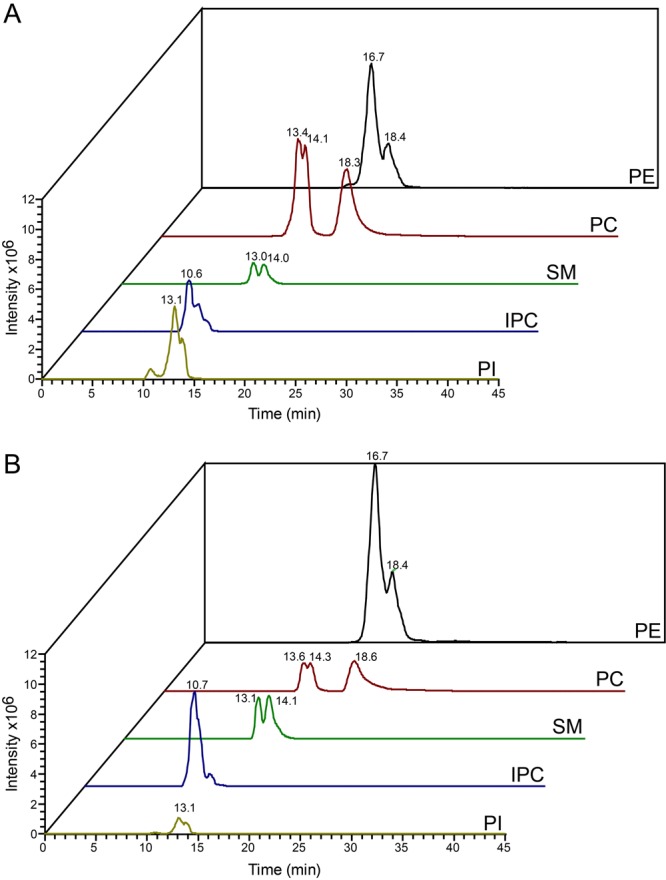
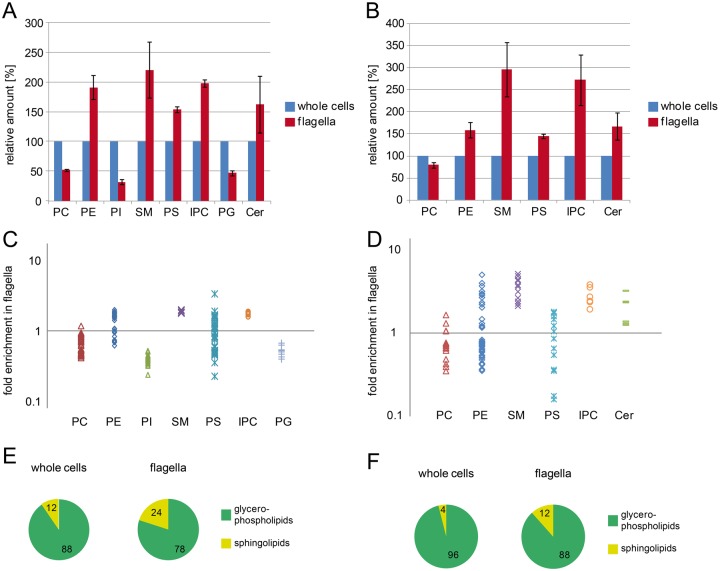
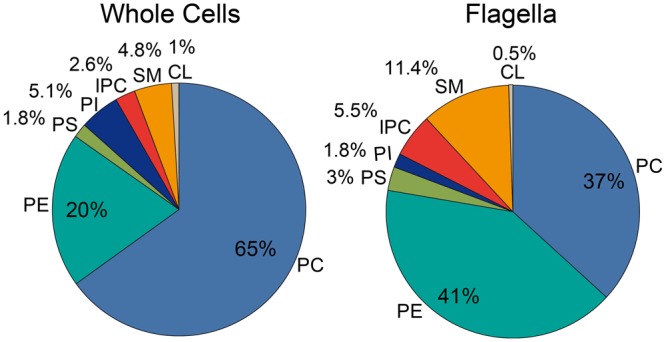
The observation that the membranes of flagella are enriched in sterols and sphingolipids has led to the hypothesis that flagella might be enriched in raft-forming lipids. However, a detailed lipidomic analysis of flagellar membranes is not available. Novel protocols to detach and isolate intact flagella from Trypanosoma brucei procyclic forms in combination with reverse-phase liquid chromatography high-resolution tandem mass spectrometry allowed us to determine the phospholipid composition of flagellar membranes relative to whole cells. Our analyses revealed that phosphatidylethanolamine, phosphatidylserine, ceramide and the sphingolipids inositol phosphorylceramide and sphingomyelin are enriched in flagella relative to whole cells. In contrast, phosphatidylcholine and phosphatidylinositol are strongly depleted in flagella. Within individual glycerophospholipid classes, we observed a preference for ether-type over diacyl-type molecular species in membranes of flagella. Our study provides direct evidence for a preferential presence of raft-forming phospholipids in flagellar membranes of T. brucei.

Keywords: Flagella; Lipid rafts; Mass spectrometry; Membrane lipids; Sphingolipids; Trypanosoma brucei.


Conflict of interest statement

Competing interests

The authors declare no competing or financial interests.

Figures

Fig. 1.
Fig. 1.
Isolation of pure flagella. (A) Growth curve of trypanosomes upon tetracycline-induction of double-stranded RNA targeting Tb927.10.2880. Knockdown of Tb927.10.2880 results in a growth defect after 2 days of induction. The inset shows the Northern blot analysis confirming the disappearance of the corresponding mRNA upon induction (top) and the ethidium bromide stained rRNA as loading control (bottom). (B) Differential interference contrast (DIC) micrographs of uninduced (− tet) and RNAi induced (+ tet) parasites. After 1 day of induction, flagella appear detached from the cell bodies. (C) DIC micrograph of isolated flagella. Mitochondrial and nuclear DNA was stained with DAPI, imaged by fluorescence microscopy and is shown in blue. Scale bar: 10 µm. (D) Flagella were spread on slides, fixed and processed for double immunofluorescence with the axoneme marker Mab25 (top panel) and with anti-calflagin as a membrane marker (middle panel). Merged images are shown at the bottom as indicated. Flagella commonly tend to curve under these conditions. Scale bars: 5 µm. (E) Flagellar preparations were fixed, sectioned and examined by transmission electron microscopy. Recognisable elements were overwhelmingly flagella and half of them possessed a membrane (black arrows). Axonemes apparently deprived of their membrane are indicated with a white arrow. Scale bar: 500 nm.
Fig. 2.
Fig. 2.
Reverse-phase liquid chromatography separation and MS spectra. (A,B) Total ion chromatograms of lipids extracted from isolated flagella (upper panels) and whole parasites (lower panels) acquired in negative (A) and positive (B) ionisation mode. Part of the chromatogram ranging from retention time 10 to 35 min is shown. (C,D) Sum spectra over the entire RT range in negative (C) and positive (D) mode of flagella (upper panels) and whole cells (lower panels).
Fig. 3.
Fig. 3.
Identification of phospholipid classes by MS. Representative total ion spectra of the most intense species of PC (A), PE (B), PI (C), PS (D), PG (E) and IPC (F). Parent ion spectra in positive (PC) or negative (PE, PI, PS, PG and IPC) ionisation mode are shown in the left panel, and the corresponding MS/MS fragment spectra are depicted in the right panel.
Fig. 4.
Fig. 4.
Elution profiles of selected phospholipid molecular species. (A) Elution profile of detected C36-PC molecular species in the positive ionisation mode of a whole cell lipid extract. (B) Elution profile of the most abundant ether-type PE molecular species detected in negative ionisation mode in whole cells. O refers to alkyl, P to alk-enyl molecular species.
Fig. 5.
Fig. 5.
Comparison of chromatograms of the most intense molecular species of different phospholipid classes acquired in negative ionisation mode. Total ion chromatograms and retention times of the three most intense species of PE, PC, SM, IPC and PI of lipid extracts from whole cells (A) or isolated flagella (B).
Fig. 6.
Fig. 6.
Relative changes in phospholipid composition between whole cells and flagella. (A,B) Mean signal intensities of two independent analyses of flagella relative to whole cells, obtained in negative ionisation mode (A) and positive ionisation mode (B) (mean values±s.e.m.). (C,D) Ratio (flagella to whole cells) of normalized signal intensities of each individual phospholipid detected in a given class in negative (C) and positive (D) ionisation mode. For clarity, species below a cut-off of 1% signal intensity relative to the most intense species were omitted. (E,F) Fraction of glycerophospholipids and sphingophospholipids detected in negative (E) or positive (F) ionisation mode represented as percentage of total lipids.
Fig. 7.
Fig. 7.
Phospholipid composition of T. brucei parasites and flagella. Left panel: The phospholipid composition of parasites was determined by two-dimensional thin-layer chromatography and lipid phosphorus quantification. The data are mean values from four separate determinations. Right panel: The phospholipid composition of flagella was calculated from the data shown in the left panel using the mean relative changes observed in two LC-MS analyses between flagella and whole cells.

References

    1. Bligh E. G. and Dyer W. J. (1959). A rapid method of total lipid extraction and purification. Can. J. Biochem. Physiol. 37, 911-917. 10.1139/o59-099 - DOI - PubMed
    1. Bochud-Allemann N. and Schneider A. (2002). Mitochondrial substrate level phosphorylation is essential for growth of procyclic Trypanosoma brucei. J. Biol. Chem. 277, 32849-32854. 10.1074/jbc.M205776200 - DOI - PubMed
    1. Brügger B., Erben G., Sandhoff R., Wieland F. T. and Lehmann W. D. (1997). Quantitative analysis of biological membrane lipids at the low picomole level by nano-electrospray ionisation tandem mass spectrometry. Proc. Natl. Acad. Sci. USA 94, 2339-2344. 10.1073/pnas.94.6.2339 - DOI - PMC - PubMed
    1. Brugger B., Glass B., Haberkant P., Leibrecht I., Wieland F. T. and Krausslich H.-G. (2006). The HIV lipidome: a raft with an unusual composition. Proc. Natl. Acad. Sci. USA 103, 2641-2646. 10.1073/pnas.0511136103 - DOI - PMC - PubMed
    1. Burger H.-M., Abel S., Snijman P. W., Swanevelder S. and Gelderblom W. C. A. (2007). Altered lipid parameters in hepatic subcellular membrane fractions induced by fumonisin B1. Lipids 42, 249-261. 10.1007/s11745-007-3025-9 - DOI - PubMed