

Distribution, activities, and interactions of methanogens and sulfate-reducing prokaryotes in the Florida Everglades
- PMID: 26276115
- PMCID: PMC4592856
- DOI: 10.1128/AEM.01583-15
Distribution, activities, and interactions of methanogens and sulfate-reducing prokaryotes in the Florida Everglades
Abstract
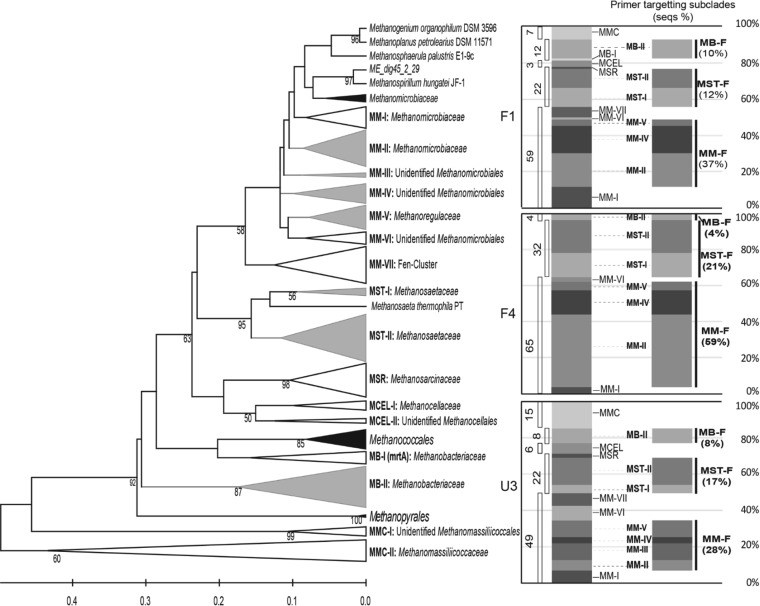
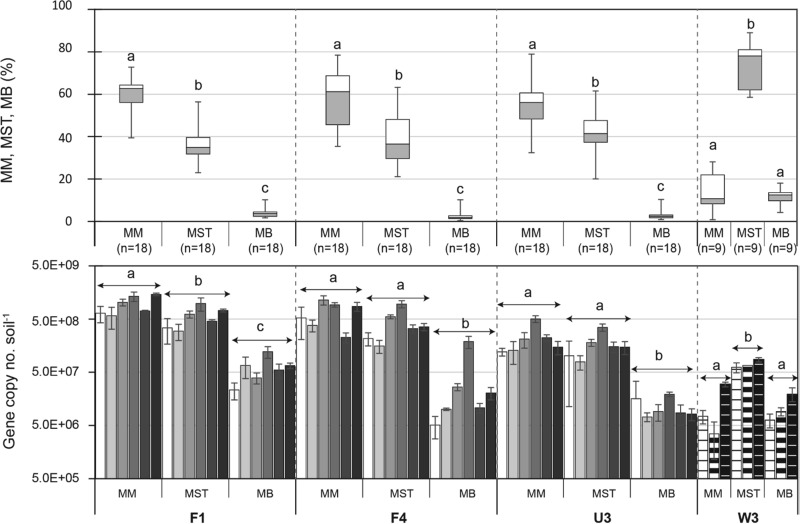
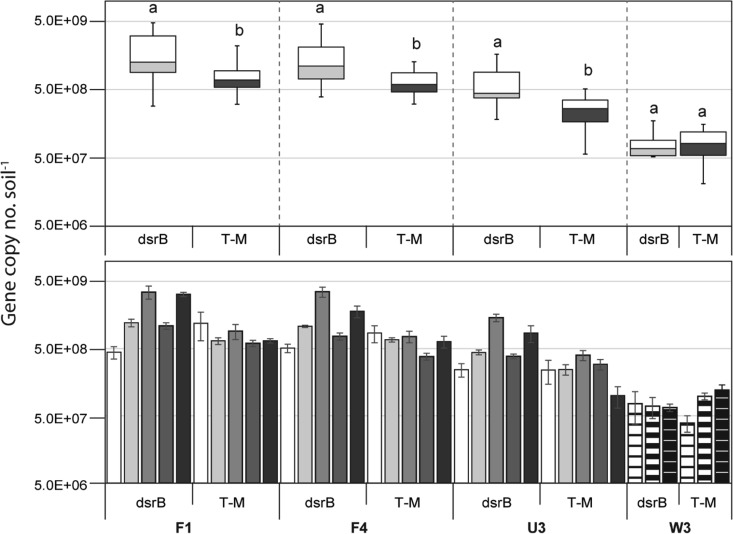
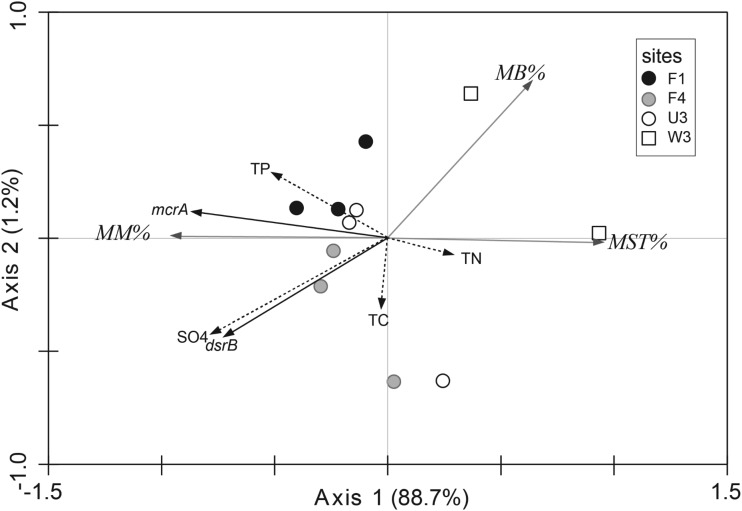
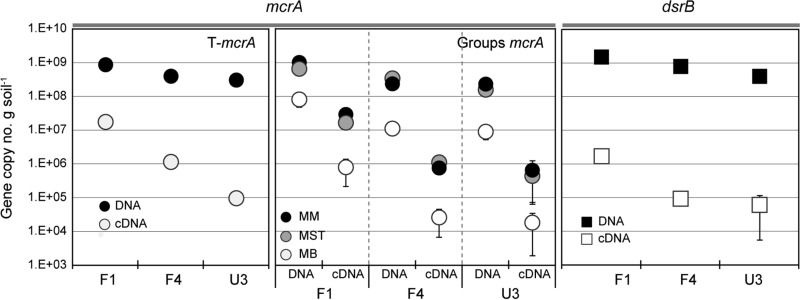
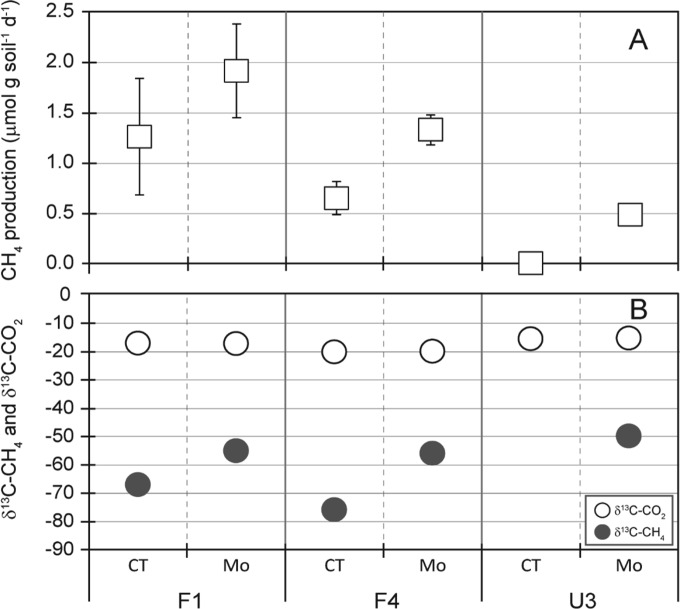
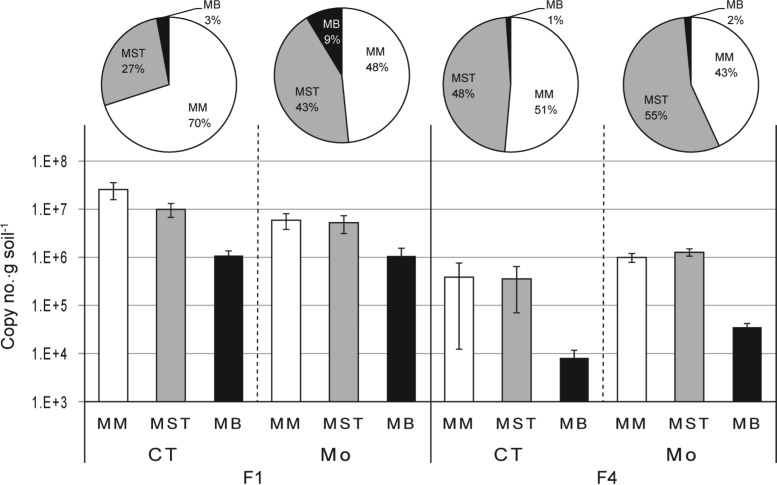
To gain insight into the mechanisms controlling methanogenic pathways in the Florida Everglades, the distribution and functional activities of methanogens and sulfate-reducing prokaryotes (SRPs) were investigated in soils (0 to 2 or 0 to 4 cm depth) across the well-documented nutrient gradient in the water conservation areas (WCAs) caused by runoff from the adjacent Everglades Agricultural Area. The methyl coenzyme M reductase gene (mcrA) sequences that were retrieved from WCA-2A, an area with relatively high concentrations of SO4 (2-) (≥39 μM), indicated that methanogens inhabiting this area were broadly distributed within the orders Methanomicrobiales, Methanosarcinales, Methanocellales, Methanobacteriales, and Methanomassiliicoccales. In more than 3 years of monitoring, quantitative PCR (qPCR) using newly designed group-specific primers revealed that the hydrogenotrophic Methanomicrobiales were more numerous than the Methanosaetaceae obligatory acetotrophs in SO4 (2-)-rich areas of WCA-2A, while the Methanosaetaceae were dominant over the Methanomicrobiales in WCA-3A (with relatively low SO4 (2-) concentrations; ≤4 μM). qPCR of dsrB sequences also indicated that SRPs are present at greater numbers than methanogens in the WCAs. In an incubation study with WCA-2A soils, addition of MoO4 (2-) (a specific inhibitor of SRP activity) resulted in increased methane production rates, lower apparent fractionation factors [αapp; defined as (amount of δ(13)CO2 + 1,000)/(amount of δ(13)CH4 + 1,000)], and higher Methanosaetaceae mcrA transcript levels compared to those for the controls without MoO4 (2-). These results indicate that SRPs play crucial roles in controlling methanogenic pathways and in shaping the structures of methanogen assemblages as a function of position along the nutrient gradient.
Copyright © 2015, American Society for Microbiology. All Rights Reserved.
Figures
References
-
- Stephens JC. 1956. Subsidence of organic soils in the Florida Everglades. Soil Sci Soc Am J 20:77–80. doi: 10.2136/sssaj1956.03615995002000010019x. - DOI
-
- Anderson B, Bartlett K, Frolking S, Hayhoe K, Jenkins J, Salas W. 2010. Methane and nitrous oxide emissions from natural sources, Environmental Protection Agency, Office of Atmospheric Programs, Washington, DC.
-
- Cicerone RJ, Oremland RS. 1988. Biogeochemical aspects of atmospheric methane. Global Biogeochem Cycles 2:299–327. doi: 10.1029/GB002i004p00299. - DOI
-
- Craft CB, Richardson CJ. 1993. Peat accretion and phosphorus accumulation along a eutrophication gradient in the northern Everglades. Biogeochemistry 22:133–156. doi: 10.1007/BF00002708. - DOI
-
- DeBusk WF, Reddy KR, Koch MS, Wang Y. 1994. Spatial distribution of soil nutrients in a northern Everglades marsh: Water Conservation Area 2A. Soil Sci Soc Am J 58:543–552. doi: 10.2136/sssaj1994.03615995005800020042x. - DOI
Publication types
MeSH terms
Substances
Associated data
- Actions
- Actions
- Actions
- Actions
- Actions
- Actions
- Actions
- Actions
- Actions
- Actions
- Actions
- Actions
- Actions
- Actions
- Actions
- Actions
- Actions
- Actions
- Actions
- Actions
- Actions
- Actions
- Actions
- Actions
- Actions
- Actions
- Actions
- Actions
- Actions
- Actions
- Actions
- Actions
- Actions
- Actions
- Actions
- Actions
- Actions
- Actions
- Actions
- Actions
- Actions
- Actions
- Actions
- Actions
- Actions
- Actions
- Actions
- Actions
- Actions
- Actions
- Actions
- Actions
- Actions
- Actions
- Actions
- Actions
- Actions
- Actions
- Actions
- Actions
- Actions
- Actions
- Actions
- Actions
- Actions
- Actions
- Actions
- Actions
- Actions
- Actions
- Actions
- Actions
- Actions
- Actions
- Actions
- Actions
- Actions
- Actions
- Actions
- Actions
- Actions
- Actions
- Actions
- Actions
- Actions
- Actions
- Actions
- Actions
- Actions
- Actions
- Actions
- Actions
- Actions
- Actions
- Actions
- Actions
- Actions
- Actions
- Actions
- Actions
- Actions
- Actions
- Actions
- Actions
- Actions
- Actions
- Actions
- Actions
- Actions
- Actions
- Actions
- Actions
- Actions
- Actions
- Actions
- Actions
- Actions
- Actions
- Actions
- Actions
- Actions
- Actions
- Actions
- Actions
- Actions
- Actions
- Actions
- Actions
- Actions
- Actions
- Actions
- Actions
- Actions
- Actions
- Actions
- Actions
- Actions
- Actions
- Actions
- Actions
- Actions
- Actions
- Actions
- Actions
- Actions
- Actions
- Actions
- Actions
- Actions
- Actions
- Actions
- Actions
- Actions
- Actions
- Actions
- Actions
- Actions
- Actions
- Actions
- Actions
- Actions
- Actions
- Actions
- Actions
- Actions
- Actions
- Actions
- Actions
- Actions
- Actions
- Actions
- Actions
- Actions
- Actions
- Actions
- Actions
- Actions
- Actions
- Actions
- Actions
- Actions
- Actions
- Actions
- Actions
- Actions
- Actions
- Actions
- Actions
- Actions
- Actions
- Actions
- Actions
- Actions
- Actions
- Actions
- Actions
- Actions
- Actions
- Actions
- Actions
- Actions
- Actions
- Actions
- Actions
- Actions
- Actions
- Actions
- Actions
- Actions
- Actions
- Actions
- Actions
- Actions
- Actions
- Actions
- Actions
- Actions
- Actions
- Actions
- Actions
- Actions
- Actions
- Actions
- Actions
- Actions
- Actions
- Actions
- Actions
- Actions
- Actions
- Actions
- Actions
- Actions
- Actions
- Actions
- Actions
- Actions
- Actions
- Actions
- Actions
- Actions
- Actions
- Actions
- Actions
- Actions
- Actions
- Actions
- Actions
- Actions
- Actions
- Actions
- Actions
- Actions
- Actions
- Actions
- Actions
- Actions
- Actions
- Actions
- Actions
- Actions
- Actions
- Actions
- Actions
- Actions
- Actions
- Actions
- Actions
- Actions
- Actions
- Actions
- Actions
- Actions
- Actions
- Actions
- Actions
- Actions
- Actions
- Actions
- Actions
- Actions
- Actions
- Actions
- Actions
- Actions
- Actions
- Actions
- Actions
- Actions
- Actions
- Actions
- Actions
- Actions
- Actions
- Actions
- Actions
- Actions
- Actions
- Actions
- Actions
- Actions
- Actions
- Actions
- Actions
- Actions
- Actions
- Actions
- Actions
- Actions
- Actions
- Actions
- Actions
- Actions
- Actions
- Actions
- Actions
- Actions
- Actions
- Actions
- Actions
- Actions
- Actions
- Actions
- Actions
- Actions
- Actions
- Actions
- Actions
- Actions
- Actions
- Actions
- Actions
LinkOut - more resources
Full Text Sources
