. 2015 Aug 13;162(4):738-50.
doi: 10.1016/j.cell.2015.07.020.

Clinical Sequencing Uncovers Origins and Evolution of Lassa Virus

Kristian G Andersen  1 B Jesse Shapiro  2 Christian B Matranga  3 Rachel Sealfon  4 Aaron E Lin  5 Lina M Moses  6 Onikepe A Folarin  7 Augustine Goba  8 Ikponmwonsa Odia  9 Philomena E Ehiane  9 Mambu Momoh  10 Eleina M England  3 Sarah Winnicki  5 Luis M Branco  11 Stephen K Gire  5 Eric Phelan  3 Ridhi Tariyal  3 Ryan Tewhey  5 Omowunmi Omoniwa  9 Mohammed Fullah  10 Richard Fonnie  8 Mbalu Fonnie  8 Lansana Kanneh  8 Simbirie Jalloh  8 Michael Gbakie  8 Sidiki Saffa  8 Kandeh Karbo  8 Adrianne D Gladden  3 James Qu  3 Matthew Stremlau  5 Mahan Nekoui  5 Hilary K Finucane  3 Shervin Tabrizi  5 Joseph J Vitti  12 Bruce Birren  3 Michael Fitzgerald  3 Caryn McCowan  3 Andrea Ireland  3 Aaron M Berlin  3 James Bochicchio  3 Barbara Tazon-Vega  3 Niall J Lennon  3 Elizabeth M Ryan  3 Zach Bjornson  13 Danny A Milner Jr  14 Amanda K Lukens  14 Nisha Broodie  15 Megan Rowland  11 Megan Heinrich  11 Marjan Akdag  11 John S Schieffelin  6 Danielle Levy  6 Henry Akpan  16 Daniel G Bausch  6 Kathleen Rubins  17 Joseph B McCormick  18 Eric S Lander  3 Stephan Günther  19 Lisa Hensley  20 Sylvanus Okogbenin  9 Viral Hemorrhagic Fever ConsortiumStephen F Schaffner  3 Peter O Okokhere  9 S Humarr Khan  8 Donald S Grant  8 George O Akpede  9 Danny A Asogun  9 Andreas Gnirke  3 Joshua Z Levin  3 Christian T Happi  21 Robert F Garry  6 Pardis C Sabeti  22
Affiliations

Clinical Sequencing Uncovers Origins and Evolution of Lassa Virus

Kristian G Andersen et al. Cell. .

Abstract

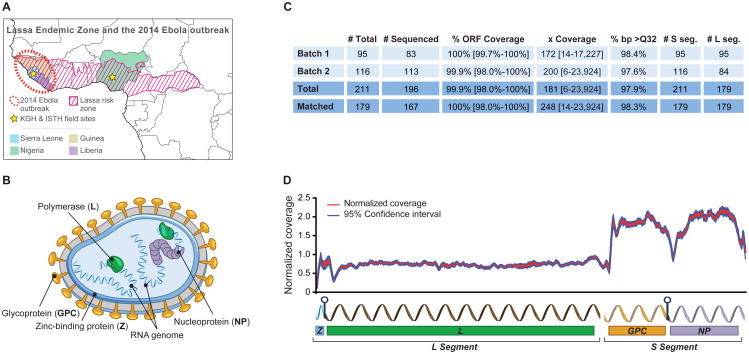
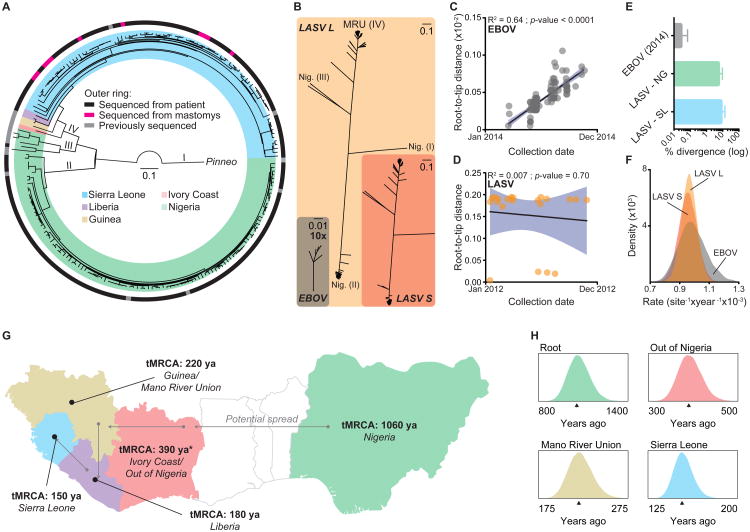
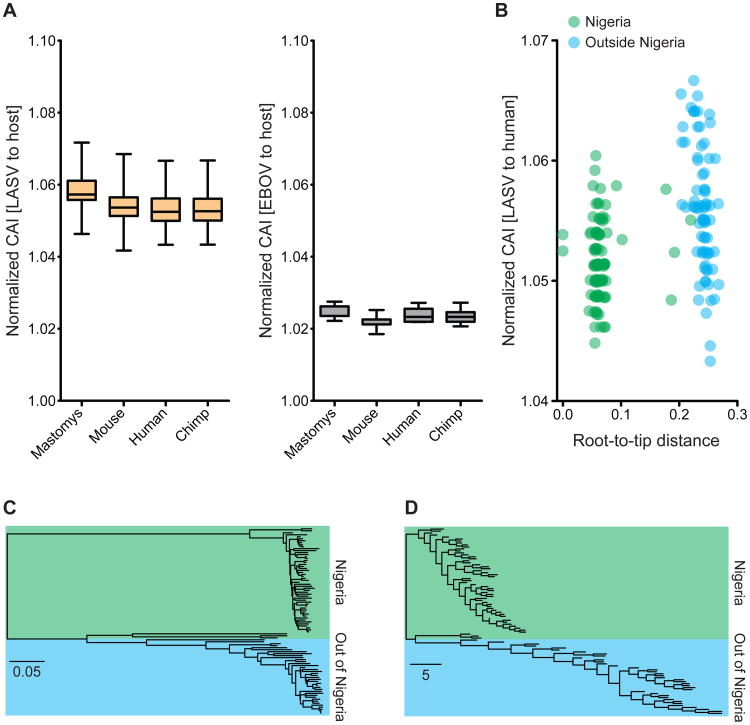
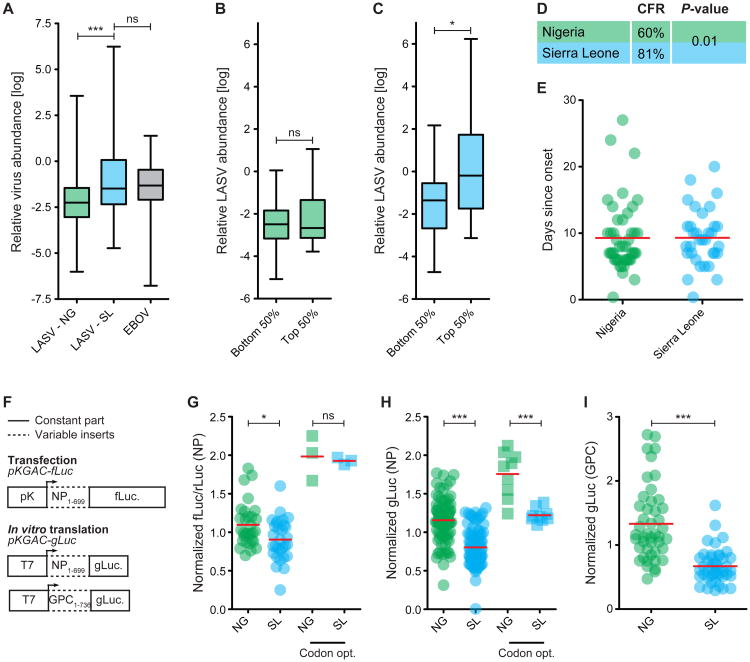
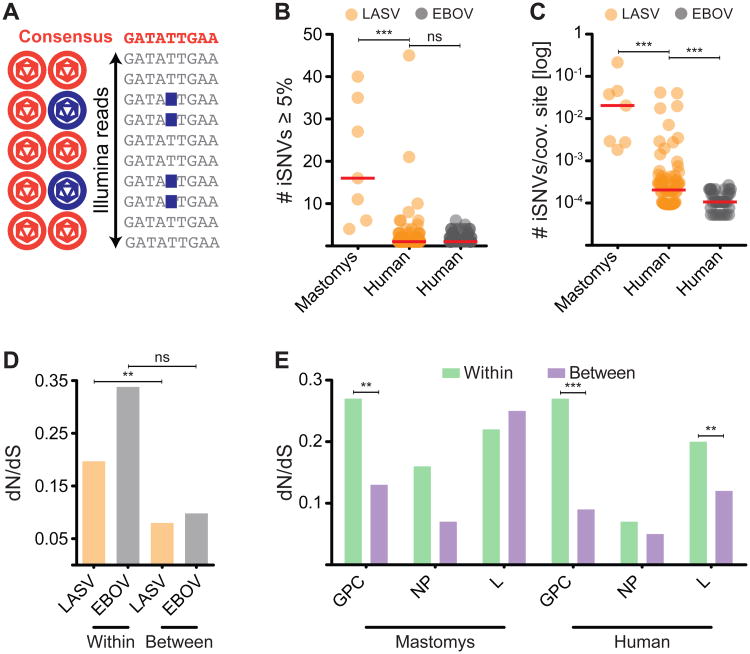
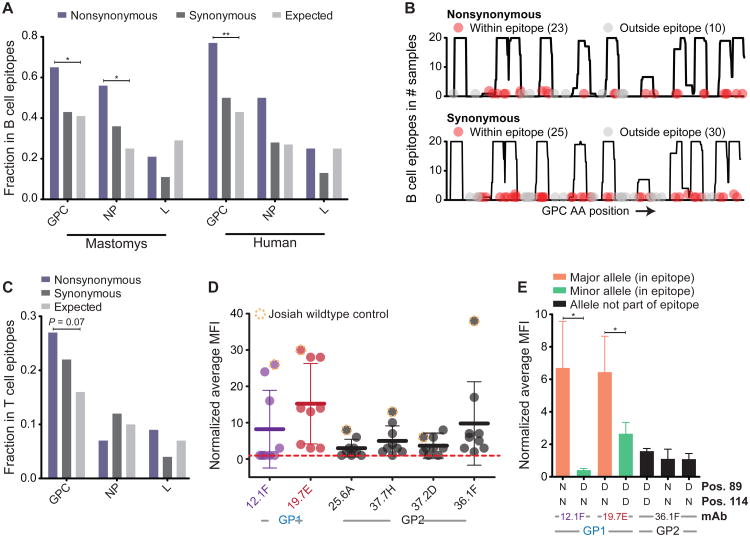
The 2013-2015 West African epidemic of Ebola virus disease (EVD) reminds us of how little is known about biosafety level 4 viruses. Like Ebola virus, Lassa virus (LASV) can cause hemorrhagic fever with high case fatality rates. We generated a genomic catalog of almost 200 LASV sequences from clinical and rodent reservoir samples. We show that whereas the 2013-2015 EVD epidemic is fueled by human-to-human transmissions, LASV infections mainly result from reservoir-to-human infections. We elucidated the spread of LASV across West Africa and show that this migration was accompanied by changes in LASV genome abundance, fatality rates, codon adaptation, and translational efficiency. By investigating intrahost evolution, we found that mutations accumulate in epitopes of viral surface proteins, suggesting selection for immune escape. This catalog will serve as a foundation for the development of vaccines and diagnostics. VIDEO ABSTRACT.


Figures

Figure 1
Figure 1. Lassa fever is a viral hemorrhagic fever endemic in West Africa where Ebola virus disease broke out in 2014
(A) Overview of the LF endemic zone. Study sites are marked. The LF risk zone was defined according to Fichet-Calvet et al. (Fichet-Calvet and Rogers, 2009). (B) Schematic of LASV virions. (C) Summary of LASV sequence data (% ORF Coverage = average coverage of open reading frames; x Coverage = median base pair (bp) coverage; % bp > Q32 = fraction of bp with a phred-score > 32. (D) Plot of the combined normalized (to the sample average) genome coverages (Matched dataset, n = 167). See also Figure S1 and Table S1.
Figure 2
Figure 2. LASV is more diverse than EBOV and has ancient origins in Nigeria
(A) Phylogenetic tree of LASV S segments (n = 211) (outer ring: gray = previously sequenced; orange = sequenced from M. natalensis; scale bar = nucleotide substitutions/site; I – IV = lineages as defined by Bowen et al. (Bowen et al., 2000)). (B) Scaled trees of LASV L and S segments, as well as EBOV. Trees are shown with the same scale of genetic distance (0.1 nucleotide substitutions/site), except for EBOV, which was magnified 10× (0.01 nucleotide substitutions/site). LASV lineages are shown (Nig. = Nigeria; MRU = Mano River Union). (C, D) Root-to-tip distance versus collection date for (C) EBOV from the West African EVD epidemic (2014; n = 131), or (D) LASV from Sierra Leone (2012; n = 21). Confidence intervals (95%) for linear regression fits are shown in blue. (E) The % pairwise differences (log scale) in EBOV lineages from the 2014 EVD epidemic (March-October, 2014; n = 116) and LASV lineages from Sierra Leone (SL; 2009-2013; n = 60) and Nigeria (NG; 2009-2012; n = 83). The % divergence was calculated within the countries for each year separately and pooled. Error-bars represent the standard deviation. (F-H) Bayesian coalescent analysis of LASV samples (Matched dataset, n = 179). (F) Substitution rates. (G) LASV L segment tMRCA for each country (median values; ya = years ago). Gray arrows depict the likely spread of LASV. * = This tMRCA was dependent on only one sequence (AV) from outside Nigeria and MRU. (H) Probability distributions for the estimated tMRCAs with median marked. See also Figures S1F-H, S2-S4, Table S2, and Files S1-S3.
Figure 3
Figure 3. Increased codon adaptation of non-Nigerian LASV strains
(A) Codon adaptation index (CAI) of individual LASV (orange) and EBOV (gray) sequences to four mammalian hosts, normalized by GC and amino acid content. (B) Normalized CAI (to human) of LASV sequences plotted against their distance (aa substitutions/site) to the root of the tree. (C) Phylogeny of the LASV L genes (scale bar = substitutions/site). (D) A phenogram depicting the phylogeny from C with branch lengths representing CAI (scale bar = converted Z-score). (C, D) Trees were rooted on Pinneo (not shown; Batch 1 dataset). See also Figure S5A-H.
Figure 4
Figure 4. Difference in viral output between Nigerian and Sierra Leonean LASV strains
(A) Relative abundance of LASV and EBOV genome copies (log ratio of LASV or EBOV copies/μl to 18S rRNA copies/μl; *** = P-value < 0.001, Mann-Whitney test). (B, C) Relative abundance of LASV genome copies when partitioned into sequences in the top or bottom half of CAI scores. (B) Samples from Nigeria. (C) Samples from Sierra Leone (* = P-value < 0.05, Mann-Whitney test). (D) Case-fatality rates calculated for patients from Sierra Leone (n = 67) and Nigeria (n = 40). P-values from Fisher's exact test. (E) Patient-reported days from the onset of symptoms until admission to the hospital. Mean values are displayed with red bars. (F) DNA plasmids encoding the first 699 nucleotides of LASV NP or the first 736 nucleotides of LASV GPC. (G) NP-reporter expression was measured in HEK293 cells by the ratio of fLuc/rLuc 20 hours post transfection. (H, I) In vitro transcription of (H) NP- or (I) GPC-reporter translation measured by gLuc luminescence after 21 hours. (G-I) All values were normalized to the average of each biological replicate (n = 3). * = P-value < 0.05, *** = P-value < 0.0001, Mann-Whitney test; NG = Nigeria, SL = Sierra Leone. See also Table S2.
Figure 5
Figure 5. Genetic diversity and selective pressures within and between hosts
(A) iSNVs can be detected in Illumina reads. (B) Number of iSNVs at 5% MAF or higher, called in LASV (orange) and EBOV (gray). (C) Normalized number of iSNVs per covered site (80% calling power; 5% MAF). In both (B) and (C) each circle represents one LASV or EBOV sample; red bars denote the median; *** = P-value < 0.001, Mann-Whitney test; ns = not significant. Only samples with > 50× coverage were included. (D) dN/dS ratios for LASV and EBOV based on iSNVs or fixed differences in consensus sequences between hosts. (E) dN/dS ratios for each LASV gene. (D-E) *** = P-value < 0.001, ** = P-value < 0.01, Permutation test; ns = not significant. The very short Z gene was excluded. See also Figures S5J-L, S6, and S7, Table S2, and File S1.
Figure 6
Figure 6. Nonsynonymous iSNVs are over-represented within predicted B cell epitopes in LASV GPC
(A) Fraction of iSNVs within predicted B cell epitopes. The observed fraction is compared to the expected fraction (** = P-value < 0.01, * = P-value < 0.05, Binomial test). (B) Overlap between GPC epitopes and iSNVs. Epitopes were predicted separately in each sample (y-axis) and overlaid with iSNVs from that sample. (C) Fraction of iSNVs falling within predicted T cell epitopes (P-value = Binomial test). (D, E) Binding of monoclonal antibodies (mAbs) to iSNV mutants in predicted B cell epitopes was tested in HEK293 cells. (D) Each circle correspond to the normalized average mean fluorescence intensity (MFI) measured by flow cytometry of each LASV GPC construct carrying either wildtype or iSNV mutations (Extended Experimental Procedures). Each tested mAb is shown on the x-axis. The MFI was normalized to the MFI of the empty vector control for each experiment. (E) Binding to the GP1-specific mAbs 12.1F and 19.7E using constructs carrying either the major or minor population-wide allele at positions 89 and 114. For comparison, binding to mAb 36.1F, which requires GP2, is also shown. All MFI values were normalized to the MFI of binding to the GP2-specific mAb 37.2D. (D, E) Error-bars show the standard-deviation from four independent experiments; * = P-value < 0.05, Mann-Whitney test. See also Figure S7I, Table S2, and File S1.
Figure 7
Figure 7. Biased fixation of nonsynonymous iSNVs
(A) iSNVs that are never observed as fixed differences between consensus sequences have a higher N/S ratio in both LASV and EBOV. (B) LASV iSNVs are more commonly seen as fixed differences than EBOV iSNVs. The data displayed in (A) and (B) are tabulated in the top two panels of (C). (C) Biased fixation of iSNVs at the population-wide level (‘All iSNVs’) and in a pair of M. natalensis (‘Z0947 iSNVs’). At the population level (top and middle tables), the ‘Fixed?’ column indicates whether or not the minor iSNV allele is observed in any other LASV (top) or EBOV (middle) consensus sequences. The ‘DAF’ columns indicates the derived allele frequency in Z0947, with derived/ancestral allele states inferred from Z0948. 1Fixation criterion: the minor iSNV is fixed (100%) in one or more other consensus sequences. 2The DAF is defined as the frequency in Z0947 of the allele not fixed in the Z0948 consensus sequence. See also Figure S7H.

Comment in

References

    1. Andersen KG, Shylakhter I, Tabrizi S, Grossman SR, Happi CT, Sabeti PC. Genome-wide scans provide evidence for positive selection of genes implicated in Lassa fever. Philos Trans R Soc Lond B Biol Sci. 2012;367:868–877. - PMC - PubMed
    1. Anisimova M, Liberles DA. The quest for natural selection in the age of comparative genomics. Heredity (Edinb) 2007;99:567–579. - PubMed
    1. Bahir I, Fromer M, Prat Y, Linial M. Viral adaptation to host: a proteome-based analysis of codon usage and amino acid preferences. Mol Syst Biol. 2009;5:311. - PMC - PubMed
    1. Baize S, Marianneau P, Loth P, Reynard S, Journeaux A, Chevallier M, Tordo N, Deubel V, Contamin H. Early and strong immune responses are associated with control of viral replication and recovery in lassa virus-infected cynomolgus monkeys. J Virol. 2009;83:5890–5903. - PMC - PubMed
    1. Baize S, Pannetier D, Oestereich L, Rieger T, Koivogui L, Magassouba N, Soropogui B, Sow MS, Keïta S, De C Hilde, Tiffany A, Dominguez G, Loua M, Traoré A, Kolié M, Malano ER, Heleze E, Bocquin A, Mély S, Raoul H, Caro V, Cadar D, Gabriel M, Pahlmann M, Tappe D, Schmidt-Chanasit J, Impouma B, Diallo AK, Formenty P, Van H Michel, Günther S. Emergence of Zaire Ebola Virus Disease in Guinea —Preliminary Report. N Engl J Med. 2014 140416140039002. - PubMed

Publication types

MeSH terms

Associated data