

Inflammatory and cardiac biomarkers are differentially expressed in clinical stages of Chagas disease
- PMID: 26277551
- PMCID: PMC4868386
- DOI: 10.1016/j.ijcard.2015.07.040
Inflammatory and cardiac biomarkers are differentially expressed in clinical stages of Chagas disease
Abstract
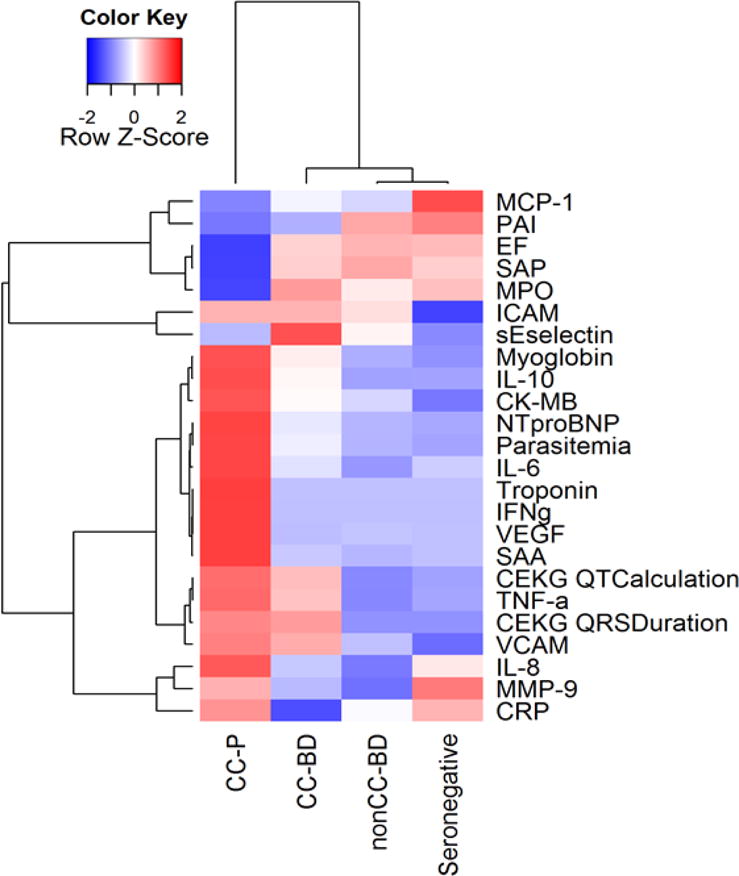
Background: Chagas disease has a long clinically silent period following Trypanosoma cruzi infection and before development of overt clinical pathology; detectable biomarkers of infection and pathogenesis are urgently needed. We tested 22 biomarkers known to be associated with cardiomyopathy to evaluate if a biomarker signature could successfully classify T. cruzi seropositive subjects into clinical Chagas disease stage groups.
Methods: This cross-sectional retrospective case-control study enrolled T. cruzi seropositive blood donors (BD) who were further characterized as having chronic Chagas cardiomyopathy (CC-BD) or not (nonCC-BD) and seronegative (SN) control donors; we also included clinically diagnosed Chagas cardiomyopathy patients (CC-P). All subjects underwent a health history questionnaire, medical examination, electro- and echocardiograms (ECG and Echo) and phlebotomy. Biomarkers were measured on blinded samples by luminex bead array and Ortho VITROS.
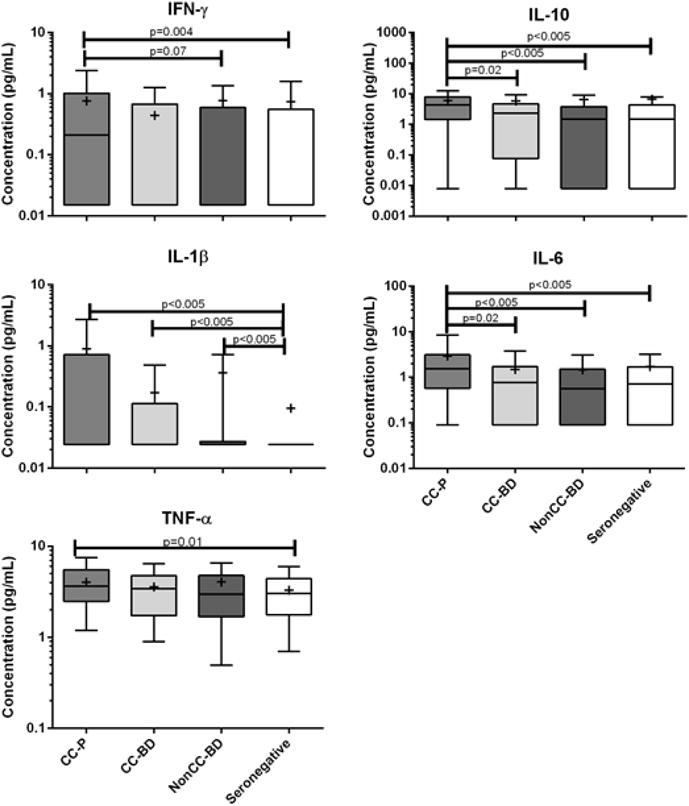
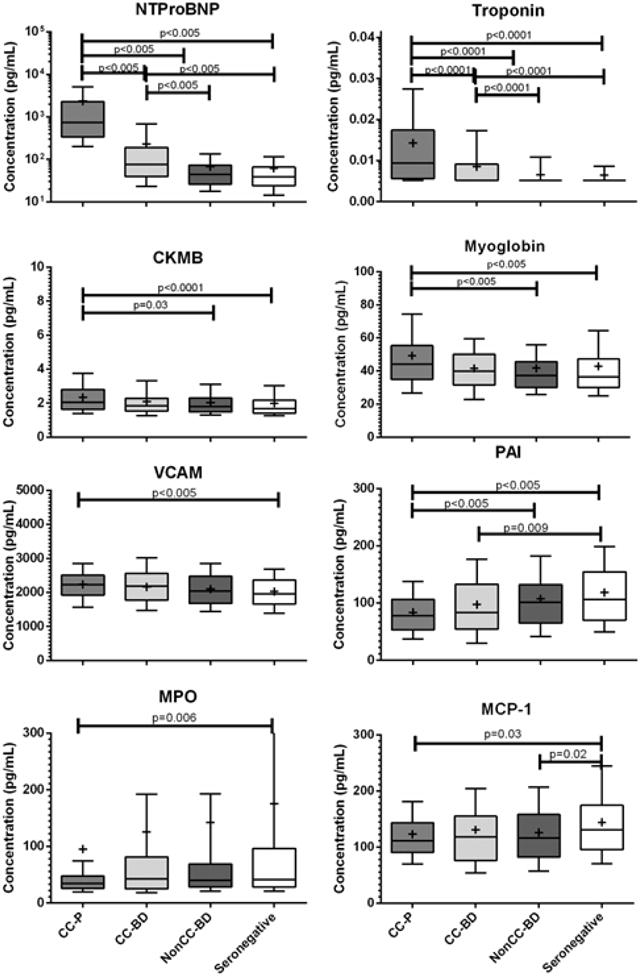
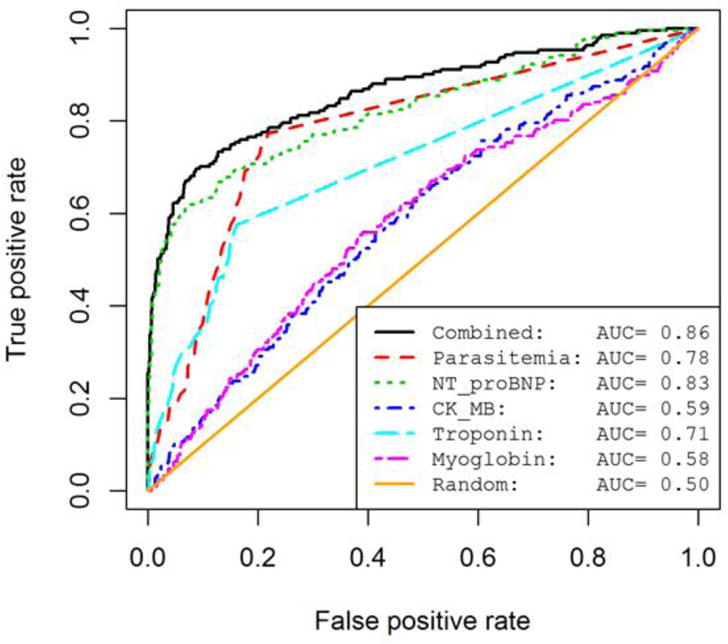
Results: A clear biomarker pattern was observed only in more severe cardiac disease; this pattern included significantly elevated levels of inflammatory cytokines IFN-γ, IL-6, IL-10 and TNF-α and soluble cardiovascular disease biomarkers CK-MB, troponin, myoglobin, VCAM and NTproBNP while there were lower levels of MPO, PAI-1, and MCP-1. The markers determined to be the most predictive of disease by ROC curve analysis were NTproBNP and T. cruzi PCR status.
Conclusions: Although many biomarkers demonstrated increased or decreased concentrations among the clinical forms of Chagas disease, NTproBNP and T. cruzi PCR were the only tests that would independently be of clinical value for disease staging, in concert with ECG, Echo and clinical assessments.
Keywords: Cardiomyopathy; Chemokines; Cytokines; Inflammation; Trypanosoma cruzi (T. cruzi).
Copyright © 2015 Elsevier Ireland Ltd. All rights reserved.
Figures
References
-
- Ribeiro AL, Nunes MP, Teixeira MM, Rocha MO. Diagnosis and management of Chagas disease and cardiomyopathy. Nat Rev Cardiol. 2012;9:576–589. - PubMed
-
- Rocha MO, Ribeiro AL, Teixeira MM. Clinical management of chronic Chagas cardiomyopathy. Front Biosci. 2003;8:e44–54. - PubMed
-
- Rocha MO, Teixeira MM, Ribeiro AL. An update on the management of Chagas cardiomyopathy. Expert Rev Anti Infect Ther. 2007;5:727–743. - PubMed
-
- Lima-Costa MF, Matos DL, Ribeiro AL. Chagas disease predicts 10-year stroke mortality in community-dwelling elderly: the Bambui cohort study of aging. Stroke. 2010;41:2477–2482. - PubMed
Publication types
MeSH terms
Substances
Grants and funding
LinkOut - more resources
Full Text Sources
Other Literature Sources
Research Materials
Miscellaneous
