Comparative Study
. 2015 Dec;95(6):713-721.
doi: 10.1016/j.tube.2015.07.001. Epub 2015 Aug 1.

A side-by-side comparison of T cell reactivity to fifty-nine Mycobacterium tuberculosis antigens in diverse populations from five continents

Affiliations
Comparative Study

A side-by-side comparison of T cell reactivity to fifty-nine Mycobacterium tuberculosis antigens in diverse populations from five continents

Chelsea Carpenter et al. Tuberculosis (Edinb). 2015 Dec.

Abstract

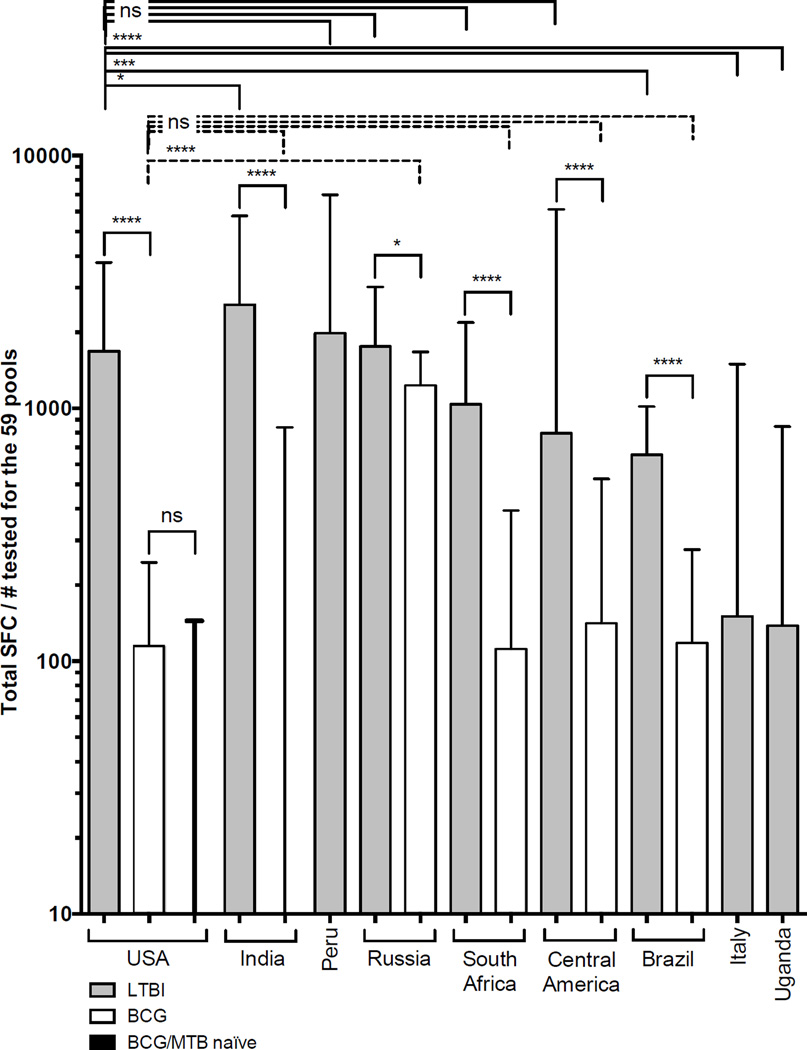
We compared T cell recognition of 59 prevalently recognized Mycobacterium tuberculosis (MTB) antigens in individuals latently infected with MTB (LTBI), and uninfected individuals with previous BCG vaccination, from nine locations and populations with different HLA distribution, MTB exposure rates, and standards of TB care. This comparison revealed similar response magnitudes in diverse LTBI and BCG-vaccinated cohorts and significant correlation between responses in LTBIs from the USA and other locations. Many antigens were uniformly recognized, suggesting suitability for inclusion in vaccines targeting diverse populations. Several antigens were similarly immunodominant in LTBI and BCG cohorts, suggesting applicability for vaccines aimed at boosting BCG responses. The panel of MTB antigens will be valuable for characterizing MTB-specific CD4 T cell responses irrespective of ethnicity, infecting MTB strains and BCG vaccination status. Our results illustrate how a comparative analysis can provide insight into the relative immunogenicity of existing and novel vaccine candidates in LTBIs.

Keywords: BCG; CD4; LTBI; T cell antigen; Tuberculosis; Vaccine.


Conflict of interest statement

Conflicts of interest: none

Figures

Figure 1
Figure 1. Reactivity to selected antigens in all tested cohorts
Reactivity as total SFC/number of tested donors for each individual cohort, LTBI (grey bars), BCG (white bars) and MTB naïve (black bar, third from left). Median ± interquartile range is shown. Two-tailed Mann-Whitney test, ****, p<0.0001, ***, p<0.001, *, p<0.05 and ns, no significant difference. Dashed lines indicate comparison between USA BCG and other BCG cohorts, solid lines indicate comparison between LTBI versus LTBI or LTBI versus BCG.
Figure 2
Figure 2. Correlation between immunodominance and immunogenicity
Correlation of average ranking of response frequency (x-axis) versus average ranking of magnitude (y-axis) calculated from all 9 LTBI cohorts. Previously known T cell antigens (grey dots), antigens currently in vaccine trials (blue dots), IGRA antigens (red dots) and novel T cell antigens (black dots). Box indicates top 20 antigens of the 59 selected. Correlation is indicated by Spearman r and associated two-tailed p-value.
Figure 3
Figure 3. Uniformity of antigen recognition
Correlation of average ranking of magnitude (A) or response frequency (B) (y-axis) versus standard deviation of ranking (x-axis). Top 20 antigens are above the horizontal dashed line. Uniform recognition SD <10 and heterogeneous recognition SD >10 indicated by vertical dashed line. Previously known T cell antigens (grey dots), antigens currently in vaccine trials (blue dots), IGRA antigens (red dots) and novel T cell antigens (black dots). Correlation is indicated by Spearman r and associated two-tailed p-value, ns, no significant correlation.
Figure 4
Figure 4. Shared dominant antigen recognition in BCG versus LTBI
Correlation of average ranking of response frequency (A) or magnitude (B) in BCG (y-axis) versus average ranking in LTBI (x-axis). Shared dominant antigens (average ranking >20) are indicated by box (small dashes) and LTBI-specific antigens are indicated by dashed box. Previously known T cell antigens (grey dots), antigens currently in vaccine trials (blue dots), IGRA antigens (red dots) and novel T cell antigens (black dots). Correlation is indicated by Spearman r and associated two-tailed p-value.

References

    1. Comstock GW. Epidemiology of tuberculosis. Am Rev Respir Dis. 1982;125:8–15. - PubMed
    1. Kaufmann SH. Is the development of a new tuberculosis vaccine possible? Nat Med. 2000;6:955–960. - PubMed
    1. Andrews JR, Noubary F, Walensky RP, Cerda R, Losina E, Horsburgh CR. Risk of progression to active tuberculosis following reinfection with Mycobacterium tuberculosis. Clinical infectious diseases : an official publication of the Infectious Diseases Society of America. 2012;54:784–791. - PMC - PubMed
    1. Lindestam Arlehamn CS, Lewinsohn D, Sette A, Lewinsohn D. Antigens for CD4 and CD8 T cells in tuberculosis. Cold Spring Harbor perspectives in medicine. 2014;4:a018465. - PMC - PubMed
    1. Winslow GM, Cooper A, Reiley W, Chatterjee M, Woodland DL. Early T-cell responses in tuberculosis immunity. Immunol Rev. 2008;225:284–299. - PMC - PubMed

Publication types

MeSH terms