. 2015 Nov;9(9):1877-89.
doi: 10.1016/j.molonc.2015.07.003. Epub 2015 Aug 4.

CARF (Collaborator of ARF) overexpression in p53-deficient cells promotes carcinogenesis

Affiliations

CARF (Collaborator of ARF) overexpression in p53-deficient cells promotes carcinogenesis

Rajkumar S Kalra et al. Mol Oncol. 2015 Nov.

Abstract

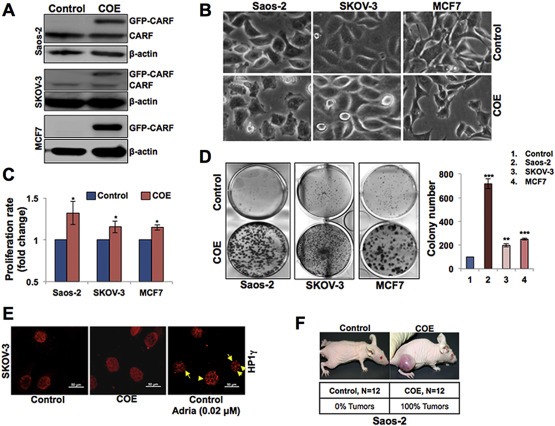
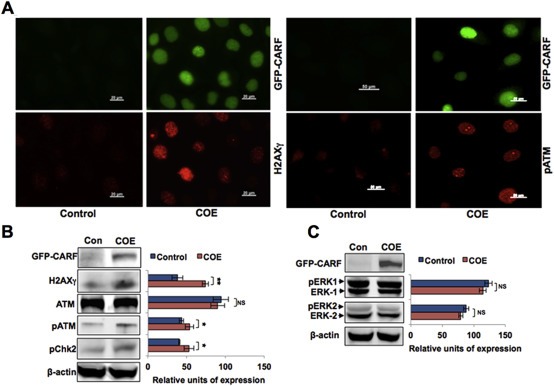
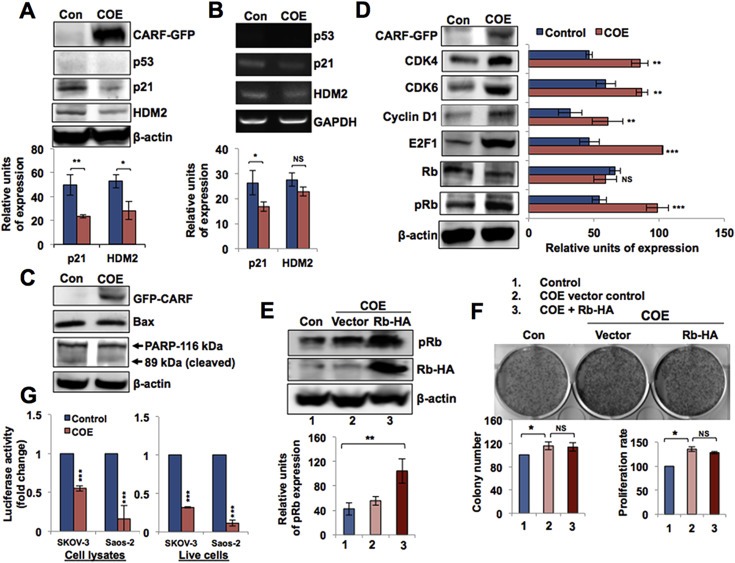
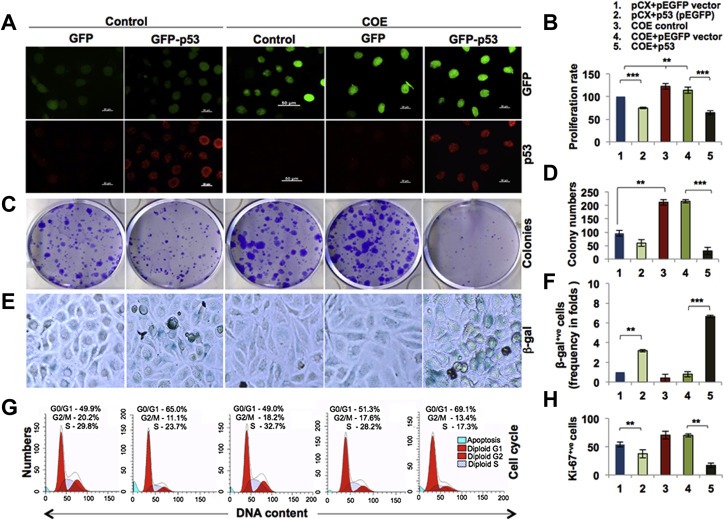
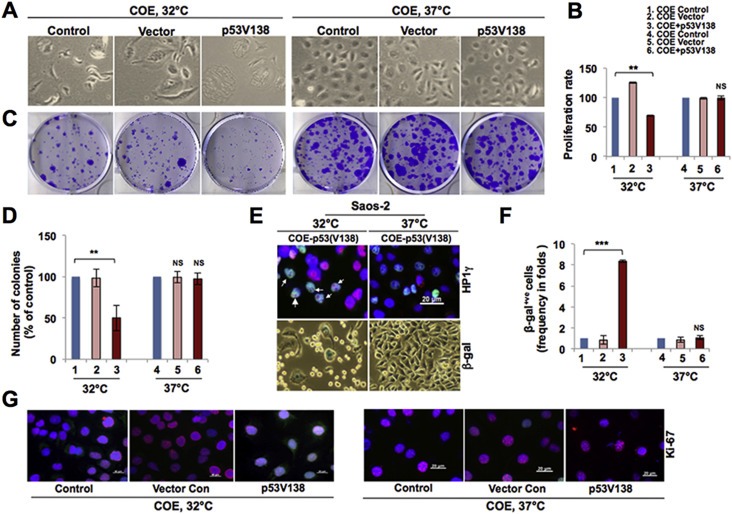
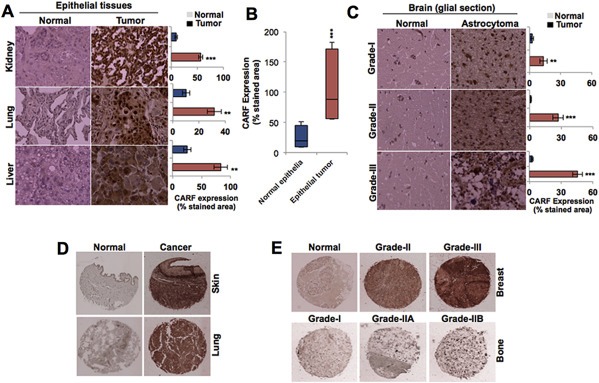
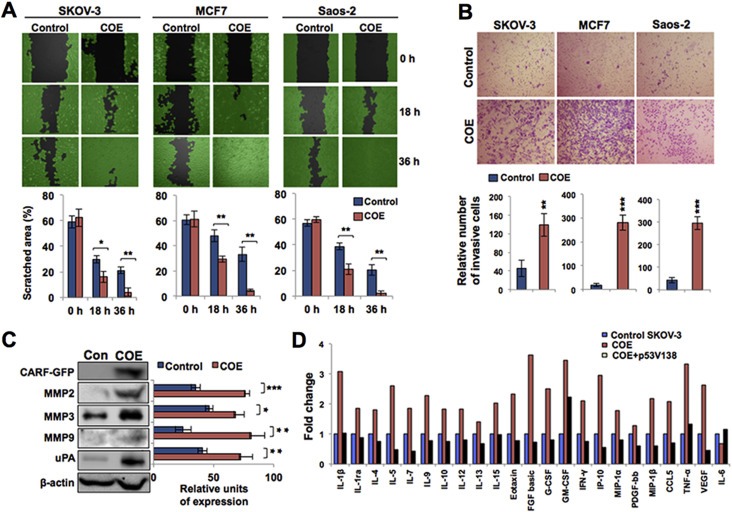
Collaborator of ARF (CARF), initially identified as a binding partner of ARF (Alternate Reading Frame), has been shown to activate ARF-p53 pathway by multiple ways including stabilization of ARF and p53 tumor suppressor proteins, and transcriptional repression of a p53 antagonist, HDM2. Level of CARF expression was shown to determine fate of cells. Whereas its knockdown caused apoptosis, its over- and super-expressions caused senescence and increase in malignant properties of cancer cells, respectively, and were closely linked to increase and decrease in p53 activity. Using p53-compromised cancer cells, we demonstrate that CARF induces growth arrest when wild type p53 is present and in p53-absence, it promotes carcinogenesis. Biochemical analyses on CARF-induced molecular signaling revealed that in p53-null cells, it caused transcriptional repression of p21(WAF1) leading to increase in CDK4, CDK6, pRb and E2F1 resulting in continued cell cycle progression. Furthermore, it instigated increase in migration and invasion of cancer cells that was marked by upregulation of MMP2, MMP3, MMP9, uPA, several interleukins and VEGF expression. Consistent with these findings, we found that human clinical samples of epithelial and glial cancers (frequently marked by loss of p53 function) possessed high level of CARF expression showing a relationship with cancer aggressiveness. The data demonstrated that CARF could be considered as a diagnostic marker and a therapeutic target in p53-compromised malignancies.

Keywords: CARF (Collaborator of ARF); Growth arrest; Overexpression; Proliferation; p53 reconstitution; p53-Deficient cancer cells.


Figures

Figure 1
Figure 1
CARF overexpression promotes proliferation in p53‐compromised cancer cells. A, Immunoblotting with anti‐GFP antibody for GFP‐CARF (110‐kDa) in Saos‐2, SKOV‐3 and MCF7 cells. β‐actin was used as a loading control. B, Bright field phase contrast images showing morphology of control (pCX4neo vector) and CARF‐transfected Saos‐2, SKOV‐3 and MCF7 cells. C, Quantitation of cell proliferation of control and COE Saos‐2, SKOV‐3 and MCF7 cells. D, Images of crystal violet‐stained colonies of control and CARF‐transfected Saos‐2, SKOV‐3 and MCF7 cells on 12 day. Quantitation of colony number from three independent experiments is shown on the right. E, Immunostaining for HP1γ (red) in control, COE and adriamycin‐treated (0.025 μM) COE cells, yellow arrows indicate nuclear HP1γ foci. F, Nude mice showing tumor formation following injection of COE Saos‐2 cells. Control cells did not form tumors in any of the 12 mice in three independent experiments. Injection of COE Saos‐2 cells showed large tumors in all the mice.
Figure 2
Figure 2
DNA‐damage response is activated in p53‐compromised COE cells. A, Immunostaining of control (pCX4neo vector) and GFP‐CARF‐transfected SKOV‐3 cells for H2AXγ and pATM (both red) show nuclear foci in the latter. B, Immunoblotting for GFP, H2AXγ, ATM, pATM, pChk2 and β‐actin in control and COE cells. Quantitation, after normalization with β‐actin, is shown in the right C, Immunoblotting for GFP, ERK‐1, ERK‐2, pERK1 and pERK2 levels. β‐actin was used as a loading control. Quantitation after normalization with β‐actin is shown on the right.
Figure 3
Figure 3
Transcriptional repression of p21WAF1 and activation of the pRb/E2F1 proliferative pathway in p53‐compromised COE cells. A, Immunoblotting with anti‐GFP, ‐p53, ‐p21, ‐HDM2 and ‐β‐actin antibodies in control (pCX4neo‐transfected) and COE cells. Quantitation (below) after normalization with β‐actin from three independent experiments shows reduced p21 and HDM2 protein levels. B, RT‐PCR analysis of p53, p21, HDM2 and GAPDH mRNA levels in control and COE cells. Quantitation (below) after normalization with GAPDH shows decrease in p21 and HDM2 transcripts. C, Immunoblotting for GFP‐CARF, Bax, PARP1 and β‐actin. D, Immunoblotting for GFP, CDK4, CDK6, Cyclin D1, E2F1, Rb, pRb and β‐actin in control and COE cells. Quantitation on the right shows their relative level of expression after normalization with β‐actin. E, Immunoblotting with anti‐pRb, ‐HA tag, and ‐β‐actin antibodies in pCX4neo (Con), COE + pSGL5 control (vector), and COE + pRb cells. Quantitation of pRb expression level is shown below after normalization with β‐actin. F, Images showing crystal violet‐stained colonies of SKOV‐3 cells transfected with pCX4neo control, COE + pSGL5 control (vector) and COE + pRb. Quantitation of number of colonies and results of the MTT proliferation assay in these cells are shown below. G, p21WAF‐1 promoter driven reporter assay in p53‐deficient control and COE cells showing its repression in the latter.
Figure 4
Figure 4
Restoration of p53 caused growth arrest and led to senescence in COE cells. A, GFP fluorescence and p53 staining (red) is shown in control (GFP), GFP‐p53, and COE (GFP‐tagged CARF overexpressing)‐with and without GFP‐p53 SKOV‐3 cells. B, Quantitation of cell proliferation by MTT assay in control and COE cells with/without GFP‐p53 at 48 h post‐transfections. C, Images showing crystal violet‐stained colonies of control and COE cells with/without GFP‐p53 (12 days post‐transfection). D, Quantitation of colony number from three independent experiments. E, Senescence associated β‐galactosidase staining (blue) in control and COE cells with/without GFP‐p53 at 48 h post‐transfections. F, Quantitation of β‐galactosidase staining from three independent experiments in the respective cells. G, Mod‐Fit based analysis of cell cycle profiles of control and COE cells with/without GFP‐p53. H, Quantitation of Ki‐67 positive cells as assessed by immunostaining in pCX4neo (control) and COE cells with/without GFP‐p53.
Figure 5
Figure 5
Restoration with temperature‐dependent variant of p53 affirmed its essential regulation of cell growth and proliferation. A, Bright field phase contrast images showing morphology of untransfected SKOV‐3 COE cells (control) and transfected with control vector or p53V138 at 32 °C or 37 °C. B, Quantitation of cell proliferation by MTT assay of SKOV‐3 COE cells transfected with the temperature‐dependent p53 variant cultured at 32 °C or 37 °C. C, Images showing crystal violet‐stained colonies of the transfected cells grown at 32 °C or 37 °C. D, Quantitation of the colony number from three independent experiments of the transfected cells grown at 32 °C and 37 °C. E, Immunostaining showing HP1γ nuclear foci (top panels; merged images, purple, indicated by arrows) and senescence associated β‐galactosidase staining (lower panels; blue) in Saos‐2 COE cells transfected with p53V138 grown at 32 °C or 37 °C. F, Quantitation of β‐galactosidase staining in cells cultured at 32 °C or 37 °C. G, Ki‐67 immunostaining in untransfected Saos‐2 COE cells (control) or those transfected with control vector or p53V138, grown at 32 °C and 37 °C.
Figure 6
Figure 6
CARF level is enriched in human epithelial and glial tumors. A, Immunohistochemical staining showing the expression of CARF in normal and tumor sections of kidney, lung and liver tissues. On the right is ImageJ‐based quantitation of the percentage of CARF‐stained area in the respective tissues, derived from three independent sets. B, Box plot representing cumulative expression of CARF as assessed by immunohistochemical staining in all the three sets. C, Immunohistochemical staining showing expression of CARF in normal and grade‐I, ‐II, and ‐III astrocytoma sections. On the right side is ImageJ‐based quantitation of the percentage of stained area as determined in three independent sets. D, Immunohistochemical staining showing expression of CARF in tissue microarray sections of skin and lung tumors in comparison to the matched normal tissues. E, Immunohistochemical staining of tissue microarray sections showing a gradual increase in the expression of CARF in successive grades in comparison to their normal or early grade tumors in breast and bone cancer samples.
Figure 7
Figure 7
CARF overexpression promoted cell migration and invasive characteristics in p53‐compromised cancer cells. A, Scratch assay showing wound healing at 0 h, 18 h and 36 h time points in control and COE derivatives of SKOV‐3, MCF7 and Saos‐2 cells. Quantitation of percent filled scratch area from three independent experiments is shown below. B, Images of Matrigel invasion assay showing number of invasive cells in control and CARF‐transfected Saos‐2, SKOV‐3 and MCF7 cells. Quantitation of the number of invaded cells is shown below. C, Immunoblotting for GFP, MMP2, MMP3, MMP9 and uPA. β‐actin was used as a loading control. Quantitation of their expression levels in control and COE SKOV‐3 cells after normalization to β‐actin is shower on the right. D, Bar diagram showing secreted levels of cytokines and growth factors in SKOV‐3 control, COE, and COE reconstituted with wild type p53 (p53V138), normalized with SKOV‐3 cells. The data are shown as fold change over control, denoted as 1.

References

    1. Ahmed, A.A. , Etemadmoghadam, D. , Temple, J. , Lynch, A.G. , Riad, M. , Sharma, R. , Stewart, C. , Fereday, S. , Caldas, C. , Defazio, A. , Bowtell, D. , Brenton, J.D. , 2010. Driver mutations in TP53 are ubiquitous in high grade serous carcinoma of the ovary. J. Pathol. 221, 49–56. - PMC - PubMed
    1. Alla, V. , Engelmann, D. , Niemetz, A. , Pahnke, J. , Schmidt, A. , Kunz, M. , Emmrich, S. , Steder, M. , Koczan, D. , Putzer, B.M. , 2010. E2F1 in melanoma progression and metastasis. J. Natl. Cancer Inst. 102, 127–133. - PubMed
    1. Bartek, J. , Bartkova, J. , Lukas, J. , 2007. DNA damage signalling guards against activated oncogenes and tumour progression. Oncogene. 26, 7773–7779. - PubMed
    1. Bell, D. , Berchuck, A. , Birrer, M. , Chien, J. , Cramer, D. , Dao, F. , Dhir, R. , 2011. Integrated genomic analyses of ovarian carcinoma. Nature. 474, 609–615. - PMC - PubMed
    1. Bieging, K.T. , Mello, S.S. , Attardi, L.D. , 2014. Unravelling mechanisms of p53-mediated tumour suppression. Nat. Rev. Cancer. 14, 359–370. - PMC - PubMed

Publication types

Substances