. 2015 Aug 27;162(5):1127-39.
doi: 10.1016/j.cell.2015.07.021. Epub 2015 Aug 13.

Macrophage-Induced Blood Vessels Guide Schwann Cell-Mediated Regeneration of Peripheral Nerves

Affiliations

Macrophage-Induced Blood Vessels Guide Schwann Cell-Mediated Regeneration of Peripheral Nerves

Anne-Laure Cattin et al. Cell. .

Abstract

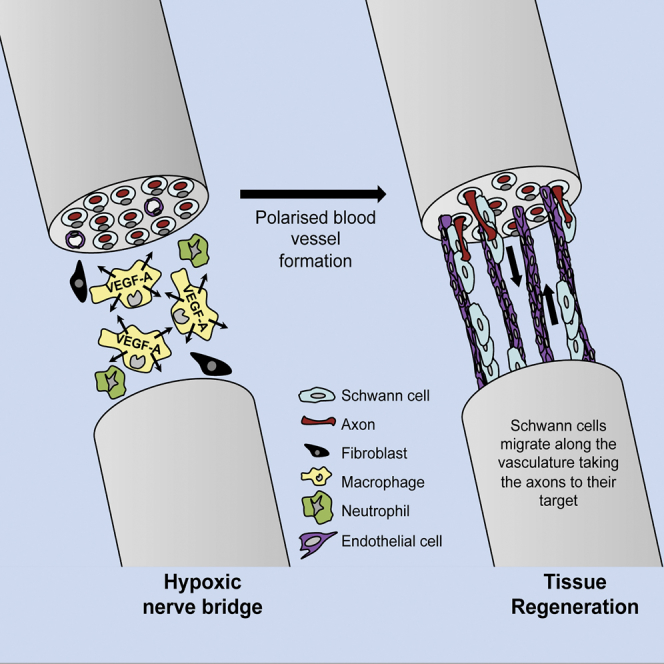
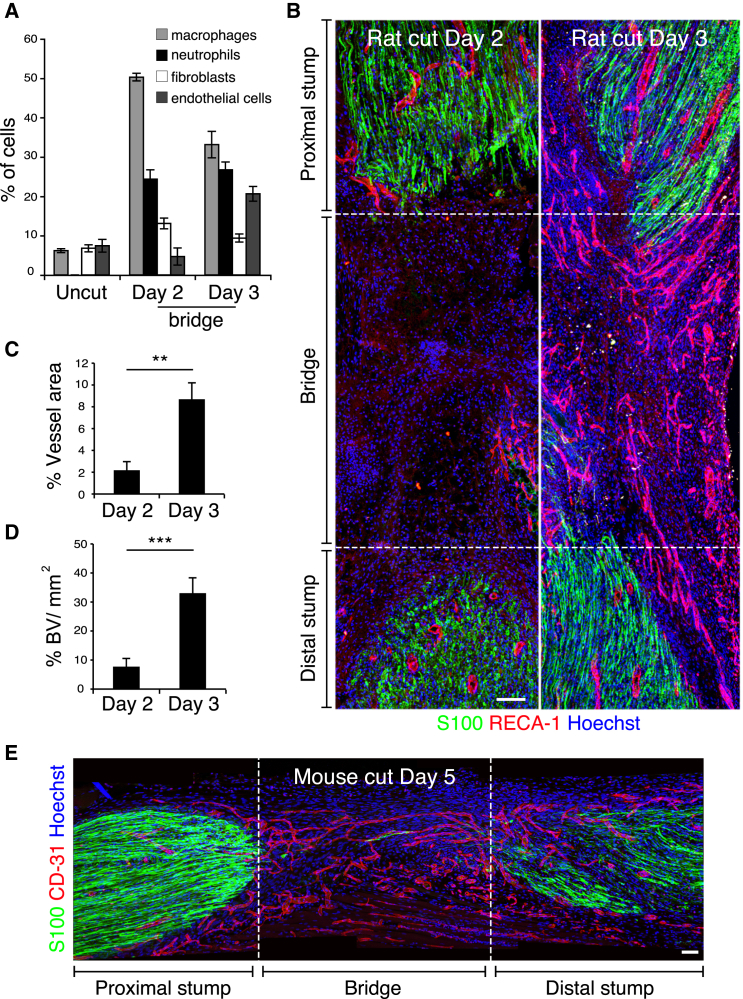
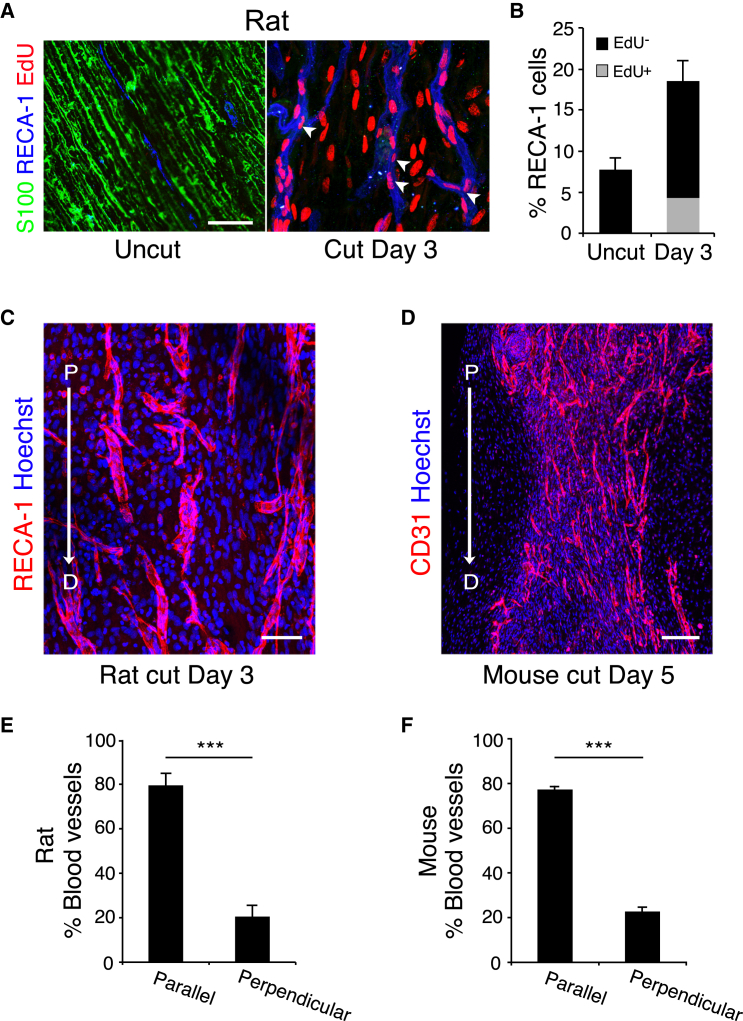
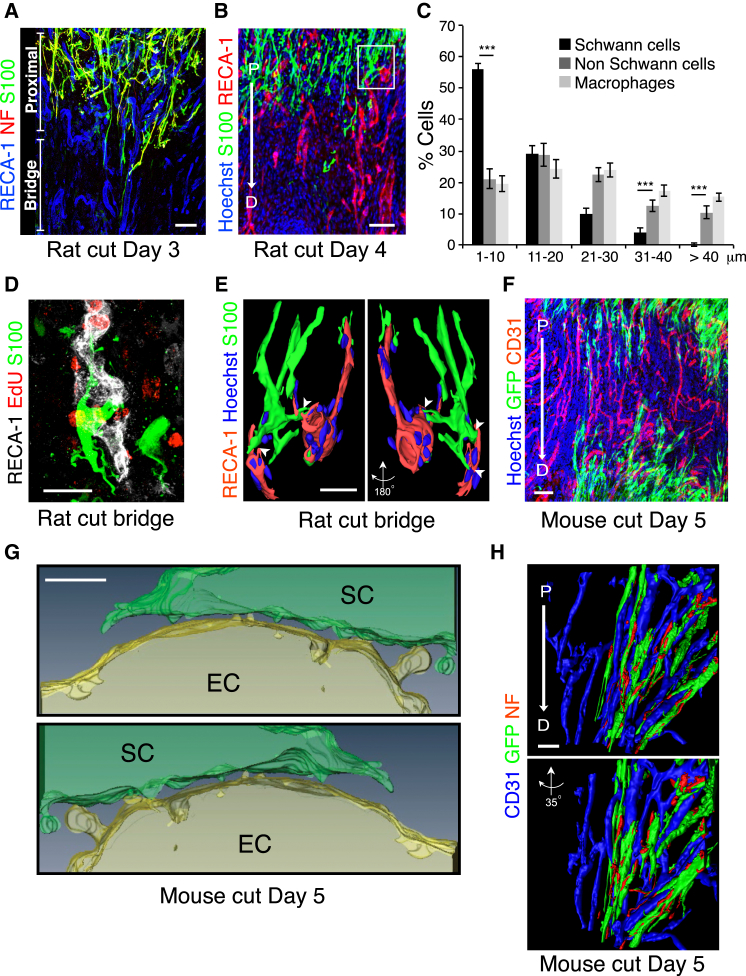
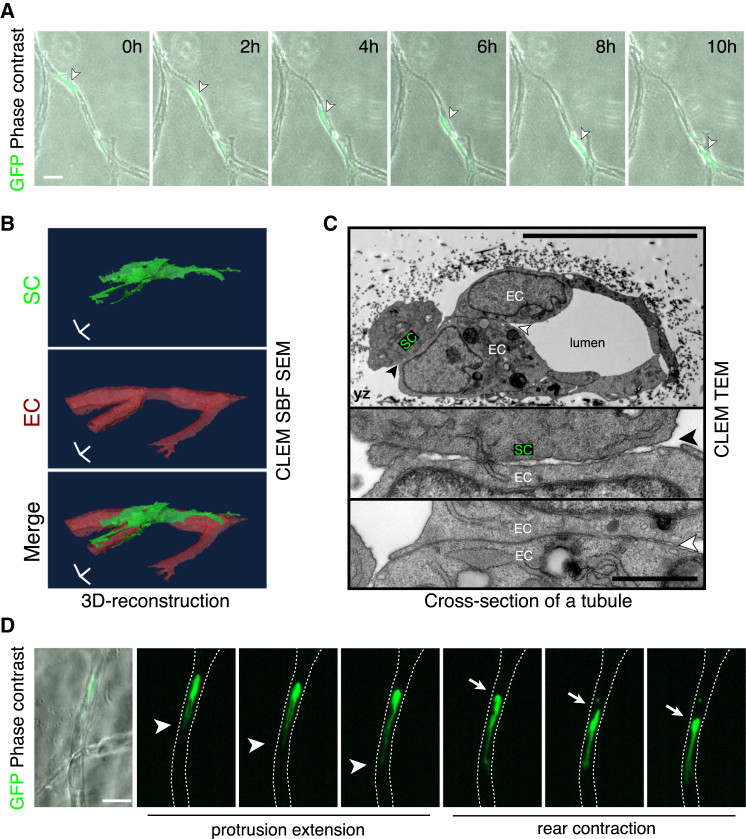
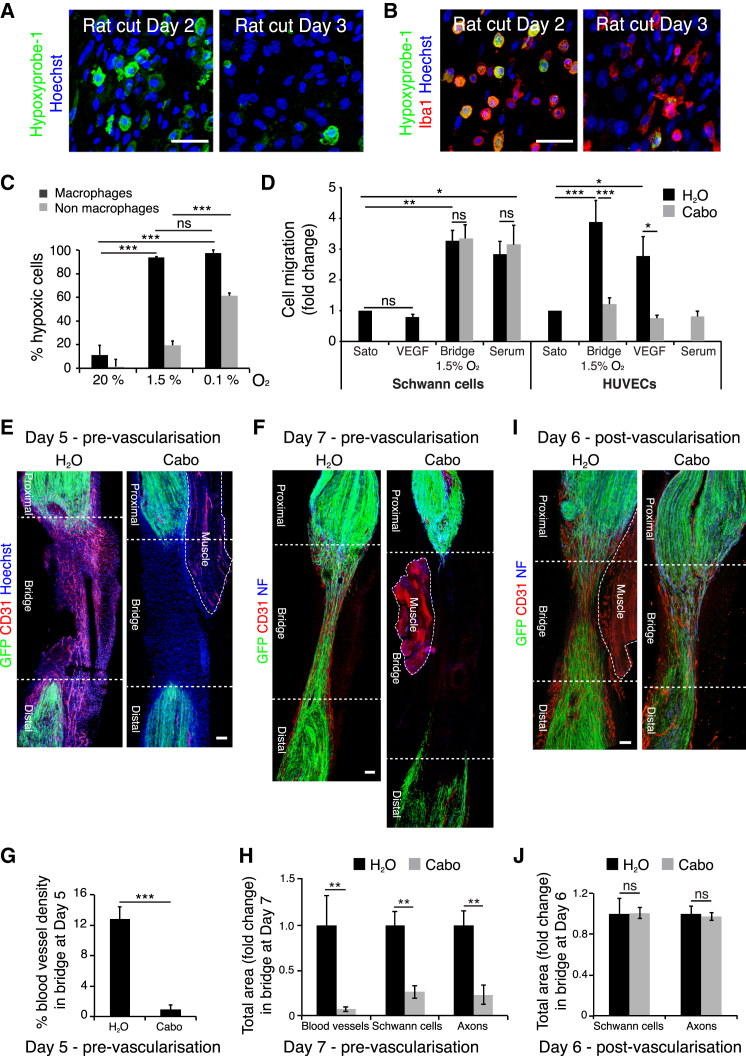
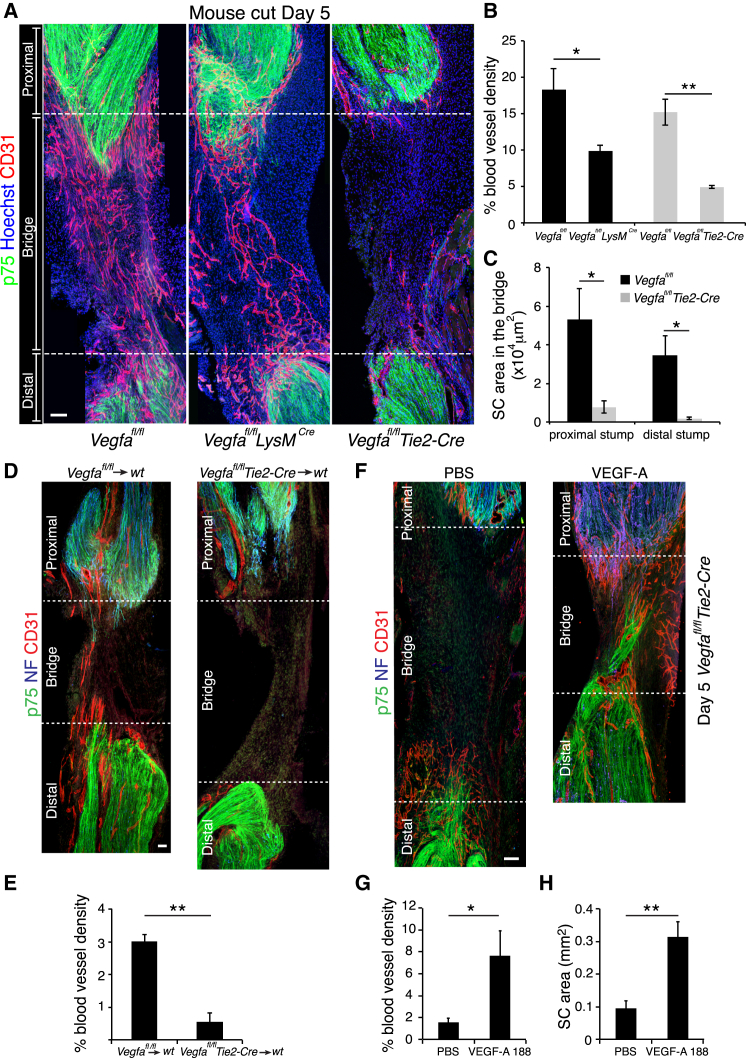
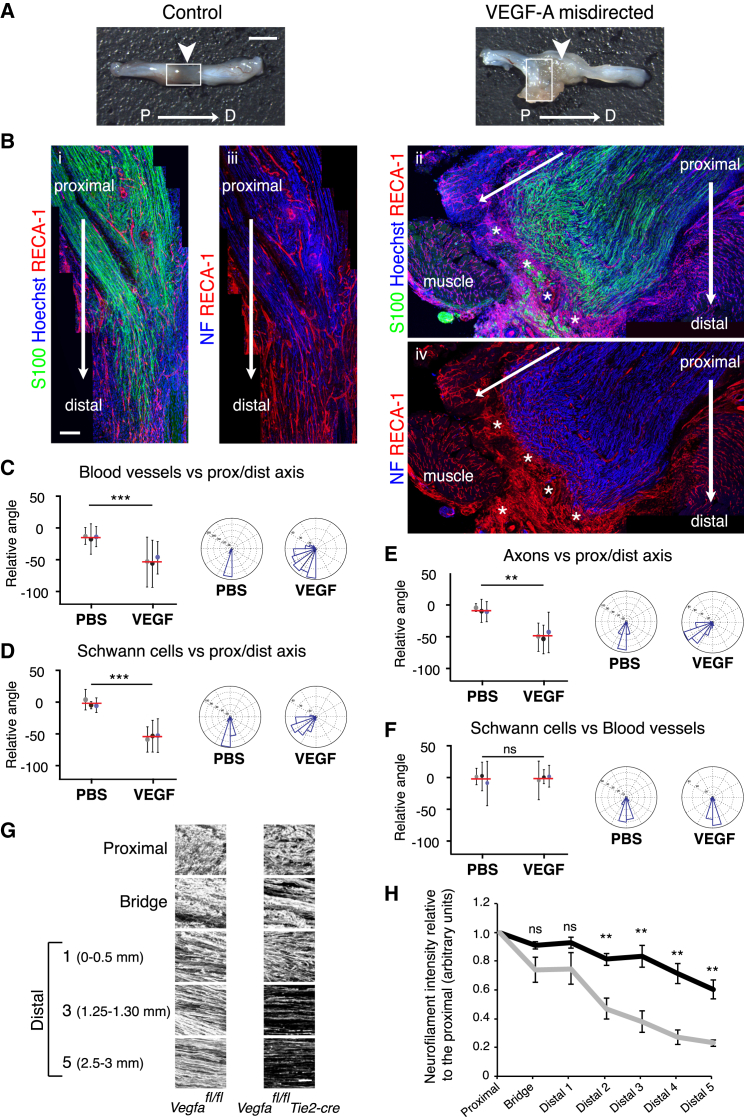
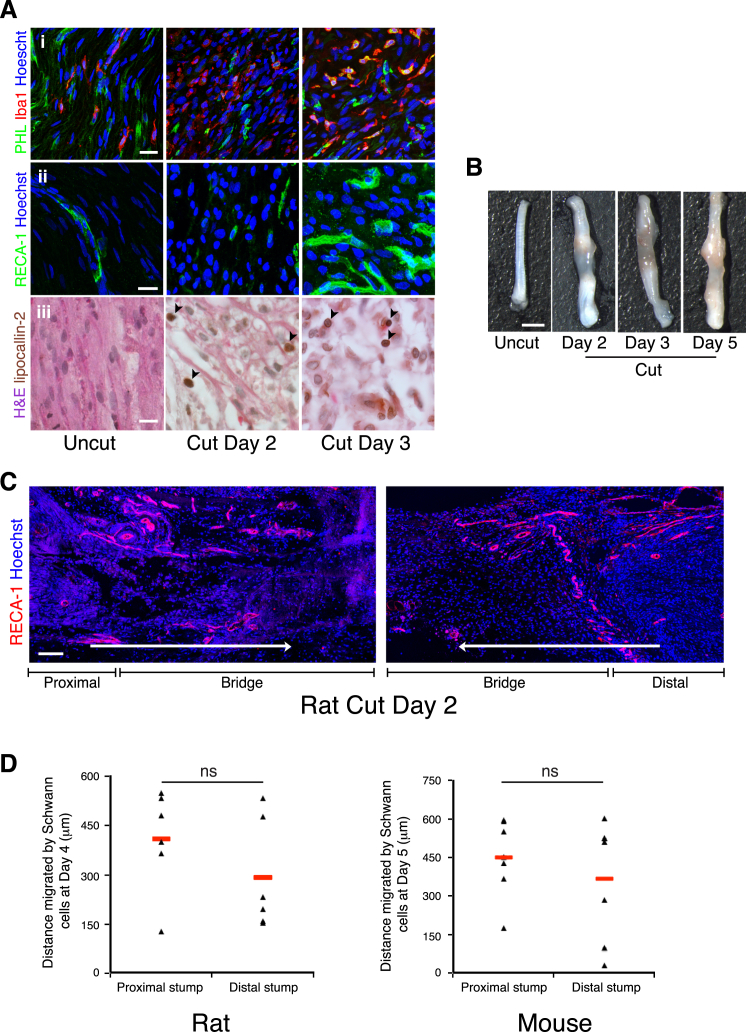
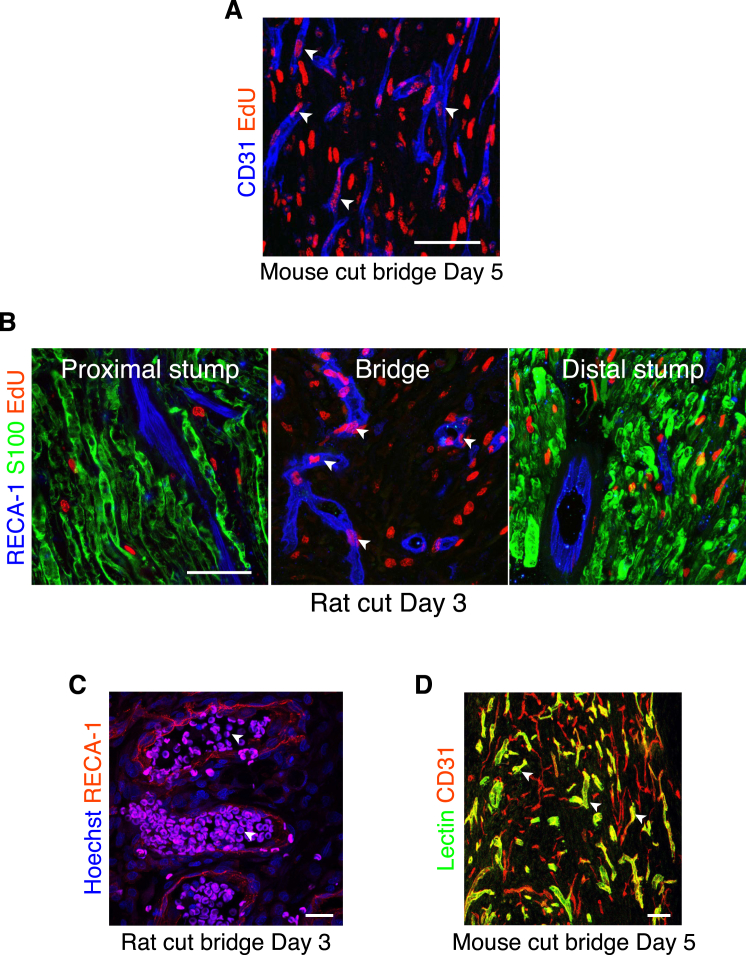
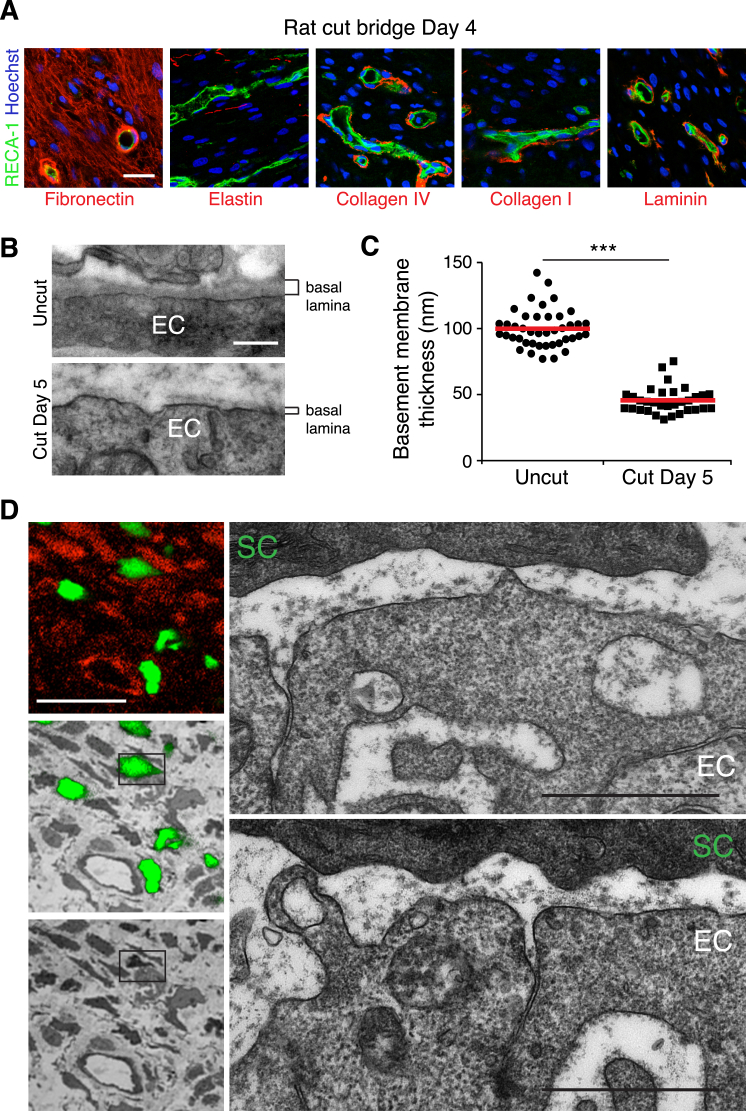
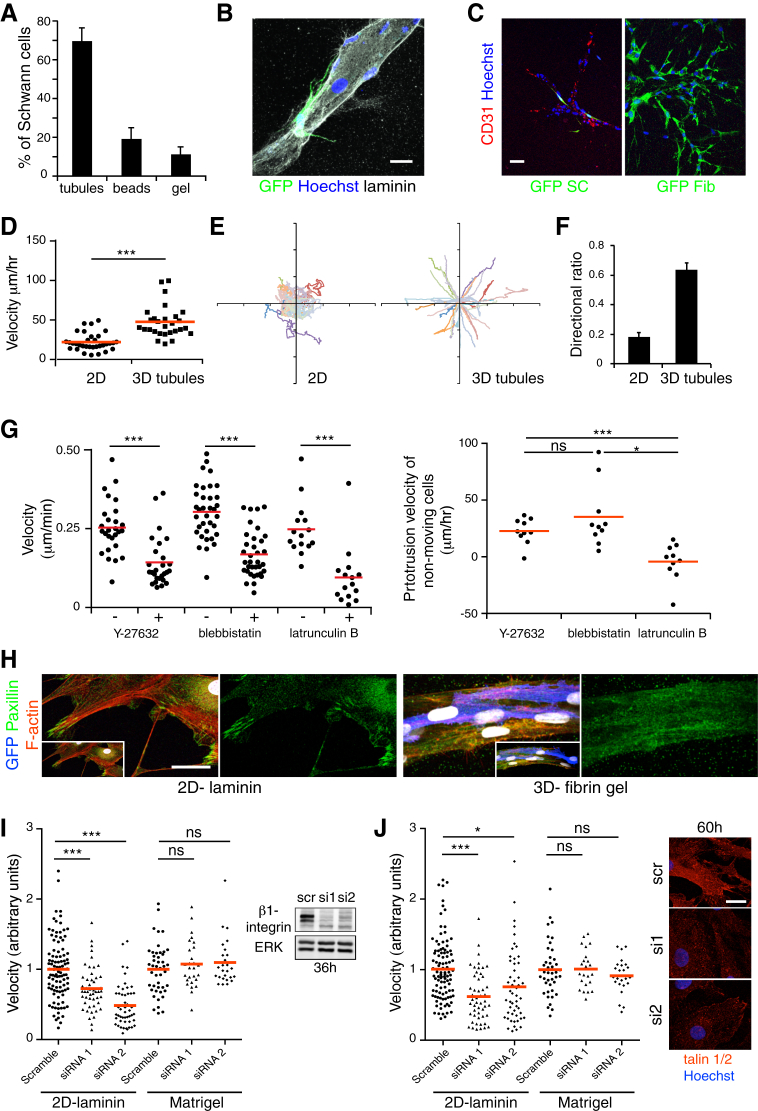
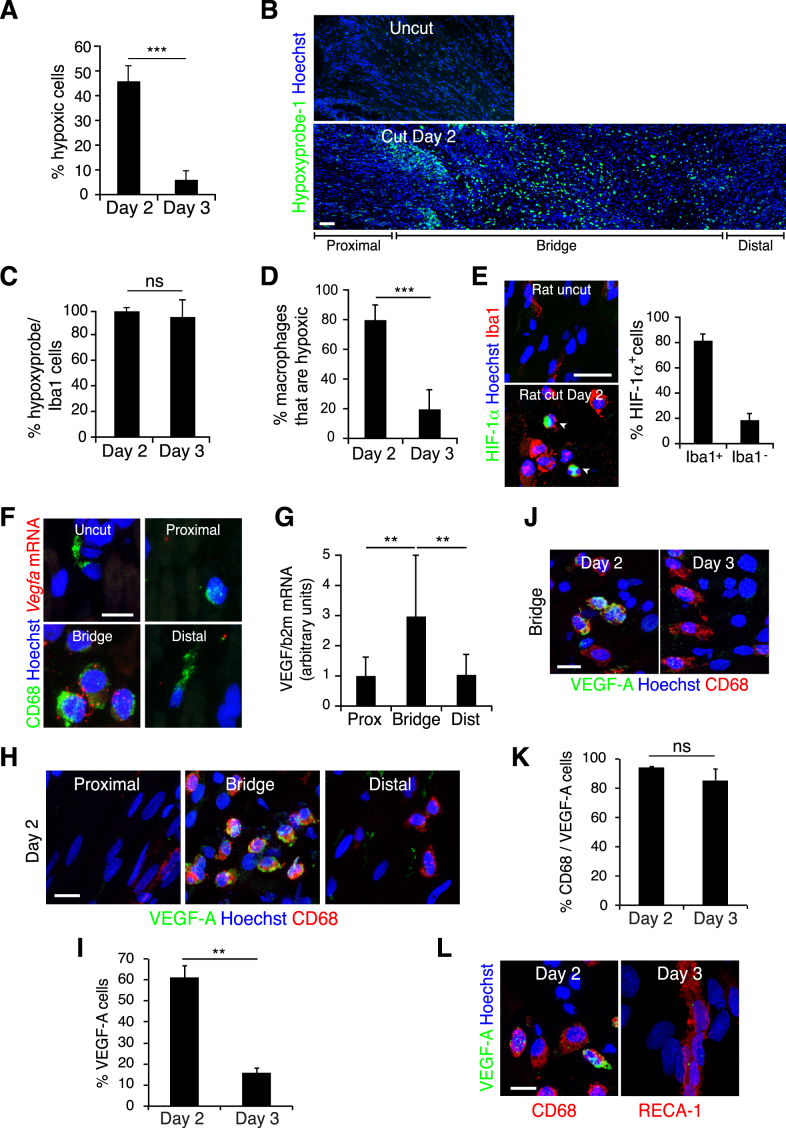
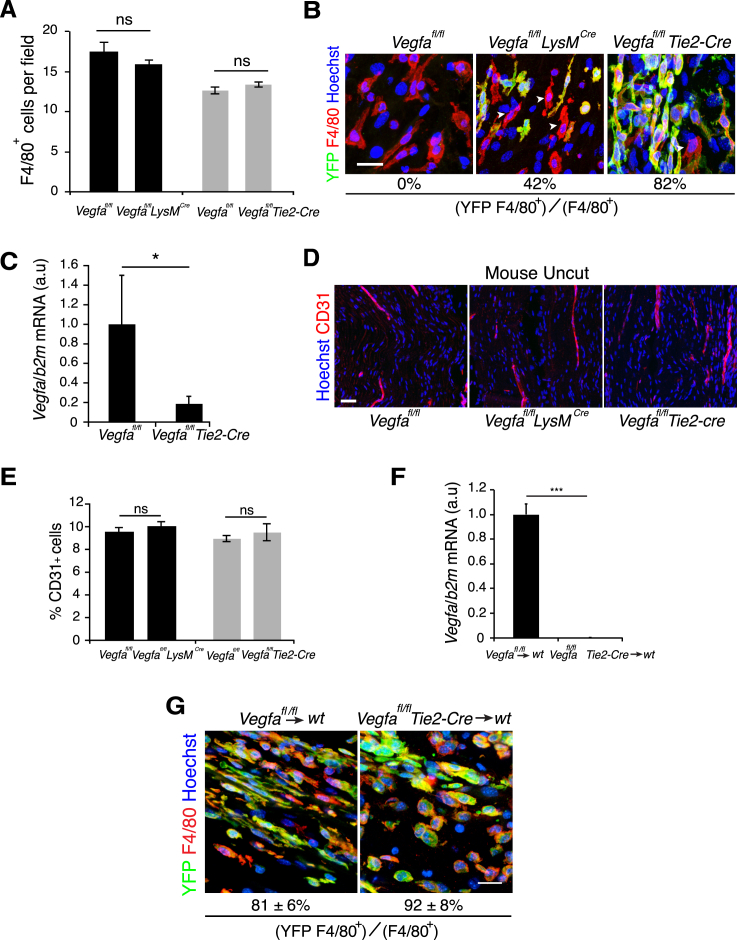
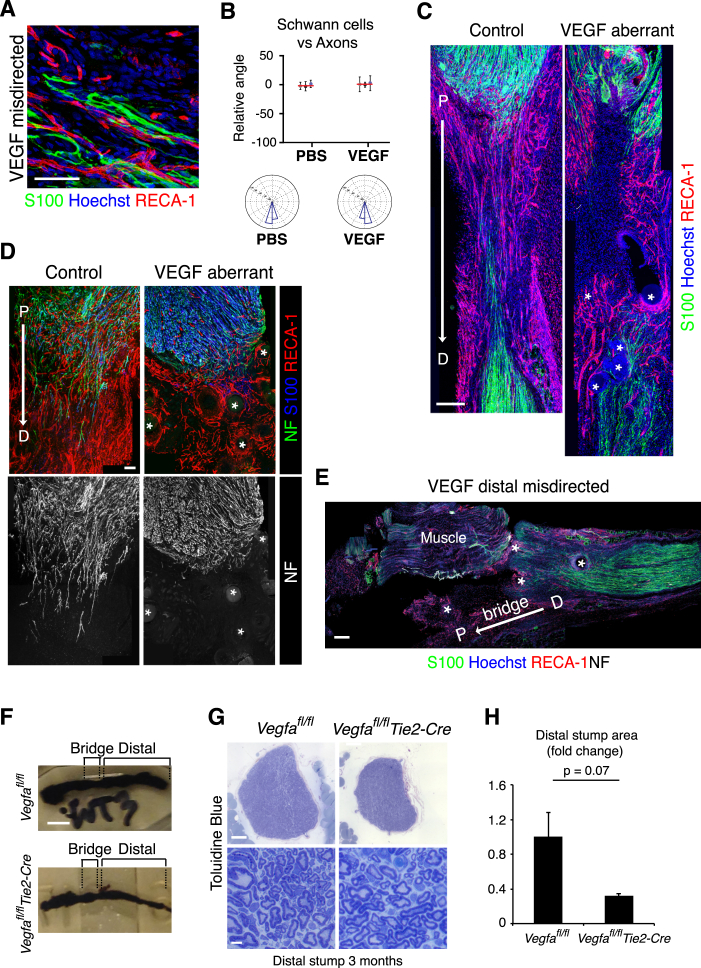
The peripheral nervous system has remarkable regenerative capacities in that it can repair a fully cut nerve. This requires Schwann cells to migrate collectively to guide regrowing axons across a 'bridge' of new tissue, which forms to reconnect a severed nerve. Here we show that blood vessels direct the migrating cords of Schwann cells. This multicellular process is initiated by hypoxia, selectively sensed by macrophages within the bridge, which via VEGF-A secretion induce a polarized vasculature that relieves the hypoxia. Schwann cells then use the blood vessels as "tracks" to cross the bridge taking regrowing axons with them. Importantly, disrupting the organization of the newly formed blood vessels in vivo, either by inhibiting the angiogenic signal or by re-orienting them, compromises Schwann cell directionality resulting in defective nerve repair. This study provides important insights into how the choreography of multiple cell-types is required for the regeneration of an adult tissue.


Figures

None
Graphical abstract
Figure 1
Figure 1
Blood Vessels Permeate the Bridge prior to SC Migration (A) Graph shows the proportion of macrophages (Iba1+), fibroblasts (prolylhydroxylase+/ Iba1), ECs (RECA-1+), and neutrophils (lipocallin-2+) within the bridge of transected rat sciatic nerves and in contralateral intact nerves (Uncut), Day 2, and Day 3 after transection (n = 4, graph shows mean value ± SEM). (B) Rat sciatic nerve longitudinal sections immunostained for ECs (RECA-1+, red) and SCs (S100+, green), Day 2 and Day 3 after transection. Nuclei were counterstained with Hoechst (blue). Scale bar, 100 μm. (C and D) Quantification of the vascularization of the bridge as shown in (B). (C) Graph shows the percentage of RECA-1 positive area at the indicated times (n = 6). (D) Graph shows the average number of blood vessels/mm2 of bridge at the indicated times (n = 6). Graphs show mean value ± SEM. (E) Longitudinal section of a mouse sciatic nerve immunostained for ECs (CD31+, red) and SCs (S100+, green), Day 5 after transection. Scale bar, 100 μm. For reconstruction of longitudinal sections shown in (B) and (E), multiple images from the same sample were acquired using the same microscope settings. See also Figure S1.
Figure 2
Figure 2
Newly Formed Blood Vessels in the Bridge Are Polarized in the Direction of SC Migration (A) Representative longitudinal sections of a rat sciatic nerve bridge and the contralateral uninjured nerve, day 3 after transection, and 12 hr after EdU injection. EdU+ cells (red) were co-labeled to detect ECs (blue) and S100 to detect SCs (green). Scale bar, 25 μm. White arrowheads indicate EdU+ ECs. (B) Quantification of the proportion of EdU+ ECs in the bridge, day 3 after transection compared to uncut (n = 4). (C) Representative confocal image of a longitudinal section of a rat nerve bridge immunostained for ECs (RECA-1+) at day 3 after transection. Scale bar, 50 μm. Arrow indicates the direction of axonal growth from the proximal (P) to the distal (D) stump. (D) Representative confocal image of a longitudinal section of a mouse nerve bridge immunostained for ECs (CD31+) at Day 5 after transection. Scale bar, 100 μm. For reconstruction of longitudinal sections shown in (C) and (D), multiple images from the same sample were acquired using the same microscope settings. (E and F) Quantification of the proportion of blood vessels parallel or perpendicular to the direction of SC migration in the rat bridge (E) or the mouse bridge (F) (n = 4). Graphs show mean value ± SEM. See also Figure S2.
Figure 3
Figure 3
Migrating SCs Interact with the Vasculature of the Bridge (A) Representative confocal image of a longitudinal section of a rat sciatic nerve bridge, Day 3 after transection, immunostained to detect axons (neurofilament (NF), red), SCs (S100+, green), and ECs (RECA-1+, blue) and shows cords of SCs and associated regrowing axons interacting with the vasculature as they emerge from the proximal stump and enter the bridge. Scale bar, 50 μm. (B) Rat sciatic nerve longitudinal sections immunostained to detect SCs (S100+, green) and ECs (RECA-1+, red), Day 4 after transection. Scale bar, 100 μm. White rectangle indicates the region used to build the 3D model shown in (E). For reconstruction of longitudinal sections shown in (A) and (B), multiple images from the same sample were acquired using the same microscope settings. (C) Frequency distribution graph showing the distance of the nuclei of SCs (S100+), non SCs (S100-/RECA-), or macrophages (Iba1+) to the closest blood vessel, Day 4 after transection (n = 4, graph shows mean value ± SEM). (D) 3D-projection of a rat nerve bridge showing a S100-positive SC (green) interacting with a newly formed EdU-positive (red) blood vessel (RECA-1+, white). Scale bar, 20 μm. See also Movie S1. (E) Snapshots of a 3D-image obtained by the surface rendering of a z-stack projection of confocal images of the rat nerve bridge, immunostained to detect SCs (S100+, green) and ECs (RECA-1+, red). A SC can be seen to interact with two different blood vessels through cytoplasmic protrusions. Scale bar, 20 μm. Arrowheads indicate points of contact between a SC and blood vessels. (F) Representative confocal image of a longitudinal section of a sciatic nerve bridge from PLP-EGFP mice, Day 5 after transection, immunostained to detect ECs (CD31+, red). Scale bar, 50 μm. (G) Snapshots from Movie S2 showing blebs and protrusions mediating the contacts between SCs and ECs within the bridge. (H) Snapshots from Movie S1 of a 3D model obtained by surface rendering of a z stack projection of a longitudinal section of a bridge region from the sciatic nerve of PLP-EGFP mice, Day 5 after transection. The sections were immunostained to detect ECs (CD-31+, blue) and axons (NF+, red). Scale bar, 20 μm. See also Figure S3.
Figure 4
Figure 4
SCs Migrate along Endothelial Tubules In Vitro (A) Representative time-lapse microscopy images showing a GFP-positive rat SC migrating along a tubule of HUVECs within a 3D fibrin gel (Movie S3). Scale bar, 40 μm. White arrowheads indicate the cell body of the SC. (B) Images from Movie S4 of a tilted 3D view of a GFP-positive SC (green) interacting with an EC tubule (red). Scale bar, 10 μm. (C) Top: a representative EM image of a cross-section of an EC tubule in contact with a GFP-positive SC within a fibrin gel. Scale bar, 10 μm. Middle: a higher magnification view of the SC/EC contact (black arrowhead). Bottom: a higher magnification view of the EC/EC contact (white arrowhead). Scale bar, 1 μm. (D) Snapshots of Movie S5, showing the amoeboid-like mode of migration observed by the SCs in 3D. White arrowheads and arrows show the leading protrusion and the rear of the cell respectively. Scale bar, 50 μm. See also Figure S4.
Figure 5
Figure 5
Hypoxia Drives Angiogenesis by a Macrophage-Generated Gradient of VEGF-A (A) Representative images of sections of a rat sciatic nerve bridge, Day 2 and 3 after transection and 30 min after injection of hypoxyprobe-1, immunolabeled to detect hypoxyprobe-1 (green). Scale bar, 25 μm. (B) As in (A) but immunolabeled to detect macrophages (Iba1+, red) and hypoxic cells (hypoxyprobe-1+, green). Scale bar, 25 μm. (C) Graph showing percentage of hypoxic cells (hypoxyprobe-1+) in macrophage (Iba1+) and non-macrophage (Iba1) populations from rat sciatic nerve bridges cultured at indicated oxygen conditions (n = 3). (D) HUVECs or SCs were placed in the upper compartment of Boyden chambers and allowed to migrate into the lower chamber containing media with no factors (SATO), VEGF-A165, serum, or conditioned medium from bridge cells cultured at 1.5% O2 (n = 5). For (C) and (D) one-way ANOVA test was used for statistical analysis. (E–H) Confocal images of longitudinal cryosections of injured sciatic nerves from PLP-EGFP mice, Day 5 or Day 7 after transection, following gavage of cabozantinib or control solvent on Day 4 (pre-vascularization), immunostained to detect ECs (CD31+, red) and axons (NF+, blue) Scale bar, 50 μm, quantified in (G) and (H) (n = 3). (I) As for (F) but cabozantinib was administered on Day 5 (post-vascularization) and harvested on Day 6, quantified in (J) (n = 3). For reconstruction of longitudinal sections shown in (E), (F), and (I), multiple images from the same sample were acquired using the same microscope settings. Graphs show mean value ± SEM. See also Figure S5.
Figure 6
Figure 6
Inactivation of Vegfa in Macrophages Inhibits Vascularization of the Nerve Bridge after Nerve Transection (A) Representative images of longitudinal sections of injured sciatic nerves from Vegfafl/fl (control), Vegfafl/flLysmCre, and Vegfafl/flTie2-Cre mice, Day 5 after transection, immunostained to detect ECs (CD31+, red) and SCs (p75NTR+, green). Scale bar, 50 μm. (B) Quantification of (A) showing the proportion of CD31-positive area per bridge area and shows that the vascularization of the bridge is significantly reduced in mutants animals (n = 5). (C) Quantification of (A) showing the area of SC influx from the proximal and distal stumps in Vegfafl/fl versus Vegfafl/flTie2-Cre animals (n = 5). (D) Representative images of longitudinal sections of injured sciatic nerves from wild-type that have received bone marrow from Vegfafl/fl (control) or Vegfafl/flTie2-Cre mice immunostained to detect ECs (CD31+, red), SCs (p75NTR+, green), and axons (NF+, blue), Day 5 after transection. Scale bar, 100 μm. (E) Quantification of (D) showing the proportion of CD31-positive area per bridge area (n = 3 for each group). (F) Representative images of longitudinal sections of injured sciatic nerves of Vegfafl/flTie2-Cre mice, Day 5 after transection following injection of PBS or VEGF-A188 into the bridges at Day 4. Scale bar, 100 μm. (G and H) Quantification of (F) showing the blood vessel density (G) or area of infiltrating SCs (H) (n = 4). For reconstruction of longitudinal sections shown in (A), (D) and (F), multiple images from the same sample were acquired using the same microscope settings. Graphs show mean value ± SEM. See also Figure S6.
Figure 7
Figure 7
Redirection of the Blood Vessels Leads to the Misdirection of Migrating SCs (A) PBS- (control) and VEGF-treated rat sciatic nerve images show that placement of VEGF beads to the side of the injury site, leads to aberrant regeneration. Scale bar, 2 mm. Arrows indicate the bridge region and proximal to distal. (B) Immunofluorescence images of the regions demarcated by white boxes in (A) of a PBS- (control) and VEGF-treated animal, Day 6 following injury, longitudinal sections were immunostained to detect SCs (S100+, green) and ECs (RECA1+, red). i and ii: show that misdirected blood vessels in the VEGF-treated animals directed the SC cords toward the adjacent muscle. iii and iv: show the axons (NF+) following the SC cords, toward the muscle. Scale bar, 300 μm. White asterisks indicate the beads. For reconstruction of longitudinal sections, multiple images from the same sample were acquired using the same microscope settings. (C–F) Quantification of (B) to show the direction of blood vessels (C), SCs (D), and axons (E) relative to the proximal/distal axis and the alignment of blood vessels and SCs (F) in the rats treated with PBS or VEGF (n = 3). Graphs show the mean relative angle ± SD for each animal with the mean between animals shown by red lines. Rose plots show the distribution of cells for all animals. (G) Representative confocal images of axons (NF+) in indicated regions of regenerated nerves in Vegfafl/fl (control) or Vegfafl/flTie2-Cre mice, Day 14 after transection. (H) Quantification of (G) showing axonal growth in Vegfafl/fl (black line) and Vegfafl/fl Tie2-cre (gray line) mice (n = 5, graph shows mean value ± SEM). See also Figure S7.
Figure S1
Figure S1
The Major Cellular Components of the Bridge Are Macrophages, Neutrophils, Fibroblasts, and Endothelial Cells, Related to Figure 1 (A) Representative images of longitudinal sections of rat uninjured and injured sciatic nerve bridges at Day 2 and 3. Sections were immunostained for (i) macrophages (Iba1+, red) and fibroblasts (prolylhydroxylase (PHL)+/ Iba1-, green). Scale bar = 25 μm. (ii) endothelial cells (RECA-1+, green). Scale bar = 10 μm. Nuclei were counterstained with Hoechst (blue). (iii) neutrophils - immunohistochemistry to detect lipocallin-2 (brown). Nuclei and cytoplasm were counterstained with Hematoxylin (violet) and Eosin (pink) respectively. Scale bar = 10 μm. Black arrowheads indicate lipocallin-2+ neutrophils. Quantification of the proportion of each cell-type within the bridge is shown in Figure 1A. (B) Representative images of uninjured and injured rat sciatic nerves at Day 2, Day 3 and Day 5. Blood vessels can be observed within the bridge at Day 3 but not at Day 2. (C) Representative immunofluorescence images of longitudinal sections of injured rat sciatic nerve bridges at Day 2 following transection, immunostained to detect blood vessels (RECA-1+, red) with nuclei stained with Hoechst. The images show the blood vessels entering the bridge from both the proximal stump (P) (left panel) and the distal stump (D) (right panel). Scale bar = 100 μm. Arrows indicates the direction of cell movement from the proximal or the distal stump into the bridge. For reconstruction of longitudinal sections, multiple images from the same sample were acquired using the same microscope settings. (D) Schwann cells migrate from both the proximal and distal stumps. Graphs show the distance migrated by Schwann cells from the proximal and distal stumps in rats (LHS) and mice (RHS). Each point represents an individual nerve; red lines indicate the mean.
Figure S2
Figure S2
The Newly Formed Blood Vessels in the Bridge Are Functional, Related to Figure 2 (A) Representative image of a longitudinal section of a mouse sciatic nerve bridge, Day 5 after transection and 12 hr after EdU injection, immunostained to detect EdU (red), endothelial cells (CD31+, blue) to identify the presence of newly-formed blood vessels. Scale bar = 50 μm. White arrowheads indicate EdU+ endothelial cells. (B) Representative longitudinal cryosections of the nerve stumps and the bridge of rat sciatic nerves, 12 hr after EdU injection and Day 3 after transection, immunostained for endothelial cells (RECA-1+, blue), Schwann cells (S100+, green) and EdU (red). Scale bar = 50 μm. White arrowheads indicate EdU+ endothelial cells. (C) Representative immunofluorescence image of the bridge of injured rat sciatic nerves at Day 3 showing blood vessels immunostained for RECA-1 and autofluorescent erythrocytes, present in the vast majority of blood vessels. Scale bar = 25 μm. White arrowheads indicate erythrocytes within the lumen of the bridge vasculature. (D) Representative longitudinal section of the bridge of an injured mouse sciatic nerve at Day 5 and 10 min after lectin-FITC injection and co-labeled to detect endothelial cells (CD31+, red). Scale bar = 50 μm. White arrowheads indicate functional blood vessels.
Figure S3
Figure S3
Blood Vessels in the Bridge Have Thin Basal Lamina, Allowing Direct Points of Contact with Schwann Cells, Related to Figure 3 (A) Representative confocal images of the bridges of rat sciatic nerves, Day 4 after transection, immunostained to detect the indicated matrix proteins (red) and endothelial cells (green). Scale bar = 25 μm. (B) Representative TEM images of blood vessels from the bridge region and the contralateral nerve, Day 5 after transection. Note the basal lamina is thinner, less dense and/or absent around blood vessels within the bridge. Scale bar = 250nm. (C) Quantification of the average thickness of the basal lamina of the blood vessels as described in (B), each point represents a separate blood vessel from 3 independent animals. The red lines represent the mean. (D) Correlative light and electron microscopy of a 100μm thick vibrating microtome cross section of GFP-expressing Schwann cells (green) from a lectin (red) injected mouse sciatic nerve, Day 5 after transection. Panels on the left show a confocal image of GFP–expressing Schwann cells, either alone (top), overlayed on the correlated TEM image (middle) and TEM image alone (bottom). Outlined box highlights the GFP-expressing Schwann cell (SC) interacting with endothelial cells (EC), enlarged in the panels on the left, reconstructed in Figure 3G, and Movie S2. Note the points of direct contact between the Schwann cell and the blood vessel and sporadic/absent basal lamina of both cell types. Scale bars = 20 μm (white), 1 μm (black).
Figure S4
Figure S4
Primary Schwann Cells Migrate In Vitro along Tubules of Endothelial Cells, Related to Figure 4 (A) Quantification of the proportion of GFP-positive Schwann cells associated with the tubules of HUVECs, the beads or retained within the fibrin gel (n = 5 gels from separate experiments. 100 cells were counted per gel, graph shows mean value ± SEM). (B) Representative confocal image of a GFP-positive Schwann cell (green) physically interacting with a laminin+ (white) tubule of endothelial cells, while migrating. Nuclei were counterstained with Hoechst (blue). Scale bar = 20 μm. (C) Representative images of GFP-positive Schwann cells (left panel) or GFP-positive fibroblasts (right panel) co-cultured with endothelial tubules in fibrin gels. Scale bar = 50 μm. Schwann cells associate with the CD31+ endothelial cells whereas fibroblasts migrate within the matrix. (D) Velocities of tracked single Schwann cells (dots) migrating on 2D laminin-coated surfaces or along tubules of HUVECs within fibrin gels. The red lines represent the mean. (E) Single Schwann cell tracks migrating on 2D laminin-coated surfaces (left) or along tubules of HUVECs within fibrin gels (right). See also Movies S3 and S5. (F) Directionality ratio of Schwann cells migrating on 2D laminin-coated surfaces or along tubules of HUVECs within fibrin gels. 30 cells were quantified in each condition from 3 separate experiments; graph shows mean value ± SEM. (G) Left panel: Rear velocities of tracked single Schwann cells (dots) migrating along tubules of HUVECs upon inhibition with the inhibitors Y27632 (50 μM), blebbistatin (2 μM) or latrunculin B (0.2 μM). The red lines represent the mean. Right panel: Measurements of single Schwann cell protrusion velocities upon inhibition with the inhibitors Y-27632, blebbistatin or latrunculin B. 10 cells were quantified from 2 separate experiments. The red lines represent the mean. One-way ANOVA test was used for statistical analysis. See also Movie S6. Note the movement of the rear of the cells is blocked by all three inhibitors whereas protrusions continue to form in the presence of Y-27632 and blebbistatin but not in the presence of latrunculin B. (H) Representative confocal images of GFP-positive Schwann cells on a 2D-laminin surface or interacting with a tubule of HUVECs within a fibrin gel, immunostained for the focal adhesion complex marker paxillin (green) and labeled with phalloidin to visualize the cortical actin (red). Note that focal adhesion complexes are not detectable in Schwann cells migrating in 3D. Nuclei were counterstained with Hoechst (white). Scale bar = 25 μm. (I) Left panel: Velocities of tracked single siRNA-treated Schwann cells (dots) migrating on 2D laminin-coated surfaces or along tubules of HUVECs in Matrigel. The red lines represent the mean. See also Movie S7. Right panel: Western blot analysis of total protein lysates from siRNA-treated Schwann cells showing the efficiency of beta1 integrin knockdown with two independent oligos compared to scrambled control, at 36 hr. Total ERK levels were used as a loading control. (J) Left panel: Velocities of tracked single siRNA-treated Schwann cells (dots) migrating on 2D laminin-coated surfaces or along tubules of HUVECs in Matrigel. The red lines represent the mean. Right panel: Representative confocal images of talin 1 and 2 siRNA-treated Schwann cells immunostained for talin (red) showing the efficiency of talin 1 and 2 knockdown with two independent oligos at 60 hr. Scale bar = 50 μm.
Figure S5
Figure S5
Hypoxia within the Bridge Leads to HIF-1α Stabilization and Expression of the Pro-angiogenic Target Gene, Vegfa, Related to Figure 5 (A) Quantification of Figure 5A to show the proportion of hypoxyprobe-1+ cells within the rat bridge (n = 4 animals per group; graph shows mean value ± SEM). (B) Representative longitudinal sections of a rat sciatic nerve bridge and the contralateral uninjured nerve, Day 2 after transection and 30 min after injection of hypoxyprobe-1 (pimonidazole chloride), immunostained to detect hypoxyprobe-1 (green). Nuclei were counterstained with Hoechst (blue). Scale bar = 100 μm. To reconstruct the longitudinal section of the injured nerve (bottom), multiple images from the same sample were acquired using the same microscope settings. (C) Quantification of Figure 5B to show the proportion of hypoxic cells that are macrophages at Day 2 and Day 3 (n = 4 animals per group; graph shows mean value ± SEM). (D) Quantification of the proportion of macrophages (Iba1+) that are hypoxic (hypoxyprobe-1+), Day 2 and Day 3 after injury (n = 4 animals per group, graph shows mean value ± SEM). Note the significant decrease of hypoxic macrophages at Day 3 compared to Day 2. (E) Representative images of a bridge region of a rat sciatic nerve, Day 2 after transection and the contralateral nerve (uncut), immunolabelled to detect macrophages (Iba1+, red) and HIF-1α expression (green). Scale bar = 20 μm. White arrowheads indicate HIF-1α+/Iba-1+ cells. Graph shows quantification of the proportion of HIF-1α+ cells that are macrophages (Iba1+) within the bridge (n = 3 animals, graph shows mean value ± SEM). (F) Representative images of sections of rat sciatic nerve, Day 2 after transection and the contralateral uninjured rat sciatic nerve following in situ hybridization of rat Vegfa mRNA (red) and subsequent immunostaining for macrophages (CD68+, green). Scale bar = 10 μm. (G) Quantitative RT-PCR analysis of Vegfa mRNA isolated from the bridge, the proximal and the distal stump of transected sciatic nerves, Day 2 after injury. Graph shows the Vegfa transcript levels relative to the levels in the proximal stump (n = 8 animals, graph shows mean value ± SEM). (H–K) Representative images of cryosections of rat sciatic nerve, after transection, immunolabelled to detect VEGF-A (green) and macrophages (CD68+, red) to show proximal, bridge and distal regions at Day 2 (H) and the bridge region at Day 2 and Day 3 (J). The proportion of VEGFA+ cells (I) and VEGFA+ macrophages (CD68+) (K) are quantified at Day 2 and Day 3 in the bridge region (n = 3, graphs show mean value ± SEM). (L) Representative images of a bridge region of a rat sciatic nerve, Day 2 or Day 3 after transection, immunostained to detect VEGF-A (green) and macrophages (CD68+, red) or blood vessels (RECA-1+, red) as indicated. Note that VEGF-A is undetectable in the blood vessels. Scale bars = 15 μm.
Figure S6
Figure S6
Inactivation of VEGF in Macrophages Inhibits Vascularization of the Bridge, Related to Figure 6 (A) Quantification of immunostained macrophages (F4/80+) within the bridge regions of Vegfafl/flLysmCre mice, Vegfafl/flTie2-Cre mice and their control littermates Vegfafl/fl, Day 5 after transection shows a similar recruitment of macrophages within control and mutant nerve bridges (n = 4 animals per group, graph shows mean value ± SEM). (B) Representative images of bridges regions from Vegfafl/fl (control), Vegfafl/flLysmCre and Vegfafl/flTie2-Cre mouse sciatic nerves immunostained to detect macrophages (F4/80+, red) and YFP (green), Day 5 after injury, to show the efficiency of recombination in macrophages. Scale bar = 20 μm. White arrowheads indicate examples of YFP-negative macrophages. (C) Quantitative RT-PCR analysis of Vegfa mRNA levels in the bridge of Vegfafl/flTie2-Cre mice relative to Vegfafl/fl controls, Day 5 after injury (n = 4 for each group, graph shows the mean ± SEM). (D) Representative images of longitudinal sections of uninjured sciatic nerves from Vegfafl/fl (control), Vegfafl/flLysmCre and Vegfafl/flTie2-Cre mice, immunostained to detect endothelial cells (CD31+, red). Scale bar = 40 μm. (E) Quantification of (D) showing the number of CD31+ endothelial cells in uninjured nerves of Vegfafl/flLysmCre and Vegfafl/flTie2-Cre animals as compared to their control littermates (n = 3 animals for each group, graph shows the mean ± SEM). (F) Quantification of the levels of Vegfa mRNA in the bone marrow of wild-type mice transplanted with bone-marrow from Vegfafl/fl (control) and Vegfafl/flTie2-Cre mice. Bone marrow was extracted following the harvesting of the nerves, Day 5 following transection (n = 3); graph shows the mean ± SEM. The loss of Vegfa expression confirms both the efficiency of the bone marrow transplant (for additional information see Supplemental Experimental Procedures) and the efficiency of the recombination of the Vegfa locus in the cells derived from the Vegfafl/flTie2-Cre mice. (G) Representative images of bridge regions from mouse sciatic nerves Day 5 following transection from wild-type mice transplanted with bone-marrow from Vegfafl/fl (control) and Vegfafl/flTie2-Cre mice immunostained to detect macrophages (F4/80+, red) and YFP (green), to determine the percentage of macrophages in the bridge derived from the transplanted cells. These results confirm the efficiency of the bone marrow transplant (for additional information see Supplemental Experimental Procedures) and demonstrate that the vast majority of macrophages in the bridge are derived from the transplanted stem cells. Scale bar = 20 μm.
Figure S7
Figure S7
Disorganization of Blood Vessels Leads to Disrupted Schwann Cell Migration and Axonal Regrowth, Related to Figure 7 (A) A higher magnification of Figure 7B to show the Schwann cell cords (S100+, green), aligned to the blood vessels (RECA-1+, red). Scale bar = 50 μm. (B) Quantification of Figure 7B to show the alignment between Schwann cells and regrowing axons. Graph shows the mean relative angle ± SD for each animal with the mean between animals shown by the red lines. Rose plots show the distribution of cells for all animals (n = 3 animals for each condition). (C) Images of bridge regions of a control (PBS) and VEGF-treated rat sciatic nerve, Day 6 after injury, immunostained to detect Schwann cells (S100+, green) and endothelial cells (RECA-1+, red). Nuclei were counterstained with Hoechst (blue). Scale bar = 300 μm. The beads are indicated by white asterisks in the VEGF-treated animals. Note the center of the bridge is poorly vascularised in the VEGF-treated mice and the Schwann cell cords fail to enter the bridge. (D) A further example of aberrant regeneration in a VEGF-treated sciatic nerve. Upper panels show images of a bridge region of control (PBS) and VEGF-treated rat sciatic nerves, Day 6 after injury, immunostained to detect Schwann cells (S100+, blue), endothelial cells (RECA-1+, red) and axons (NF+, green). Scale bar = 100 μm. Lower panels show the same images as in the upper panels, filtered to show only the axons (NF+, white). Note the axons in the VEGF-treated nerves are misdirected, toward the beads, into the adjoining muscle. (E) Image of a disconnected nerve following treatment with VEGF-treated beads in which the beads redirect Schwann cell cords from the distal stump. Note the blood vessels (RECA-1+, red) and Schwann cells (S100+, green) are directed away from the bridge into the surrounding muscle. Scale bar = 200 μm. For reconstruction of longitudinal sections shown in (C), (D) and (E), multiple images from the same sample were acquired using the same microscope settings. (F) Images of nerves stained with osmium tetroxide taken from Vegfafl/fl (control) and Vegfafl/flTie2-Cre mice, 6 months following transection. Note the visibly smaller distal stump in the mutant mice. Scale bar = 2mm. (G) Cross sections of a nerve from Vegfafl/fl (control) and Vegfafl/flTie2-Cre mice 6 months following transection and stained with toluidine blue, at low magnification to show the entire nerve (top panels) and at higher magnification to show the indistinguishable structures of the control and mutant nerves (lower panels). Scale bar = 100 μm (top) and 5 μm (bottom). (H) Graph to show the difference in area between the Vegfafl/fl (control) and Vegfafl/flTie2-Cre nerves as in (G), n = 3; graph shows the mean ± SEM.

References

    1. Avellino A.M., Hart D., Dailey A.T., MacKinnon M., Ellegala D., Kliot M. Differential macrophage responses in the peripheral and central nervous system during wallerian degeneration of axons. Exp. Neurol. 1995;136:183–198. - PubMed
    1. Bergert M., Erzberger A., Desai R.A., Aspalter I.M., Oates A.C., Charras G., Salbreux G., Paluch E.K. Force transmission during adhesion-independent migration. Nat. Cell Biol. 2015;17:524–529. - PMC - PubMed
    1. Bovetti S., Hsieh Y.C., Bovolin P., Perroteau I., Kazunori T., Puche A.C. Blood vessels form a scaffold for neuroblast migration in the adult olfactory bulb. J. Neurosci. 2007;27:5976–5980. - PMC - PubMed
    1. Bryant D.M., Mostov K.E. From cells to organs: building polarized tissue. Nat. Rev. Mol. Cell Biol. 2008;9:887–901. - PMC - PubMed
    1. Bussmann J., Bos F.L., Urasaki A., Kawakami K., Duckers H.J., Schulte-Merker S. Arteries provide essential guidance cues for lymphatic endothelial cells in the zebrafish trunk. Development. 2010;137:2653–2657. - PubMed

Publication types

Substances