. 2015 Aug 17:5:13216.
doi: 10.1038/srep13216.

In vivo micro-scale tomography of ciliary behavior in the mammalian oviduct

Affiliations

In vivo micro-scale tomography of ciliary behavior in the mammalian oviduct

Shang Wang et al. Sci Rep. .

Abstract

Motile cilia in the mammalian oviduct play a key role in reproduction, such as transporting fertilized oocytes to the uterus for implantation. Due to their small size (~5-10 μm in length and ~300 nm in diameter), live visualization of cilia and their activity in the lumen of the oviduct through tissue layers represents a major challenge not yet overcome. Here, we report a functional low-coherence optical imaging technique that allows in vivo depth-resolved mapping of the cilia location and cilia beat frequency (CBF) in the intact mouse oviduct with micro-scale spatial resolution. We validate our approach with widely-used microscopic imaging methods, present the first in vivo mapping of the oviduct CBF in its native context, and demonstrate the ability of this approach to differentiate CBF in different locations of the oviduct at different post-conception stages. This technique opens a range of opportunities for live studies in reproductive medicine as well as other areas focused on cilia activity and related ciliopathies.


Figures

Figure 1
Figure 1. In vivo fOCT imaging setup.
(a) The experimental setup for in vivo mouse oviduct imaging. (b) Microscopic image of the mouse reproductive organs exposed for fOCT imaging. (c) 3D OCT structural image of the same area showing overall morphology of the mouse ovary and oviduct. Distinct regions of the oviduct (ampulla and isthmus) are color-coded. Scale bars correspond to 600 μm. The schematic in (a) was created by the authors using Adobe Illustrator software.
Figure 2
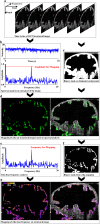
Figure 2. Method for CBF mapping with fOCT.
(a) Time series of 2D depth-resoled OCT structural images through the mouse oviduct is acquired. (b) Typical temporal intensity (speckle) profile from the location of cilia and the corresponding amplitude spectrum from fast Fourier transform. (c) Binary mask created from the averaged image of the time series of OCT B-scans. (d) Mapping of the peak amplitude from the spectrum indicating the location of the cilia with green color. (e) The position of the peak from the obtained spectrum represents the frequency of the cilia beat. (f) Binary mask created from the cilia location image. (g) Mapping of the frequency of cilia beat to the OCT structural image providing the fOCT image of the ciliary activity. The observed ciliated surface at the lower left portion in (d) and (g) corresponds to the ciliated grooves in the luminal surface of the adjacent deeper-positioned loop of the oviduct.
Figure 3
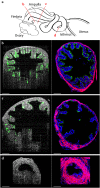
Figure 3. Validation of fOCT mapping of cilia location.
(a) Illustration of the positions imaged and analyzed from the ampulla and isthmus of the mouse oviduct. (bd) In vivo fOCT mapping of the cilia location (shown in green) and confocal immunofluorescence imaging of the corresponding areas of the oviduct at the anterior ampulla close to osteum (b), the posterior ampulla close to isthmus (c) and the isthmus (d). Immunofluorescence staining shows beta tubulin (green) labeling the microtubules of the cilia, phalloidin (red) labeling the oviduct wall, and DAPI (blue) labeling the nuclei. Scale bars correspond to 100 μm. The schematic in (a) was created by the authors using Adobe Illustrator software.
Figure 4
Figure 4. Validation of fOCT mapping of CBF.
Images (ae) correspond to bright-field microscopic analysis of CBF; Images (fm) correspond to the fOCT analysis of the same area. (a) Bright-field microscopic image (low magnification) of the inner lumen of the ampulla from extracted mouse oviduct. The red dashed square indicates the analyzed region shown in (b). The star in (b) labels the major groove used in the analysis. (c) Mapping of the cilia location obtained from the time series of the microscopic images. (d) Corresponding mapping of CBF obtained from the microscopic images. (e) CBF mapping overlapped with the bright-field microscopic image. (f) 3D OCT structural image of the same area. The red dashed square indicates the same region of interest shown in (g). The star labels the same position of the groove. (h) fOCT mapping of the cilia location in 3D. (i) Corresponding fOCT mapping of the CBF in 3D. (j) 3D CBF mapping overlapped with the OCT structural image. (k) Statistics of the measured CBF from the bright-field microscopy and the 3D fOCT indicating the statistically insignificant difference from a two-sample two-tailed student’s t test with the alpha value of 0.05. Data are presented as mean ± standard deviation. (l,m) 2D cross-section images obtained from (i) and (j), respectively. Three different types of arrows are used to indicate the correspondence of the CBF mapping between fOCT and the bright-field microscopy in (d) and (i). Scale bars in (a) and (f) correspond to 300 μm. Scale bars in all other panels correspond to 50 μm.
Figure 5
Figure 5. In vivo fOCT mapping of CBF in the mouse oviduct.
(a,b) Typical in vivo fOCT mapping of CBF from the ampulla and the isthmus, respectively, in the same animal. (c) In vivo CBF measurements from mouse oviducts (number of mice n = 5) indicating the insignificance of the difference between the frequency of cilia beat from the ampulla and the isthmus (two-sided Wilcoxon rank-sum tests with the alpha value of 0.05). Data are presented with mean ± standard deviation. (df) Typical in vivo OCT structural image (d), fOCT mapping of the CBF (e), and overlapped image (f) from the mouse ampulla at 0.5 dpc. (gi) Typical in vivo OCT structural image (g), corresponding fOCT mapping of the CBF (h), and the overlapped image (i) from the mouse ampulla at 2.5 dpc. (j) Statistics of in vivo CBF measurements showing higher frequency of the cilia beat from the mouse ampulla at 0.5 dpc in comparison with 2.5 dpc (p = 0.027 from a two-sample two-tailed student’s t test with the alpha value of 0.05). Data are presented with mean ± standard deviation. Scale bars correspond to 100 μm.

References

    1. Salathe M. Regulation of mammalian ciliary beating. Annu. Rev. Physiol. 69, 401–422 (2007). - PubMed
    1. Jain R. et al.. Sensory functions of motile cilia and implication for bronchiectasis. Front. Biosci. (Schol. Ed.) 4, 1088–1098 (2012). - PMC - PubMed
    1. Wirschell M. et al.. Regulation of ciliary motility: Conserved protein kinases and phosphatases are targeted and anchored in the ciliary axoneme. Arch. Biochem. Biophys. 510, 93–100 (2011). - PMC - PubMed
    1. Elgeti J. & Gompper G. Emergence of metachronal waves in cilia arrays. Proc. Natl. Acad. Sci. USA 110, 4470–4475 (2013). - PMC - PubMed
    1. Onoufriadis A. et al.. Targeted NGS gene panel identifies mutations in RSPH1 causing primary ciliary dyskinesia and a common mechanism for ciliary central pair agenesis due to radial spoke defects. Hum. Mol. Genet. 23, 3362–3374 (2014). - PMC - PubMed

Publication types

LinkOut - more resources