. 2015 Nov;156(11):3961-70.
doi: 10.1210/en.2015-1321. Epub 2015 Aug 17.

Bile Acids Trigger GLP-1 Release Predominantly by Accessing Basolaterally Located G Protein-Coupled Bile Acid Receptors

Affiliations

Bile Acids Trigger GLP-1 Release Predominantly by Accessing Basolaterally Located G Protein-Coupled Bile Acid Receptors

Cheryl A Brighton et al. Endocrinology. 2015 Nov.

Abstract

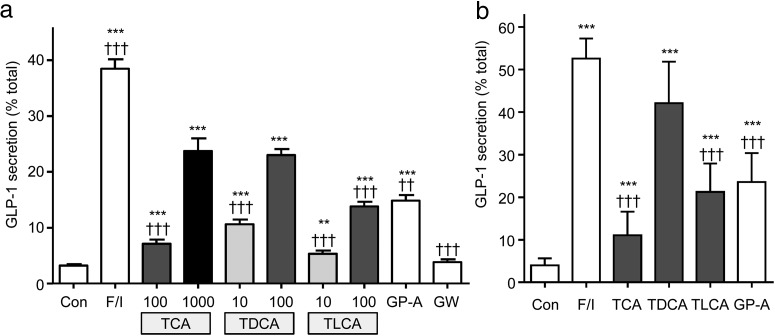
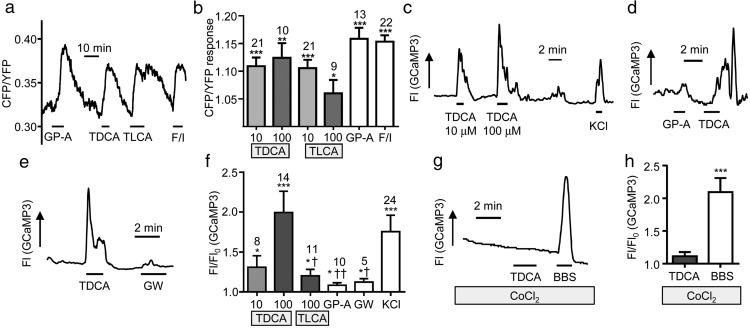
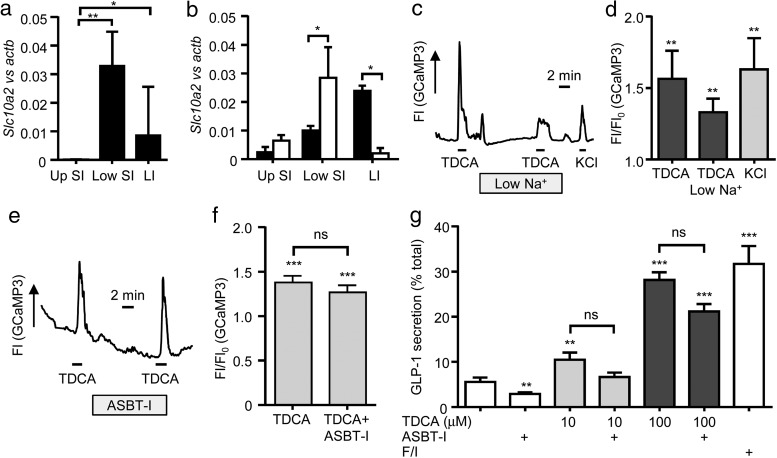
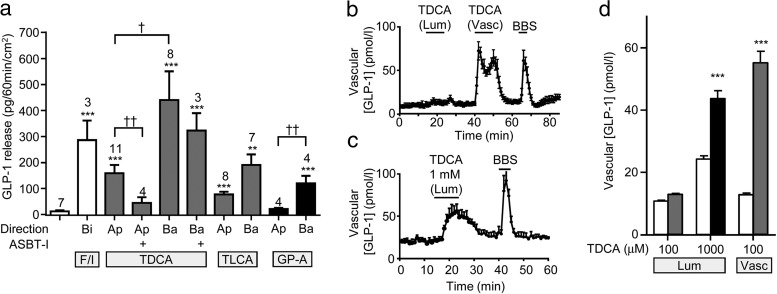
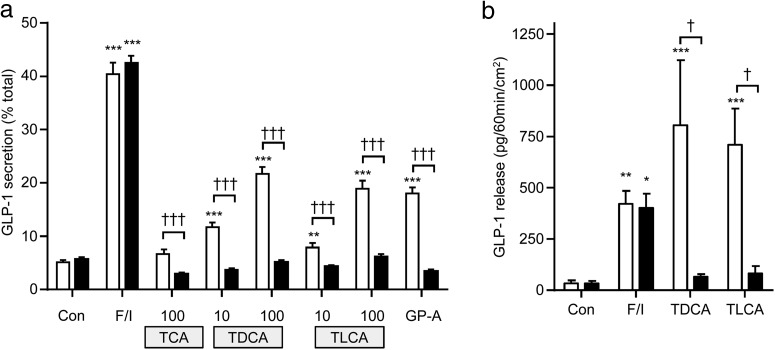
Bile acids are well-recognized stimuli of glucagon-like peptide-1 (GLP-1) secretion. This action has been attributed to activation of the G protein-coupled bile acid receptor GPBAR1 (TGR5), although other potential bile acid sensors include the nuclear farnesoid receptor and the apical sodium-coupled bile acid transporter ASBT. The aim of this study was to identify pathways important for GLP-1 release and to determine whether bile acids target their receptors on GLP-1-secreting L-cells from the apical or basolateral compartment. Using transgenic mice expressing fluorescent sensors specifically in L-cells, we observed that taurodeoxycholate (TDCA) and taurolithocholate (TLCA) increased intracellular cAMP and Ca(2+). In primary intestinal cultures, TDCA was a more potent GLP-1 secretagogue than taurocholate (TCA) and TLCA, correlating with a stronger Ca(2+) response to TDCA. Using small-volume Ussing chambers optimized for measuring GLP-1 secretion, we found that both a GPBAR1 agonist and TDCA stimulated GLP-1 release better when applied from the basolateral than from the luminal direction and that luminal TDCA was ineffective when intestinal tissue was pretreated with an ASBT inhibitor. ASBT inhibition had no significant effect in nonpolarized primary cultures. Studies in the perfused rat gut confirmed that vascularly administered TDCA was more effective than luminal TDCA. Intestinal primary cultures and Ussing chamber-mounted tissues from GPBAR1-knockout mice did not secrete GLP-1 in response to either TLCA or TDCA. We conclude that the action of bile acids on GLP-1 secretion is predominantly mediated by GPBAR1 located on the basolateral L-cell membrane, suggesting that stimulation of gut hormone secretion may include postabsorptive mechanisms.


Figures

Figure 1.
Figure 1.
Bile acid–induced GLP-1 secretion. Small intestinal (A) or colonic (B) cultures were incubated for 2 hours in saline solution containing 10 mmol/L glucose (control [Con]) and the following stimuli at the concentrations indicated (μmol/L): F/I, forskolin (10 μmol/L) plus IBMX (10 μmol/L), TCA, TDCA, TLCA, GPBAR-A (GP-A) (3 μmol/L), and GW4064 (GW) (5 μmol/L). GLP-1 release is expressed as a percentage of content. The results are the means ± SEM of n = 12 to 23 wells (A) and n = 12 wells, all bile acids at 100 μmol/L (B), with 3 to 4 wells originating from a single mouse performed in parallel. Statistical differences were determined using a one-way ANOVA and a post hoc Bonferroni test on log10-transformed data. Statistical differences from basal (*) or TDCA at 100 μmol/L (†) are displayed: **/††, P < .01; ***/†††, P < .001.
Figure 2.
Figure 2.
Intracellular cAMP and Ca2+ changes in L-cells. Mixed intestinal cultures were generated from the lower small intestine of mice expressing Epac2camps (A and B) or GCaMP3 (C and H) in L-cells. Cells were perfused with stimuli as indicated in saline buffer containing 10 mmol/L glucose. A, Representative cAMP response from an L-cell stimulated with GPBAR-A (GP-A; 3 μmol/L), TDCA (10 μmol/L), TLCA (10 μmol/L), and forskolin (10 μmol/L) plus IBMX (100 μmol/L) (F/I). B, Mean fold change in the CFP/YFP ratio, representing [cAMP], for cells recorded as in A. Error bars represent SEM; numbers of individual cells are indicated above the bars. Statistical differences from basal were determined by a one-sample t test (*, P < .05; **, P < .01; ***, P < .001). Bile acids were applied at 10 or 100 μmol/L as indicated. C–E, Representative L-cell calcium responses measured as GCaMP3 fluorescence (Fl) to TDCA at the concentrations indicated and 30 mmol/L KCl (C), GPBAR-A (GP-A, 3 μmol/L), GW4064 (GW, 5 μmol/L), or TDCA (100 μmol/L) (D and E). F, Mean increase in GCaMP3 fluorescence over baseline (Fl/Fl0) for cells recorded as in C to E. TLCA and TDCA concentrations were 10 or 100 μmol/L as indicated. Cells that did not respond to any stimuli were excluded from analysis (4 of 28). Results are means ± SEM, and numbers of individual cells are indicated above the bars. Statistical differences from basal signal (*) were determined via one-sample t tests and statistical differences from TDCA (†) were determined by a one-way ANOVA and post hoc Bonferroni test on log10-transformed data (*/†, P < .05; ††, P < .01; ***, P < .001). G and H, Cells were recorded and analyzed as in C–F, but in the presence of CoCl2 (5 mmol/L) to block voltage-gated Ca2+ channels. BBS (100 nmol/L) was used as a positive control. Two of 14 cells were excluded. ***, P < .001 by a one-sample t test on log10-transformed data compared with basal.
Figure 3.
Figure 3.
The role of ASBT in bile acid–induced GLP-1 release and intracellular Ca2+ changes. Expression of Asbt was determined in homogenized intestine segments (A) and FACS-isolated L-cell populations (B). Expression of Asbt (Slc10a2) in control cells (□) and L-cells (■) was determined relative to that of β-actin by qRT-PCR. Up SI, upper 10 cm of the small intestine; low SI, lower 12 cm of the small intestine; LI, large intestine. Mean ΔCT and upper SEM were calculated from 3 independent experiments and are presented as 2ΔCT. Statistical tests were assessed on nontransformed data using a one-way ANOVA and post hoc Bonferroni test (A) or two-tailed t tests (B) (*, P < .05; **, P < .01). C–F, Mixed lower small intestinal cultures of mice expressing GCaMP3 in L-cells were perfused with standard saline containing 10 mmol/L glucose and additions as indicated. C, Representative trace depicting GCaMP3 fluorescence (Fl) in response to TDCA (100 μmol/L) applied in standard and low (5.6 mmol/L) Na+ saline and 30 mmol/L KCl. D, Mean increase in GCaMP3 fluorescence over baseline (Fl/Fl0) for cells recorded as in C. Cells that did not respond to any stimuli (all responses <1.1-fold) were excluded (2 of 14). Results are means ± SEM (n = 12). Statistical significance from basal was determined on log10-transformed data via a one-sample t test (**, P < .01). E, Representative trace depicting a calcium response to TDCA (10 μmol/L) with and without the ASBT inhibitor (ASBT-I; 10 μmol/L). F, Mean ± SEM data are recorded as in E (n = 4). Statistical analysis was performed as in D (***, P < .001 from basal). G, Lower small intestinal cultures were incubated for 2 hours in saline solution containing 10 mmol/L glucose and stimuli as indicated. Test agents were TDCA (100 mymol/L), ASBT-I (10 μmol/L), and 10 μmol/L forskolin plus 10 μmol/L IBMX (F/I). GLP-1 release is expressed as a percentage of content. Results are means ± SEM of n = 12 wells, with 4 wells originating from a single mouse performed in parallel. Statistical differences were determined using a one-way ANOVA and post hoc Bonferroni test on log10-transformed data (**, P < .01; ***, P < .001, compared with basal).
Figure 4.
Figure 4.
GLP-1 secretion from murine ileal epithelial tissues mounted in Ussing chambers and from perfused rat intestine. A, Concentration change in GLP-1 in the basolateral compartment of Ussing chambers was assessed after 1 hour without treatment (left-hand column) or with treatment with TDCA (100 μmol/L), TLCA (100 μmol/L), GPBAR-A (GP-A; 3 μmol/L), or forskolin (10 μmol/L) plus IBMX (100 μmol/L) (F/I), applied to the apical (Ap), basolateral (Ba), or both compartments (bilaterally [Bi]) as indicated. At 10 minutes before application of TDCA, some tissues were pretreated bilaterally with 10 μmol/L ASBT inhibitor (ASBT-I). Results are normalized per 1 cm2 tissue area. Means ± SEM and numbers of tissue sheets are indicated. Statistical differences were determined on log10-transformed data using a one-way ANOVA and post hoc Bonferroni test either from basal (*) or between conditions as indicated (†) (†, P < .05; **/††, P < .01; ***, P < .001). B–D, TDCA-stimulated GLP-1 secretion from perfused rat intestine. B, TDCA (100 μmol/L) was applied to either the luminal (Lum) or vascular (Vasc) side. C, TDCA (1 mmol/L) was applied to the luminal side. BBS (10 nmol/L, vascular) was included at the end of all experiments as a positive control. Meas ± SEM GLP-1 responses from n = 6 to 7 perfused rat intestines (B and C) and time-averaged GLP-1 levels at baseline (□) and during TDCA addition (▩, 100 μmol/L/■, 1 mmol/L) (D) for experiments performed as in B and C are shown. Statistical differences from basal (*) were determined by a one-way ANOVA and post hoc Bonferroni test (***, P < .001).
Figure 5.
Figure 5.
Bile acid–induced GLP-1 secretion from GPBAR-knockout mice. GLP-1 secretion was measured from small intestinal cultures or tissue sections from wild-type (□) and GPBAR-knockout (■) mice. A, Cultures were incubated for 2 hours in saline solution containing 10 mmol/L glucose (control [Con]) and the following stimuli at the concentrations indicated (μmol/L): F/I, forskolin (10 μmol/L) plus IBMX (10 μmol/L), TCA, TDCA, TLCA, and GPBAR-A (GP-A) (3 μmol/L). GLP-1 release is expressed as a percentage of content. Results are means ± SEM of n = 9 wells, with 3 wells originating from a single mouse performed in parallel. B, Concentration change in GLP-1 in the basolateral compartment of Ussing chambers was assessed after 1 hour without treatment or with treatment with TDCA (100 μmol/L), TLCA (100 μmol/L), applied to the basolateral compartment, or forskolin (10 μmol/L) plus IBMX (100 μmol/L) (F/I), applied bilaterally. Results are normalized per 1 cm2 tissue area. Data are means ± SEM (n = 3–4). Statistical differences were determined using a two-way ANOVA and post hoc Bonferroni test on log10-transformed data. Statistical elevations from control (*) or differences between wild-type and knockout (†) mice are displayed: */†, P < .05; **, P < .01; ***/†††, P < .001.

References

    1. Baggio LL, Drucker DJ. Biology of incretins: GLP-1 and GIP. Gastroenterology. 2007;132:2131–2157. - PubMed
    1. Holst JJ. The physiology of glucagon-like peptide 1. Physiol Rev. 2007;87:1409–1439. - PubMed
    1. Tolhurst G, Reimann F, Gribble FM. Intestinal sensing of nutrients. Handb Exp Pharmacol. 2012;209:309–335. - PubMed
    1. Nauck MA. Incretin-based therapies for type 2 diabetes mellitus: properties, functions, and clinical implications. Am J Med. 2011;124(1 Suppl):S3–S18. - PubMed
    1. Jørgensen NB, Jacobsen SH, Dirksen C, et al. Acute and long-term effects of Roux-en-Y gastric bypass on glucose metabolism in subjects with type 2 diabetes and normal glucose tolerance. Am J Physiol Endocrinol Metab. 2012;303:E122–E131. - PubMed

Publication types

MeSH terms