

doi: 10.1038/nmeth.3541.
Epub 2015 Aug 17.
EMRinger: side chain-directed model and map validation for 3D cryo-electron microscopy
Affiliations
- PMID: 26280328
- PMCID: PMC4589481
- DOI: 10.1038/nmeth.3541
Item in Clipboard
EMRinger: side chain-directed model and map validation for 3D cryo-electron microscopy
Nat Methods.
2015 Oct.
Abstract
Advances in high-resolution cryo-electron microscopy (cryo-EM) require the development of validation metrics to independently assess map quality and model geometry. We report EMRinger, a tool that assesses the precise fitting of an atomic model into the map during refinement and shows how radiation damage alters scattering from negatively charged amino acids. EMRinger (https://github.com/fraser-lab/EMRinger) will be useful for monitoring progress in resolving and modeling high-resolution features in cryo-EM.
Conflict of interest statement
Figures
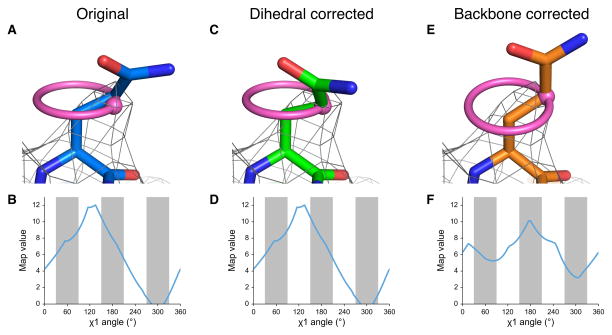
EMRinger χ1 map value sampling reports on backbone position and guides side-chain conformation. (a) The side chain of TrpV1 Gln 519 of Chain C (EMDB 5778, PDB 3J5P) is shown fitted, with a real space correlation coefficient (RSCC) of 0.590, to the potential map, shown at an isolevel of 10. (b) The EMRinger scan, reflected by the pink ring in a, for Gln 519 of Chain C reveals that the local map value peak (at 130°) occurs at a non-rotameric angle (white bars). This peak, shown as a pink dot in a, occurs 30° away from the modeled position. (c) The side chain can be rotated so that the χ1 angle is at the map value peak (RSCC = 0.526). (d) The EMRinger results are unchanged as the sampling occurs relative to the backbone atoms, which have not moved. (e) Alternatively, the backbone position can be corrected with Rosetta refinement to place the model near a χ1 map value peak a small reduction on the overall correlation of the residue to the map (RSCC = 0.442). (f) The peak at 175° is now in the rotameric region (grey bars).
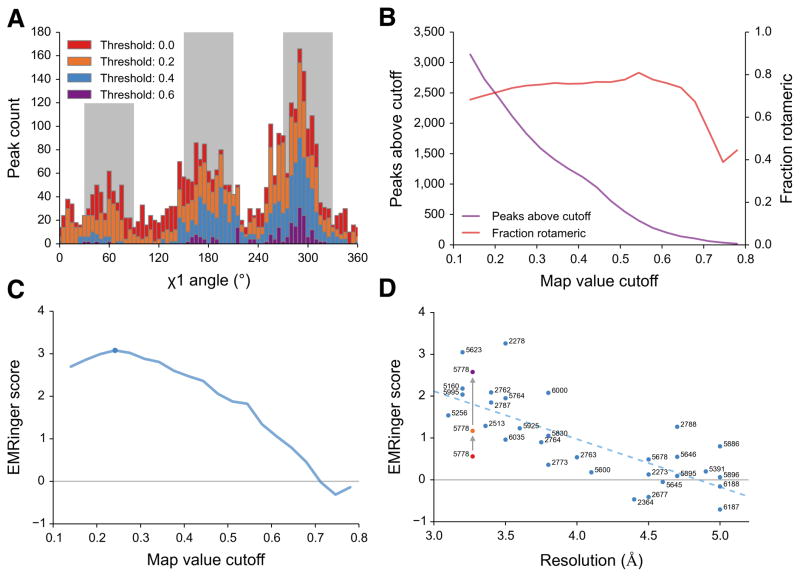
EMRinger reveals statistical enrichment at rotameric χ1 angles in high resolution EM maps. (a) Histograms of EMRinger peaks for the T20S proteasome structure (EMDB 5623, PDB 3J9I) observed above multiple map value cutoffs. At high cutoffs, more residues are located in the rotameric regions (grey bars). As the cutoff lowers, relatively more peaks are added to the non-rotameric regions (white bars). (b) Scanning across map value cutoffs demonstrates the tradeoff between sampled peaks (left) and fraction of rotameric peaks (right) for the proteasome structure. (c) The EMRinger score balances the sample size and the rotameric enrichment and is maximized at a cutoff of 0.242 for the proteasome structure (blue circle). (d) EMRinger scores for maps deposited in the EMDB with atomic models demonstrate the relationship between model quality and resolution. A linear fit (R2 = 0.549) highlights how refinement of TrpV1 improves from the deposited model (red, PDB 3j5p), the transmembrane domain of the deposited model (orange), and a model refined by Rosetta (green, PDB 3J9J) .
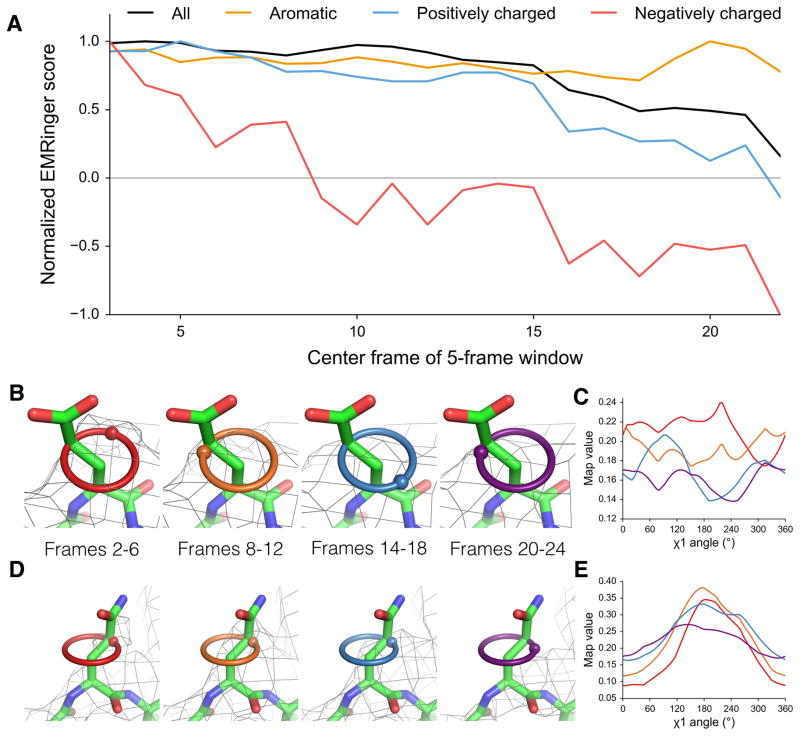
Acidic residues are differentially altered by radiation damage. (a) Normalized EMRinger scores are plotted for the T20S proteasome model (PDB: 3J9I) against maps calculated from 5 frames of data. Scores for the entire model (black), the aromatic residues (orange), and the positively charged residues (blue) slowly decrease as a function of dose. In contrast, negatively charged residues (red) experience a rapid drop and fall below a random score of 0. (b) Proteasome chain D residue Glu 99 shown in density (isolevel 0.18) for maps generated from frames 2–6 (red ring), 8–12 (orange ring), 14–18 (green ring), and 20–24 (blue ring), with spheres showing local map value peaks. (c) EMRinger plots for Glu 99 of Chain D corresponding to the maps in b show that peaks immediately flatten and eventually invert after high dose has accumulated. Colors correspond to the frames shown in b. (d) Proteasome chain 1 residue Gln 36 shown in density (isolevel 0.32) as in b. (e) EMRinger plots corresponding to the maps in d show a gradual loss of signal as a function of dose. Colors correspond to the frames shown in d.
References
-
- Shi Y. Cell. 2014;159:995–1014. - PubMed
-
- Wong W, et al. eLife. 2014;3
Publication types
MeSH terms
Substances
Associated data
- Actions
- Actions
Grants and funding
- R21 GM110580/GM/NIGMS NIH HHS/United States
- GM082250/GM/NIGMS NIH HHS/United States
- T32 GM008284/GM/NIGMS NIH HHS/United States
- T32 EB009383/EB/NIBIB NIH HHS/United States
- GM063210/GM/NIGMS NIH HHS/United States
- P50 GM082250/GM/NIGMS NIH HHS/United States
- P01 GM063210/GM/NIGMS NIH HHS/United States
- OD009180/OD/NIH HHS/United States
- DP5 OD009180/OD/NIH HHS/United States
- GM110580/GM/NIGMS NIH HHS/United States
- R01 GM082893/GM/NIGMS NIH HHS/United States
- T32GM008284/GM/NIGMS NIH HHS/United States
- GM082893/GM/NIGMS NIH HHS/United States
- GM098672/GM/NIGMS NIH HHS/United States
- R01 GM098672/GM/NIGMS NIH HHS/United States
LinkOut - more resources
Full Text Sources
Other Literature Sources
Miscellaneous
