. 2015 Sep 3;525(7567):62-7.
doi: 10.1038/nature14975. Epub 2015 Aug 17.

Architecture of the synaptotagmin-SNARE machinery for neuronal exocytosis

Affiliations

Architecture of the synaptotagmin-SNARE machinery for neuronal exocytosis

Qiangjun Zhou et al. Nature. .

Abstract

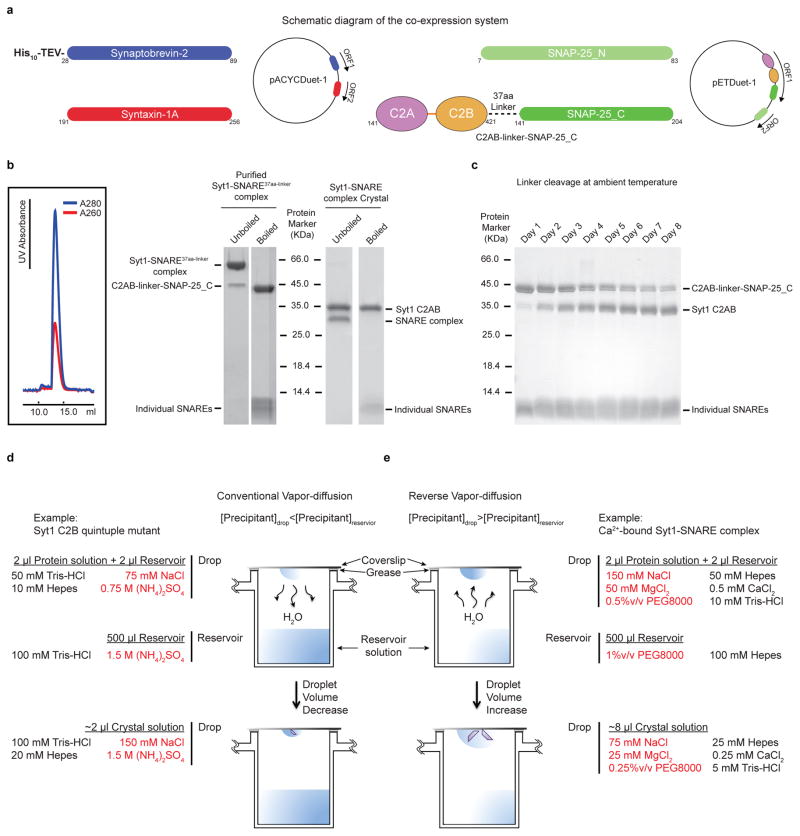
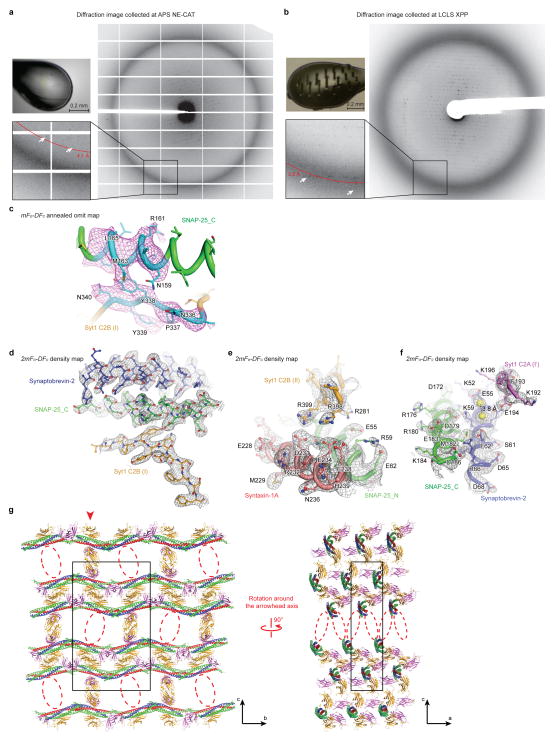
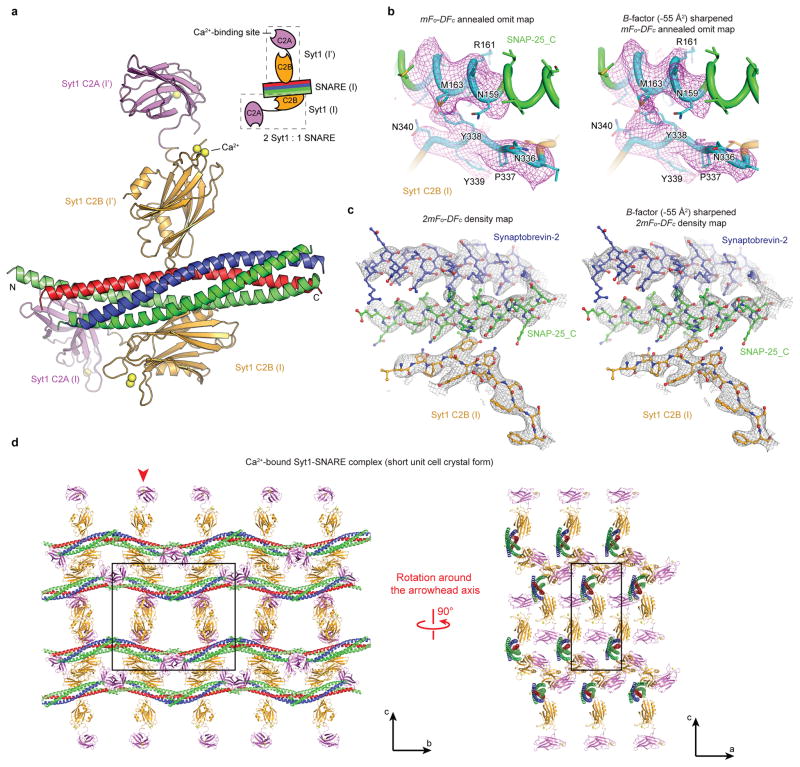
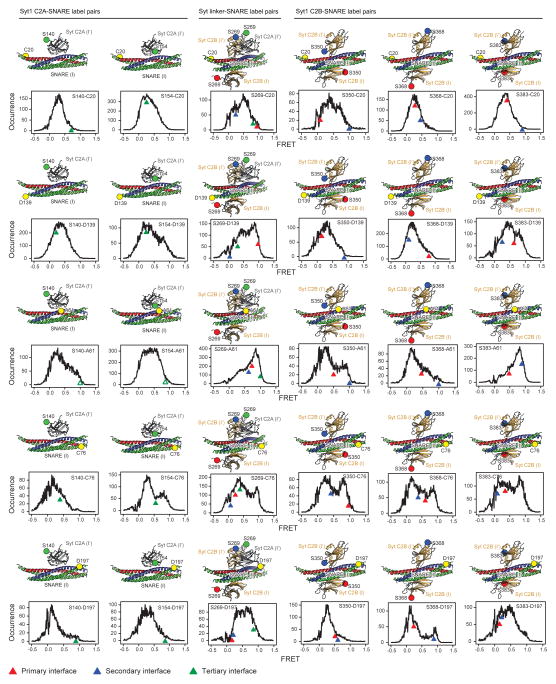
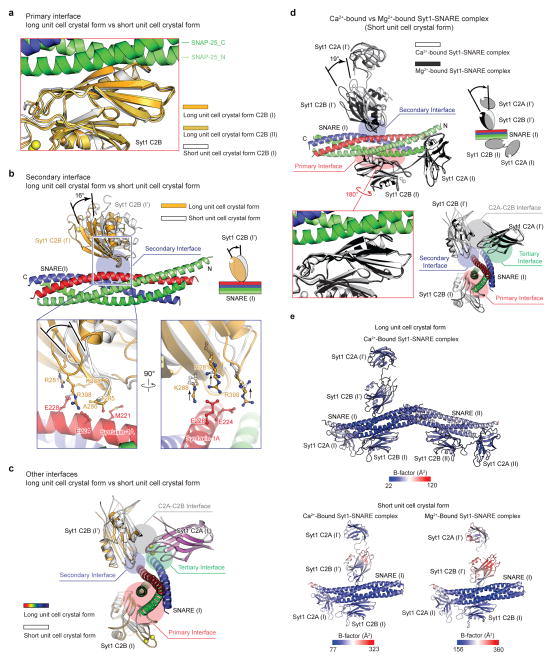
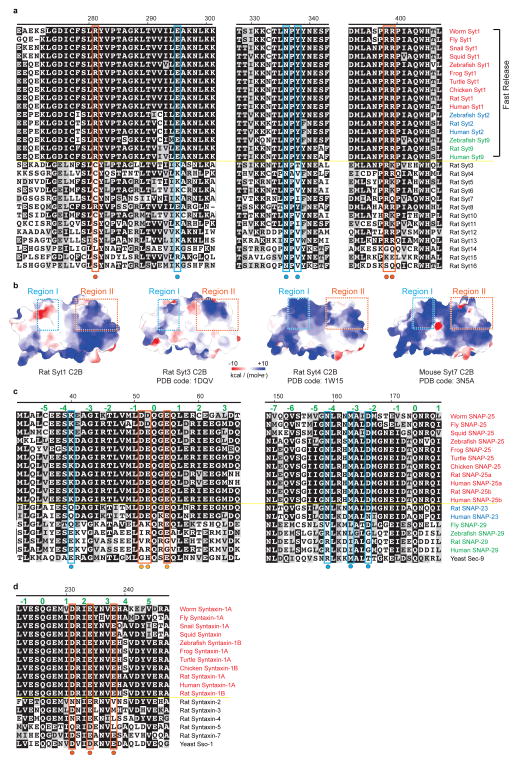
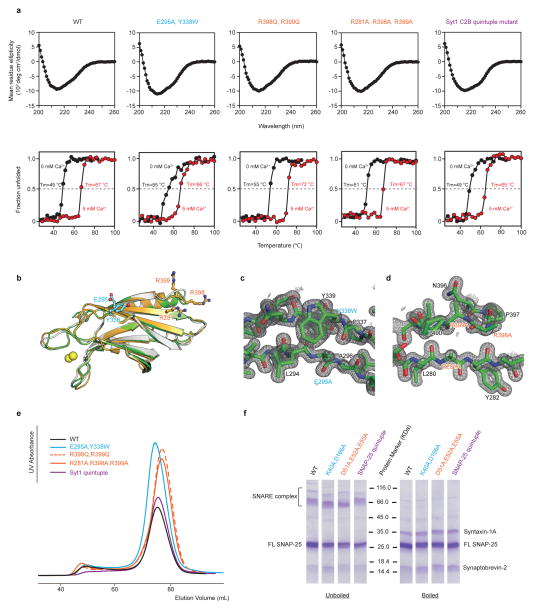
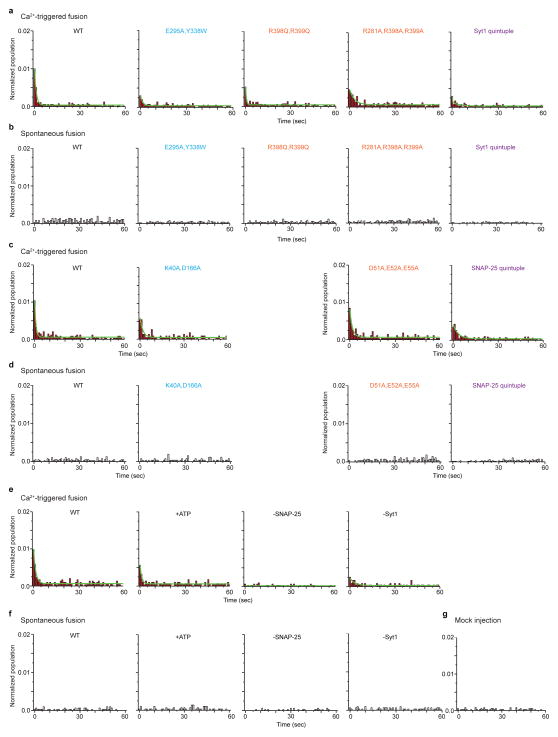
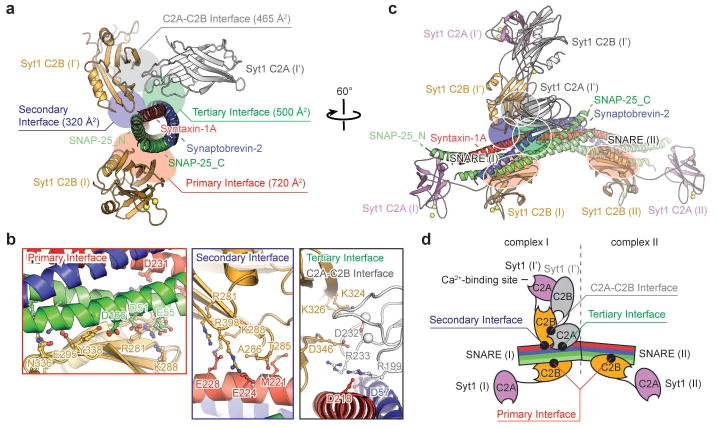
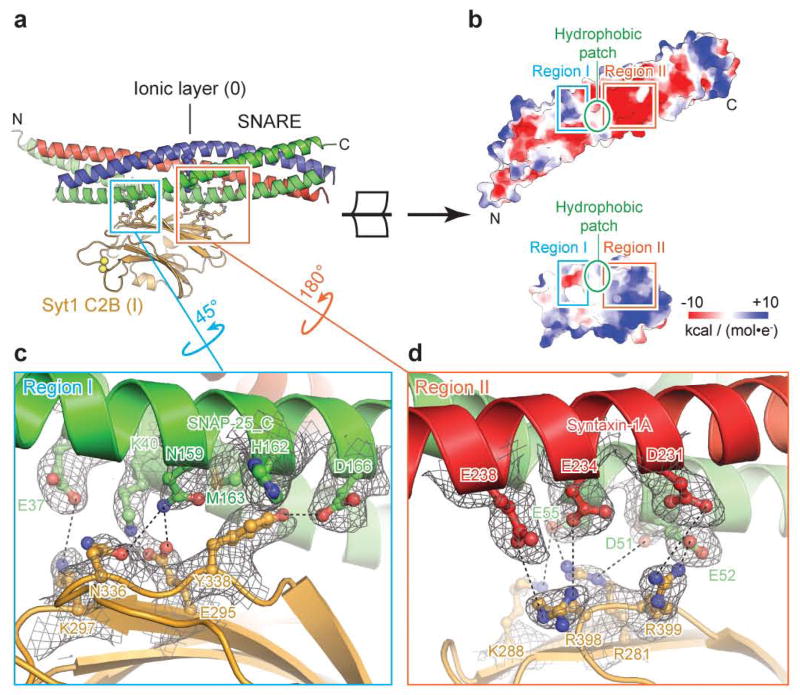
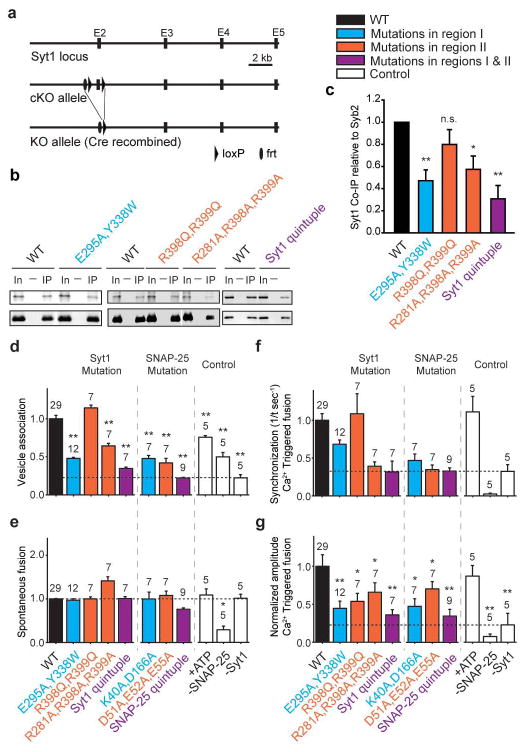
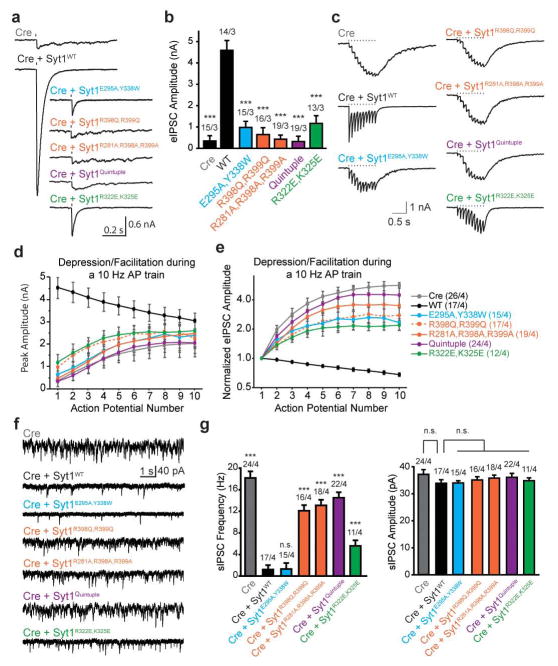
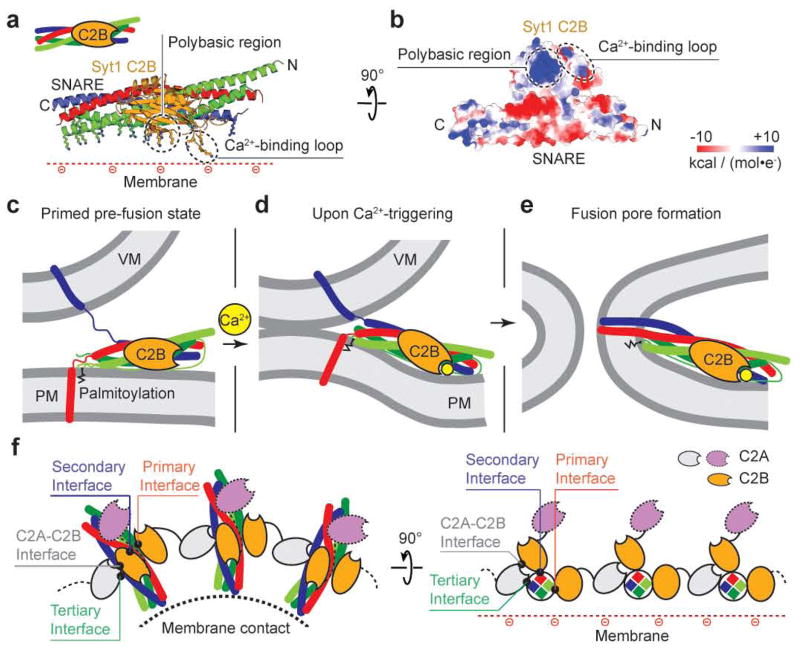
Synaptotagmin-1 and neuronal SNARE proteins have central roles in evoked synchronous neurotransmitter release; however, it is unknown how they cooperate to trigger synaptic vesicle fusion. Here we report atomic-resolution crystal structures of Ca(2+)- and Mg(2+)-bound complexes between synaptotagmin-1 and the neuronal SNARE complex, one of which was determined with diffraction data from an X-ray free-electron laser, leading to an atomic-resolution structure with accurate rotamer assignments for many side chains. The structures reveal several interfaces, including a large, specific, Ca(2+)-independent and conserved interface. Tests of this interface by mutagenesis suggest that it is essential for Ca(2+)-triggered neurotransmitter release in mouse hippocampal neuronal synapses and for Ca(2+)-triggered vesicle fusion in a reconstituted system. We propose that this interface forms before Ca(2+) triggering, moves en bloc as Ca(2+) influx promotes the interactions between synaptotagmin-1 and the plasma membrane, and consequently remodels the membrane to promote fusion, possibly in conjunction with other interfaces.


Conflict of interest statement

The authors declare no competing financial interests.

Figures

Extended Data Figure 1
Extended Data Figure 1. Purification and crystallization of the Syt1-SNARE complex
a, Diagram of the Duet co-expression vectors (Novagen) that express the fragments of the neuronal SNARE complex and the C2AB-linker-SNAP-25_C chimera used for purification and crystallization of the Syt1-SNARE37aa-linker complex. The rat syntaxin-1A and His-tagged rat synaptobrevin-2 fragments were cloned into the vector pACYCDuet-1; the C2AB-linker-SNAP-25_C chimera and the SNAP-25_N fragment were cloned into the vector pETDuet-1 with amino acid ranges labeled. Dashed lines represent the 37 amino acid linker (Methods). b, The purified Syt1-SNARE37aa-linker complex eluted as a single peak during size-exclusion chromatography (profile on the left). Left gel, Coomassie blue-stained SDS-PAGE gel of the purified Syt1-SNARE37aa-linker complex (unboiled and boiled). Right gel, Coomassie blue-stained SDS-PAGE gel of dissolved crystals of the Syt1-SNARE complex that were grown over a period of two months starting from purified Syt1-SNARE37aa-linker (unboiled and boiled). Although Syt1 was initially covalently linked to SNAP-25_C, the linker was cleaved during crystallization. The comparison between boiled and un-boiled lanes is a hallmark showing that neuronal SNARE complex is fully formed. c, Boiled Coomassie blue-stained SDS-PAGE gel of the purified Syt1-SNARE complex in solution at ambient temperature at the specified time after purification. Cleavage is apparent on day one and progresses slowly over several days. d, Schema showing the commonly used vapor-diffusion technique: the drop contains a lower concentration of the precipitant than the reservoir. The crystallization of the quintuple mutant of Syt1 C2B is used as an example. e, Schema showing a reverse vapor-diffusion method that was used for crystallization of the Ca2+-bound Syt1-SNARE37aa-linker complex: the drop contains a higher concentration of the precipitant than the reservoir.
Extended Data Figure 2
Extended Data Figure 2. Diffraction images, electron density maps, and crystal packing of the Syt1-SNARE complex in the long unit cell crystal form
a, Only one out of 85 screened crystals in the long unit cell crystal form diffracted to 4.1 Å resolution at the APS NE-CAT microfocus synchrotron beamline (a total of 105 crystals were screened with 20 that indexed in the short unit cell crystal form). b, 61 out of ~72 crystals in the long unit cell crystal form diffracted to at least 3.5 Å resolution at the LCLS XFEL (a total of 148 crystals were diffracted, out of those 113 crystals produced 578 images that could be processed; 35 crystals did not diffract or showed multiple lattices). These exposures were taken along the crystal c axis. The left upper pictures in panels a and b show images of loop-mounted crystals after X-ray exposure. c, mFo-DFc annealed omit map (Methods) of the Ca2+-bound Syt1-SNARE complex in the long unit cell crystal form using diffraction data collected at the LCLS XFEL; omitted residues within region I of the primary interface (residues 335 to 340 in Syt1 and 159 to 166 in SNAP-25) are colored cyan. The contour level is 2.3 σ. d–f, representative 2mFo-DFc electron density maps of the Ca2+-bound Syt1-SNARE complex in the long unit cell crystal form using diffraction data collected at the LCLS XFEL. The contour level is 1.5 σ. g, Views of the crystal lattice perpendicular to the bc (left) and to the ac (right) planes of the Ca2+-bound Syt1-SNARE complex in the long unit cell crystal form. The particular layer shown on the right corresponds to the red arrowhead in the left panel (only a slice corresponding to the layer is shown, creating the appearance of two disconnected groups of molecules – these groups are actually connected via interactions with the neighboring layers). The red dashed oval indicates the “missing” Syt1 C2AB fragment compared to the short unit cell crystal form (Extended Data Fig. 3d).
Extended Data Figure 3
Extended Data Figure 3. Asymmetric unit, electron density maps and crystal packing of the Syt1-SNARE complex in the short unit cell crystal form
a, Asymmetric unit of the Ca2+-bound Syt1-SNARE complex in the short unit cell crystal form at 3.6 Å resolution using diffraction data collected at the APS NE-CAT microfocus synchrotron beamline (Extended Data Table 1). The colour code is the same as in Fig. 1c. Two Syt1 C2AB fragments (distinguished by the designators I and I′) bind to the same SNARE complex in the asymmetric unit (see schema). b, mFo-DFc annealed omit map (Methods) of the Ca2+-bound Syt1-SNARE complex in the short unit cell crystal form collected at the APS NE-CAT microfocus synchrotron beamline; omitted residues within region I of the primary interface (residues 335 to 340 in Syt1 and 159 to 166 in SNAP-25) are colored cyan. The contour level is 2.3 σ. Left side: without B-factor sharpening, right side: with B-factor sharpening. c, Representative 2mFo-DFc electron density map of the Ca2+-bound Syt1-SNARE complex for the short unit cell crystal form using diffraction data collected at the APS NE-CAT microfocus synchrotron beamline. The contour level is 1.5 σ. Left side: without B-factor sharpening, right side: with B-factor sharpening. b and c: The sharpening B-factor (−55 Å2) was set to make the lowest atomic B-factor of the short unit cell crystal form comparable to that of the long unit cell crystal form. Even with B-factor sharpening, the electron density map of the long unit cell crystal form collected at the LCLS XFEL is superior to that of the short unit cell crystal form collected at the APS NE-CAT microfocus synchrotron beamline. d, Views of the crystal lattice perpendicular to the bc (left) and to the ac (right) planes of the Ca2+-bound Syt1-SNARE complex in the short unit cell crystal form. The particular layer shown on the right corresponds to the red arrowhead in the left panel. The unit cell is outlined by a black box.
Extended Data Figure 4
Extended Data Figure 4. Single molecule FRET efficiency distributions of the Syt1-SNARE complex vs. FRET efficiency values calculated from the Syt1-SNARE interfaces observed in the crystal structure
Shown are histograms of intermolecular single molecule FRET (smFRET) efficiency values that were measured between pairs of covalently attached organic labels on the Syt1 C2AB fragment and the SNARE complex (also shown as large spheres superimposed on the interfaces observed in the crystal structure). Arrowheads indicate FRET efficiencies calculated from the crystal structure of the Ca2+-bound Syt1-SNARE complex in the long unit cell crystal form (complex I) for the primary, secondary and tertiary interfaces, using the methods and approximations described in ref. to simulate the positions of dye centers in order to calculate the FRET-efficiency values. Only the dye pair combinations between the nearest C2 domain (including the C2A-C2B linker) and the SNARE complex were calculated for the three interfaces. Note that due to the presence of transitions between different states the histogram reflect a combined effect of interaction interfaces. The label at position A61 would have disrupted the tertiary interfaces between the C2A domain and the SNARE complex, explaining the discrepancy for these labels (indicated by open triangles). In retrospect, the top smFRET-derived model and the primary interface observed in the crystal structure primarily differed in the orientation of the C2B domain. Moreover, the top smFRET derived model predicted the approximate location primary interface on the neuronal SNARE (see Fig. 4c in ref. ).
Extended Data Figure 5
Extended Data Figure 5. Comparison of the two crystal forms and the Ca2+- and Mg2+-bound crystal structures of the Syt1-SNARE complex
a, Superposition of the primary interfaces of the Ca2+-bound Syt1-SNARE complex structure in the long unit cell crystal form (gold and bright-orange) and in the short unit cell crystal form (white). The primary interface is very similar in both crystal forms: the RMSD for the primary interface between both crystal forms is 0.38 Å (bright-orange) and 0.42 Å (white) for complex I and complex II, respectively (including Cα atoms of the SNARE complex and the Syt1 C2B (I) domain forming the interface). b, Superposition of complex I in the long unit cell crystal form with the asymmetric unit of the short unit cell crystal form, but only showing the secondary interface (light blue shaded disk) between Syt1 C2B (I′) and the SNARE complex (I). The bottom panels show close-up views of the secondary interface: left, interacting residues (sticks and balls); right, a 90° rotated view of the view shown in the left panel. The Syt1 C2B (I′) domain is rotated by 16 degrees between the two crystal forms and, as a consequence, the interactions between residues R281, K288, R398 of the Syt1 C2B (I′) domain and residues E224, E228 of syntaxin-1A are slightly changed by this rotation. Interestingly, residues Syt1 R281, K288 and R398 are involved in both the primary (Fig. 2) and secondary interfaces. c, Superposition of complex I in the long unit cell crystal form with the asymmetric unit of the short unit cell crystal form, showing all interfaces. d, Superposition of the Ca2+-bound (white) and Mg2+-bound (black) crystal structures of the Syt1-SNARE complex, both in the short unit cell crystal form. The lower left sub-panel shows a close-up view of the primary interface, indicating that it is very similar in both the Ca2+- and Mg2+-bound crystal structures. The Syt1 C2B domain that forms the secondary interface (light blue shaded disk) is rotated by 19 degrees between the Ca2+- and Mg2+-bound complexes. The lower right sub-panel is a rotated view of the complex, and also showing the tertiary interface (light green shaded disk), and the C2A-C2B interface that involve asymmetry-related Syt1 C2A domain (I′) (gray shaded disk). e, B-factor coloured cartoon representations of the asymmetric units of the Ca2+-bound long unit cell crystal form (upper), the Ca2+-bound short unit cell crystal form (lower left), and the Mg2+-bound short unit cell crystal form (lower right) of the Syt1-SNARE complex. Note that the primary interfaces have relatively low B-factors, similar to the majority of the structure, while parts of the C2A and C2B domains involved in the secondary and tertiary interfaces have higher B-factors, possibly indicating increased flexibility.
Extended Data Figure 6
Extended Data Figure 6. Sequence alignments of Syt1, SNAP-25, and syntaxin-1A from different homologs
a, Sequence alignment of Syt1 homologues, showing the sequences around the primary interface of the Syt1-SNARE complex. Note that rat Syt5 refers to UniProt ID Q925C0, zebrafish Syt9 refers to GeneBank accession number AAI52175, rat Syt9 refers to UniProt ID P47861, and human Syt9 refers to UniProt ID O00445. b, Electrostatic potential surfaces of the known crystal structures of synaptotagmin-1, synaptotagmin-3, synaptotagmin-4 and synaptotagmin-7; the dashed rectangles indicate the regions that correspond to the primary interface regions I and II of the Syt1-SNARE complex. c, Sequence alignment of different SNAP-25 homologs, showing the sequences around the primary interface of the Syt1-SNARE complex. d, Sequence alignment of different syntaxin homologs, showing a sequence range around the primary interface of the Syt1-SNARE complex. In all panels, the interacting residues of the primary interface are indicated by solid circles and coloured boxes for region I (cyan) and region II (red-orange).
Extended Data Figure 7
Extended Data Figure 7. Syt1 and SNAP-25 mutants are well folded
a, Upper panels, CD spectra of WT and mutant Syt1 C2B domains in the absence of Ca2+. Lower panels, thermal denaturation was monitored by molar ellipticity at a wavelength of 216 nm in the absence of Ca2+ (black) and in the presence of 5 mM Ca2+ (red). The specified melting temperatures were estimated as the mid-point of the melting curves (Methods). b, Superposition of the Syt1 C2B domains from the Ca2+-bound Syt1-SNARE complex in the short unit cell crystal form (gold), the crystal structure of the quintuple mutant (R281A, E295A, Y338W, R398A, R399A) of the Syt1 C2B domain (green), and the crystal structure of the isolated Syt1 C2B domain (white, PDB code 2YOA). c and d, Representative m2Fo-DFc electron density maps of the crystal structure of the quintuple mutant of the Syt1 C2B domain (Extended Data Table 1) contoured at 2.0 σ. The labels refer to the mutated residues. e, Overlay of SEC profiles of full-length Syt1 mutant proteins used in the single vesicle-vesicle fusion assay (Figs. 3d–g). f, Coomassie blue-stained SDS-PAGE with and without boiling of neuronal SNARE complexes formed by full-length SNAP-25 and its mutants, syntaxin-1A, and synaptobrevin-2, using the proteins that were used in the single vesicle-vesicle fusion assay (Methods).
Extended Data Figure 8
Extended Data Figure 8. Probability of fusion vs. time upon 500 μM Ca2+-injection and spontaneous fusion for Syt1 and SNAP-25 mutants
Shown are the data that were used to generate Figs. 3d–g. The number of independent experiments and analyzed events are provided in Extended Data Table 2. a–d, Cumulative histograms of probability of fusion vs. time for Syt1 mutants upon 500 μM Ca2+-injection (a) and spontaneous fusion (b), and SNAP-25 mutants upon 500 μM Ca2+-injection (c) and spontaneous fusion (d). Control experiments: e, Ca2+-triggered fusion; f, spontaneous fusion with 3 mM ATP, without SNAP-25 or Syt1; and g, mock injection without Ca2+.
Figure 1
Figure 1. Crystal structure of the Syt1-SNARE complex
a, Structure of the Ca2+-bound Syt1-SNARE complex (only showing complex I) in the long unit cell crystal form (Extended Data Table 1, Extended Data Fig. 2). Two Syt1 C2B domains (designated as I and I′) and one Syt1 C2A domain (related by crystallographic symmetry and coloured in white) form a total of three interfaces (primary, secondary, and tertiary) with the neuronal SNARE complex (synaptobrevin-2, syntaxin-1A, and the two SNARE domains of SNAP-25A: SNAP-25_N and SNAP-25_C). A fourth interface (C2A-C2B interface) is located between Syt1 C2B (I′) and Syt1 C2A (I′). Interface areas are provided in parenthesis. b, Close-up views of the four interfaces with labels for sidechains of interacting residues. The left sub-panel shows a superposition of both primary interfaces that occur in the long unit cell crystal form (root-mean-square-difference, RMSD = 0.34 Å, including Cα atoms of the SNARE complex and the Syt1 C2B domain forming the interface). The middle sub-panel shows the secondary interface. The right sub-panel shows both the tertiary interface and the C2A-C2B interface. c, Rotated view of panel a, but showing the entire asymmetric unit and the symmetry-related Syt1 C2AB fragment. Three Syt1 C2AB fragments (designated as I, I′ and II) bind to two SNARE complexes in the asymmetric unit. SNARE (II) only interacts with the C2B domain of one Syt1 C2AB fragment, Syt1 (II), via the same primary interface as observed in complex I. d, A schema corresponding to the structure shown in panel c.
Figure 2
Figure 2. Primary interface between the Syt1 C2B domain and the neuronal SNARE complex
a, Overview of the primary interface (complex I in the long unit cell crystal form) along with interacting residues (sticks and balls). b, Open-book view of the electrostatic potential map of the primary interface. The two polar regions I, II are connected by a hydrophobic patch (SNAP-25 I44, L47, V48 and Syt1 V292, L294, A402). c, d, Close-up views of regions I and II. Interacting residues are labeled, along with dashed lines that indicate hydrogen bonds or salt bridges. 2mFo-DFc electron density maps of the interacting residues are superimposed (grey mesh; contour level = 1.5 σ).
Figure 3
Figure 3. Mutations of the primary interface affect binding and Ca2+-triggered single vesicle-vesicle fusion
“Syt1 quintuple” refers to the Syt1 mutant (R281A, E295A, Y338W, R398A, R399A). “SNAP-25 quintuple” refers to the SNAP-25 mutant (K40A, D51A, E52A, E55A, D166A). The colour code is specified in the figure. a, Schematic diagram of the Syt1 cKO mice. The Syt1 exon 2 which contains the transmembrane domain is floxed. Cre-recombinase removes exon 2, ablating all cytoplasmic Syt1 sequences. b, Co-immunoprecipitation of either Syt1 (top row) or synaptobrevin-2 (bottom row) with a syntaxin-1A antibody in Syt1 cKO cultured neurons rescued with the indicated Syt1 mutant constructs. c, Quantification of co-immunoprecipitation of Syt1 normalized to synaptobrevin-2. Results are scaled to Syt1 WT levels. All data are means ± SEMs; statistical significance was analyzed by the Student’s t-test comparing the mutants with WT Syt1; **, P<0.01, n=4 for Syt1 E295A, Y338W and “Syt1 quintuple”; n.s., no significant difference, n=3 for Syt1 R398Q, R399Q; *, P<0.05, n=4 for Syt1 R281A, R398A, R399A. d–g, Bar graphs showing the effects of Syt1 and SNAP-25 mutants in fusion of single vesicles with reconstituted neuronal SNAREs, Syt1, and complexin-1 (Methods and ref. ). d, Number of associated SV vesicles after incubation of SV-vesicles with surface-immobilized PM-vesicles for a 1 min period. e, Number of spontaneous fusion events over the subsequent 1-min observation period normalized by the number of associated SV vesicles. f, Synchronization, that is, decay rates (1/τ), of the histograms of fusion events upon 500 μM Ca2+-injection. Error bars are error estimates computed from the covariance matrix upon fitting the corresponding cumulative histograms with a single exponential decay function using a Levenberg-Maquardt technique. g, Amplitude of the first 1-sec time bin upon Ca2+-injection. Each value in this panel was normalized by the respective number of fusion events after Ca2+ injection. d, e, g, All data are means ± SEMs; the number of independent repeat experiments are depicted above the bars and in Extended Data Table 2; statistical significance was assessed by the Student’s t-test comparing all other conditions with WT (**, P<0.005; *, P<0.05). The cumulative fusion histograms are shown in Extended Data Fig. 8. Controls in panels d–g are in the presence of 3 mM ATP and in the absence of SNAP-25 and Syt1. As expected, Ca2+-triggered fusion required the presence of both SNAP-25 and Syt1; fusion is not affected by the presence of ATP.
Figure 4
Figure 4. Mutations of the primary interface impair Syt1 function in Ca2+-triggered release
Recording of inhibitory postsynaptic currents (IPSCs) from cultured Syt1 cKO hippocampal neurons infected with lentiviruses expressing Cre-recombinase and Syt1 mutants of the primary interface and a mutant of the polybasic region (R322E, K325E). All recordings were performed in the presence of CNQX (20 μM) and AP-5 (50 μM) using a high Cl internal solution. a and b, Sample traces of evoked IPSCs from single action potentials (a) and quantification of peak amplitudes (b). Tick mark indicates stimulus delivery. All data are means ± SEMs; number of cells/independent cultures analyzed are depicted above the bars; statistical significance was assessed by one-way analysis of variance comparing all other conditions with WT rescue group (***, P<0.001). c–e, Syt1 mutants display facilitation, instead of depression, during high-frequency stimulation. c, Sample traces of 10 Hz trains; d and e quantification of absolute (d) and normalized (e) IPSC amplitudes during the train; numbers of cells/independent cultures analyzed are depicted in parentheses in the labels for each of the traces. f and g, Syt1 mutants are unable to clamp the frequency of spontaneous IPSCs. f, Sample sIPSC traces; g, quantification of event frequency (left) and amplitude (right). All data are means ± SEMs; the number of cells/independent cultures analyzed are depicted above the bars. Statistical significance was assessed by one-way analysis of variance comparing all other conditions with the WT rescue group (***, P<0.001; n.s., no significant difference).
Figure 5
Figure 5. Model of the role of the primary Syt1-SNARE interface
a–b, Unit that is formed by the primary interface between Syt1 C2B and the SNARE complex. a, Cartoon representation with positively charged sidechains shown as sticks; b, electrostatic potential map looking towards the positively charged face of the Syt1 C2B-SNARE unit. c–e, Proposed function of the Syt1 C2B-SNARE unit. c, Initial state prior to Ca2+ triggering. The juxtamembrane linkers of synaptobrevin-2 and of syntaxin-1A were modeled as random coils. d, Intermediate state after Ca2+-triggering when the membranes are close enough to promote stalk formation. e, Fusion pore formation. Zigzag lines: palmitoylated cysteine residues of the SNAP-25 linker region. VM, vesicle membrane, PM, plasma membrane. f, Other interfaces found in the crystal structure, along with the primary interface, could form a connected network of SNARE complexes that surrounds the point of contact between membranes. The left panel is a top down view onto the point of contact between membranes, the right panel is a rotated projection view.

References

    1. Wickner W, Schekman R. Membrane fusion. Nat Struct Mol Biol. 2008;15:658–664. - PMC - PubMed
    1. Rothman JE. The Principle of Membrane Fusion in the Cell (Nobel Lecture) Angew Chemie Int Ed. 2014:n/a–n/a. doi: 10.1002/anie.201402380. - DOI - PubMed
    1. Sutton RB, Fasshauer D, Jahn R, Brunger AT. Crystal structure of a SNARE complex involved in synaptic exocytosis at 2.4 A resolution. Nature. 1998;395:347–353. - PubMed
    1. Weber T, et al. SNAREpins: minimal machinery for membrane fusion. Cell. 1998;92:759–772. - PubMed
    1. Südhof TC. Neurotransmitter release: the last millisecond in the life of a synaptic vesicle. Neuron. 2013;80:675–90. - PMC - PubMed

Publication types

MeSH terms