. 2015 Sep;17(9):1205-17.
doi: 10.1038/ncb3225. Epub 2015 Aug 17.

mTOR regulates MAPKAPK2 translation to control the senescence-associated secretory phenotype

Affiliations

mTOR regulates MAPKAPK2 translation to control the senescence-associated secretory phenotype

Nicolás Herranz et al. Nat Cell Biol. 2015 Sep.

Erratum in

Abstract

Senescent cells secrete a combination of factors collectively known as the senescence-associated secretory phenotype (SASP). The SASP reinforces senescence and activates an immune surveillance response, but it can also show pro-tumorigenic properties and contribute to age-related pathologies. In a drug screen to find new SASP regulators, we uncovered the mTOR inhibitor rapamycin as a potent SASP suppressor. Here we report a mechanism by which mTOR controls the SASP by differentially regulating the translation of the MK2 (also known as MAPKAPK2) kinase through 4EBP1. In turn, MAPKAPK2 phosphorylates the RNA-binding protein ZFP36L1 during senescence, inhibiting its ability to degrade the transcripts of numerous SASP components. Consequently, mTOR inhibition or constitutive activation of ZFP36L1 impairs the non-cell-autonomous effects of senescent cells in both tumour-suppressive and tumour-promoting contexts. Altogether, our results place regulation of the SASP as a key mechanism by which mTOR could influence cancer, age-related diseases and immune responses.


Figures
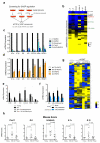
Figure 1
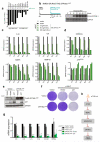
Figure 1. A drug screen identifies rapamycin as a regulator of the SASP
a. Scheme of the screening. b. A drug screen identifies rapamycin as a regulator of the SASP. IMR90 ER:RAS cells were induced with 4OHT to activate ER:RAS and treated with a library of chemical compounds from the day of induction. Seven days after 4OHT induction, the expression of selected SASP components (IL-1β, IL-6, IL-8, CCL20, InhibinA and VEGFc) was analysed by qPCR. c. IMR90 ER:RAS cells were treated as in (b) in the presence of 10 nM rapamycin, 25 nM Torin1, or 0.5 nM NVP-BEZ235. Expression of SASP genes was assessed by qRT-PCR (n=4). V, IMR90 expressing an empty vector; R, IMR90 infected with pLNC-ER:RAS. d. Expression of SASP genes in the indicated IMR90 ER:RAS cells was measured by qRT-PCR 7 days after 4OHT induction (n=3) e. The expression of SASP genes was assessed in young (passage 11) and old (passage 23) IMR90 human fibroblasts treated as indicated for 7 days (n=3). f. mTOR knockdown inhibits the SASP observed in irradiated IMR90 fibroblasts. RNA was collected 8 days after irradiation (5 Gy), (n=3). g. MS analysis shows a global effect of mTOR inhibition on SASP regulation. IMR90 ER:RAS cells (vector or shmTOR) were incubated with DMSO or 4OHT with no FBS. After 6 days, CM was collected and processed for MS. Heatmap represents the global effect of mTOR depletion on the identified secreted factors (see Methods for details). 3 independent experiments are shown; yellow indicates above-mean expression and blue indicates below-mean levels. h. Decreased expression of SASP genes in aged mice treated with rapamycin. Expression of SASP components in livers of young mice (3 months, n=5) and old mice (22 months) either untreated (n=9) or treated (n=9) with rapamycin was measured by qRT-PCR. P values are included. All statistical significances were calculated using two-tailed Student’s t-test, *** P < 0.001; ** P < 0.01; *P < 0.05; n.s, non significant. All error bars represent means ± s.d. n represents number of mice in h and independent experiments in c-f. For raw data, see Supplementary Table 7.
Figure 2
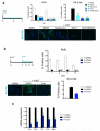
Figure 2. mTOR inhibition impairs the SASP without reversing the senescence growth arrest
a. mTOR inhibition results in decreased SA-β-Gal activity but cells remain arrested. IMR90 ER:RAS cells were induced to undergo senescence by 4OHT treatment. Cells were treated with the indicated drugs from day 0. BrdU incorporation was measured at day 4 and 7 after induction while SA-β-Gal activity was determined at day 7. Data are mean ± s.d. from n=6 (BrdU) and n=4 (SA-β-Gal) independent experiments. Representative images for SA-β-Gal activity staining are shown. Scale bar, 40 μm. b. Inhibition of mTOR after senescence induction downregulates SA-β-Gal activity without reversing growth arrest. Senescence was induced in IMR90 ER:RAS cells by 4OHT treatment for 7 days. At that stage, senescent cells were treated with 25 nM Torin1. BrdU incorporation was monitored at the indicated times and SA-β-Gal activity was measured at day 13. Data are mean ± s.d. n=4 independent experiments. Representative images for SA-β-Gal activity staining are shown. Scale bar, 40μm. c. Inhibition of mTOR after senescence induction downregulates the SASP. IMR90 ER:RAS cells were treated as in (b). The expression of the indicated SASP components was monitored by qRT-PCR 13 days after 4OHT induction (6 days after adding Torin1). Data are mean ± s.d. from n=3 independent experiments. All statistical significances were calculated using two-tailed Student’s t-test, *** P < 0.001; ** P < 0.01; *P < 0.05; n.s, non significant. For raw data, see Supplementary Table 7.
Figure 3
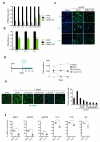
Figure 3. 4EBP mediates the regulation of the SASP downstream of mTOR
a-c. Expression of an eIF4EBP1-4A phosphomutant (4EBP1 DN) that cannot be phosphorylated by mTOR prevents SASP induction. IMR90 ER:RAS cells were infected with a vector expressing 4EBP1 DN (or empty vector). (a) Expression of SASP genes was measured by qRT-PCR 7 days post-induction with 4OHT. Data are mean ± s.d. from n=3 independent experiments. (b) Fold changes of normalised intensity values obtained from SASP components immunostainings (IL8, IL1α and IL1β). Data are mean ± s.d. from n=4 independent experiments. (c) Representatives images from (b). Scale bar, 30μm. d. 7 days after 4OHT induction, IMR90 ER:RAS cells were treated as indicated in the scheme. DAPI staining was used to asses the cell numbers at the indicated times. Data are mean ± s.d. n=6 independent experiments. e. 7 days after 4OHT induction, the global protein synthesis rate in IMR90 ER:RAS cells was measured by using an AHA-based fluorescent assay. Cells were pre-treated for 2h as indicated prior to addition of 100 μM AHA. Fluorescent intensities, reflecting newly synthesized protein, were measured after 30min (DAPI used as a counterstain). (right) Data are mean ± s.d. from n=4 independent experiments. (left) Representative images are shown. Scale bar, 40μm. f. Effect of Torin1 on the distribution of SASP mRNAs in the polysomes of senescent cells. IMR90 ER:RAS cells were incubated for 7 days with 4OHT and then treated with DMSO or 250 nM Torin1 for 3h prior to sucrose gradient fractionation and polysome profiling. The resulting polysome profiles as well as a schematic representation of the position of fractions, monosomes and polysomes are shown in Supplementary Fig. 3c-d. Graphs show the % of the indicated mRNAs present in actively translating polysome fractions. EEF2 and RPS20 transcripts are mTOR canonical targets. GAPDH is insensitive to mTOR inhibition. Data are mean ± s.d. n=3 independent experiments. All statistical significance was calculated using two-tailed Student’s t-test, *** P < 0.001; ** P < 0.01; *P < 0.05; n.s, non significant. For raw data, see Supplementary Table 7.
Figure 4
Figure 4. mTOR regulates the SASP by controlling MAPKAPK2 translation
a. Phosphoproteomic analysis reveals that mTOR signalling controls MAPKAPK2 kinase activity. IMR90 ER:RAS cells were incubated with DMSO or 4OHT and the indicated drugs for 7 days and further processed for MS analysis. Heatmap shows the enrichment of substrate groups for the different kinases calculated by the KSEA algorithm during senescence and in response to mTOR inhibition. (see Methods for details). The average of 3 independent experiments is shown. R, Rapamycin; T, Torin1; N, NVPBEZ-235. b. IMR90 ER:RAS cells were treated as indicated for 7 days. Immunoblots were performed with the indicated antibodies. c. The association of MAPKAPK2 mRNA with polysomes significantly decreases upon acute mTOR inhibition. Graphs show the percentage of MAPKAPK2 and MAPK14 (encoding for p38α MAPK) mRNAs associated with polysomes (n=3) IMR90 ER:RAS cells were incubated for 7 days with 4OHT and then treated with DMSO or 250 nM Torin1 (3h). d. IMR90 ER:RAS cells were treated as indicated for 7 days. Expression of MAPKAPK2 and MAPK14 was assessed by qRT-PCR (n=3) e. mTOR inhibition strongly impairs de novo translation of MAPKAPK2. After 7 days of 4OHT treatment, IMR90 ER:RAS cells were treated as shown in the scheme. AHA containing proteins were biotinylated and further purified using streptavidin beads. The expression of de novo synthesised proteins was analyzed by immunoblot with the indicated antibodies (right) and quantified (left) (n=3). f. IMR90 ER:RAS cells were infected with a 4EBP1-DN. The expression of 4EBP1, MAPKAPK2 and p38α was measured by immunoblot 7 days after 4OHT addition g.IMR90 ER:RAS cells were treated with 100nM MK2 inhibitor III. The expression of the indicated SASP components was monitored by qRT-PCR 7 days after 4OHT induction (n=3). All statistical significance was calculated using two-tailed Student’s t-test, *** P < 0.001; ** P < 0.01; *P < 0.05; n.s, non significant. All error bars represent means ± s.d. n represents number of independent experiments. For b,e and f representative images from 3 independent experiments are shown. Unprocessed original scans of blots are shown in Supplementary Fig. 9. For raw data, see Supplementary Table 7.
Figure 5
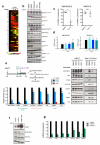
Figure 5. MAPKAPK2 phosphorylates ZFP36L1 to regulate the SASP
a. The effect of mTOR inhibition on ZFP36L1 phosphorylation during OIS was analysed by immunoblot using a ZFP36L1 antibody and a pZFP36L1S203 antibody. p, phosphorylated; u, unphosphorylated. b. Immunoblot analysis of ZFP36L1 phosphorylation in IMR90 ER:RAS cells treated with MK2 inhibitor III (20, 100 and 200 nM). c-e. IMR90 ER:RAS cells were infected with ZFP36L1 wt or a mutant version (ZFP36L1S54A,S92,S203, ZFP36L1Mut) predicted to not be phosphorylated by MAPKAPK2. (c) Immunoblot analysis of ZFP36L1. (d) (left) Effect on cell proliferation was assessed by CV staining 14 days after 4OHT addition. (right) BrdU incorporation (n=7) and SA-β-Gal activity (n=4) were monitored by IF. Scale bar, 40μm. (e). Expression of SASP components was assessed by qRT-PCR (n=5). f. Indicated IMR90 ER:RAS cells were treated with DMSO or 4OHT in the absence of FBS. After 6 days, CM was collected and processed for MS. Heatmap represents the global effect of ZFP36L1Mut on the identified secreted factors (see Methods for details). 3 independent experiments are shown. g. Venn diagrams representing the overlap between SASP factors downregulated by mTOR inhibitors, shmTOR and ZFP36L1Mut expression. h. The mean ARE score for the 18 SASP factors commonly downregulated by shmTOR and mTOR inhibitors (See Sup. Fig 1d) was calculated (red line). Plot denotes the ARE score distribution for 105 random combinations of 18 mRNAs. i. IMR90 ER:RAS cells were infected with 2 shRNAs targeting ZFP36L1 and treated as indicated. (left) Immunoblot analysis of ZFP36L1 expression. (right) The effect of rapamycin treatment on the SASP was assessed by qRT-PCR (n=3). Statistical significance was calculated by using: (d,e and j: Student’s t-test) (g: hypergeometric test), (h: permutation tests). *** P < 0.001; ** P < 0.01; *P < 0.05; n.s, non significant. Error bars represent means ± s.d. n represents number of independent experiments. For a-d and i, data is representative of 3 (c,d,i) or 4 (a,b) independent experiments. Unless otherwise stated, IMR90 ER:RAS cells were induced with 4OHT for 7 days. For unprocessed original scans of blots, see Supplementary Fig. 9. For raw data, see Supplementary Table 7.
Figure 6
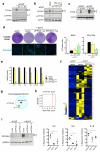
Figure 6. ZFP36L1 is a direct regulator of the SASP
a. Downregulation of the indicated genes (shown as log2 of the fold change) when comparing IMR90 ER:RAS cells expressing ZFP36L1Mut versus control IMR90 ER:RAS, as derived from the RNA-Seq data obtained from 3 independent experiments. ARE scores for the genes are shown. b. (left) Scheme of the experiment shown in c-d. (right) Expression of FLAG-ZFP36L1Mut was monitored by immunoblot upon treatment with doxycycline (200ng/ml) at the indicated times. TRE, Tetracycline response element. c-d. IMR90 ER:RAS were infected with TRE-FLAG-ZFP36L1Mut (or empty vector) and the reverse transactivator (rtTA-M3). Six days after 4OHT addition, expression of ZFP36L1Mut was induced with the indicated doses of doxycycline. Expression of the indicated transcripts was monitored by qRT-PCR at the indicated times. e-g. IMR90 ER:RAS expressing TRE-FLAG-ZFP36L1Mut (or empty vector) were further infected with a vector encoding the coding sequence of p21 (or empty vector). Six days after incubation with 4OHT, expression of ZFP36L1Mut was induced with 200ng/ml doxycycline for 72h (e). Expression of FLAG-ZFP36L1Mut and p21 was analysed by immunoblot. Data is representative of 3 independent experiments (f) Effect on cell proliferation was assessed by CV staining 14 days after 4OHT addition (8 days after doxycycline addition). Images are representative of 4 independent experiments. (g) Expression of the indicated SASP components was analysed by qRT-PCR (n=3 independent experiments) h. In senescent cells, mTOR signalling promotes translation of MK2 via 4EBP1. Ras activation triggers a signalling cascade that results in MK2 phosphorylation (via p38MAPK). Once phosphorylated, MK2 phosphorylates and inactivates ZFP36L1. If mTOR signalling is blocked, translation of MK2 is strongly compromised. As a consequence, the pool of phosphorylated MK2 is not sufficient to inactivate ZFP36L1. When active, ZFP36L1 binds to the 3’UTRs of many SASP components and promotes their degradation. Statistical significance was calculated using two-tailed Student’s t-test, *** P < 0.001; ** P < 0.01; *P < 0.05; n.s, non significant. Error bars represent means ± s.d. For b-d, data is representative of 2 independent experiments. Unprocessed original scans of blots are shown in Supplementary Fig. 9. For raw data, see Supplementary Table 7.
Figure 7
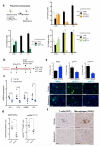
Figure 7. The mTOR/ZFP36L1 pathway regulates the protumorigenic effects of the SASP
a. For all the indicated conditions in the scheme (top, left), conditioned media (CM) of IMR90 ER:RAS was collected 7 days after 4OHT induction. Breast epithelial tumour T47D cells were cultured in that CM and, 48h after, E-Cadherin expression was monitored by IF. Data are mean ± s.d. from n=4 independent experiments. Fold changes of normalised intensity values (bottom) and representative pictures are shown (top). Student’s T-test was performed to compare the indicated cells to their respective controls. *** P < 0.001; ** P<0.01; n.s., non significant. Scale bar, 40 μm. b. Both mTOR knockdown and expression of ZFP36L1Mut prevent the ability of CM from senescent cells to induce invasion of tumoral cells. HFFF2 fibroblasts were infected with the indicated plasmids and subjected to irradiation (5Gy). Conditioned media was collected 8 days after and tested for their ability to induce invasion of 5PT squamous carcinoma cells. Data are mean ± s.d. from n=4 independent experiments (shMTOR) and n=7 independent experiments (ZFP36L1Wt/Mut) . Student’s T-test was performed to compare the indicated conditions to the control. *** P < 0.001; * P<0.05; n.s., non significant. c. mTOR knockdown and expression of ZFP36L1Mut blunt the protumorigenic effect of the SASP in vivo. Irradiated (senescent) or nonirradiated (non senescent) HFFF2 fibroblasts, infected with the indicated vectors, were co-injected with 5PT squamous carcinoma cells in partially immunocompromised Rag1−/− mice. Tumour volume was measured after 5-6 weeks. Student’s T-test was performed to compare mice injected with irradiated versus nonirradiated fibroblasts for every single condition. n=5 mice per group. Data presented is mean ± s.d. *** P < 0.001; * P<0.05; n.s., non significant. For raw data, see Supplementary Table 7.
Figure 8
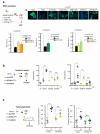
Figure 8. mTOR inhibition blunts the tumour suppressive effects of the SASP
a. (top left) Diagram summarizing the paracrine senescence/conditioned media experiments. CM of the indicated cells was collected 7 days after incubation with 4OHT. The effect of CM on BrdU incorporation and SASP induction in IMR90 wt cells was evaluated by IF (n=4 independent experiments). (top right) IMR90 ER:RAS shmTOR (bottom left) IMR90 ER:RAS cells expressing 4EBP1-DN (bottom right) IMR90 ER:RAS cells expressing ZFP36L1wt/ZFP36L1Mut. b-f. Treatment with rapamycin reduces the SASP, senescence and immune clearance in vivo. (b) NrasG12V transposons and a transposase were co-delivered into mouse livers through hydrodynamic injection (Day 0). Mice were treated with carrier or drugs from day −3 (3 days before NrasG12V injection) and sacrificed 6 or 9 days post-injection depending on the experiment. (c) Quantification of the expression of SASP components by qRT-PCR in livers of the indicated mice 6 days after NrasG12V injection. Carrier, n=5 mice; rapamycin, n=4 mice. P values are included. (d) MAPKAPK2 expression and 4EBP1 phosphorylation were analysed by immunoblot (see Supplementary Fig. S8d) and further quantified. MAPKAPK2 levels were normalised to GAPDH expression and 4EBP1 phosphorylation (p4EBP1T37/T46) was referred to normalised 4EBP1. Mice livers were obtained 6 days after NrasG12V induction. (n=4 mice per condition). (e) Quantification of Nras+ (left), p21Cip1+ (centre) and p16Ink4a+ (right) cells on liver sections 9 days after NrasG12V injection (n=5 mice per condition). Representative images of the sections quantified in the top panel are shown in the bottom. Scale bar, 40μm (f) Liver sections were collected 6 days after NrasG12V injection and stained for the CD3 (T cell marker) and F4/80 (macrophage marker). (Carrier n=5 mice, rapamycin n=4 mice; 200x). Arrows indicate clusters of infiltrating immune cells, which suggest clearance of senescence hepatocytes. Quantification of positive cells/mm2 (CD3+ T cells) or % of positive area (F4/80+ macrophages) is included in the images. Scale bar, 50 μm. All statistical significances were calculated using two-tailed Student’s t-test, *** P < 0.001; ** P < 0.01; *P < 0.05; n.s, non significant. All error bars represent means ± s.d. For raw data, see Supplementary Table 7.

Comment in

Similar articles

Cited by

References

    1. Collado M, Blasco MA, Serrano M. Cellular senescence in cancer and aging. Cell. 2007;130:223–233. - PubMed
    1. Salama R, Sadaie M, Hoare M, Narita M. Cellular senescence and its effector programs. Genes Dev. 2014;28:99–114. - PMC - PubMed
    1. Coppe JP, Desprez PY, Krtolica A, Campisi J. The senescence-associated secretory phenotype: the dark side of tumor suppression. Annu Rev Pathol. 2010;5:99–118. - PMC - PubMed
    1. Kuilman T, Peeper DS. Senescence-messaging secretome: SMS-ing cellular stress. Nat Rev Cancer. 2009;9:81–94. - PubMed
    1. Krtolica A, Parrinello S, Lockett S, Desprez PY, Campisi J. Senescent fibroblasts promote epithelial cell growth and tumorigenesis: a link between cancer and aging. Proc Natl Acad Sci U S A. 2001;98:12072–12077. - PMC - PubMed

METHODS REFERENCES

    1. Banito A, Gil J. Induced pluripotent stem cells and senescence: learning the biology to improve the technology. EMBO Rep. 2010;11:353–359. - PMC - PubMed
    1. Barradas M, Gil J, et al. Histone demethylase JMJD3 contributes to epigenetic control of INK4a/ARF by oncogenic RAS. Genes Dev. 2009;23:1177–1182. - PMC - PubMed
    1. Fellmann C, et al. An optimized microRNA backbone for effective single-copy RNAi. Cell Rep. 2013;5:1704–1713. - PubMed
    1. Debacq-Chainiaux F, Erusalimsky JD, Campisi J, Toussaint O. Protocols to detect senescence-associated beta-galactosidase (SA-betagal) activity, a biomarker of senescent cells in culture and in vivo. Nat Protoc. 2009;4:1798–1806. - PubMed
    1. Banito A, et al. Senescence impairs successful reprogramming to pluripotent stem cells. Genes Dev. 2009;23:2134–2139. - PMC - PubMed

Publication types

MeSH terms

Substances

Associated data