. 2015 Sep;125(9):3572-84.
doi: 10.1172/JCI79942. Epub 2015 Aug 17.

HDAC inhibitor-dependent transcriptome and memory reinstatement in cognitive decline models

HDAC inhibitor-dependent transcriptome and memory reinstatement in cognitive decline models

Eva Benito et al. J Clin Invest. 2015 Sep.

Abstract

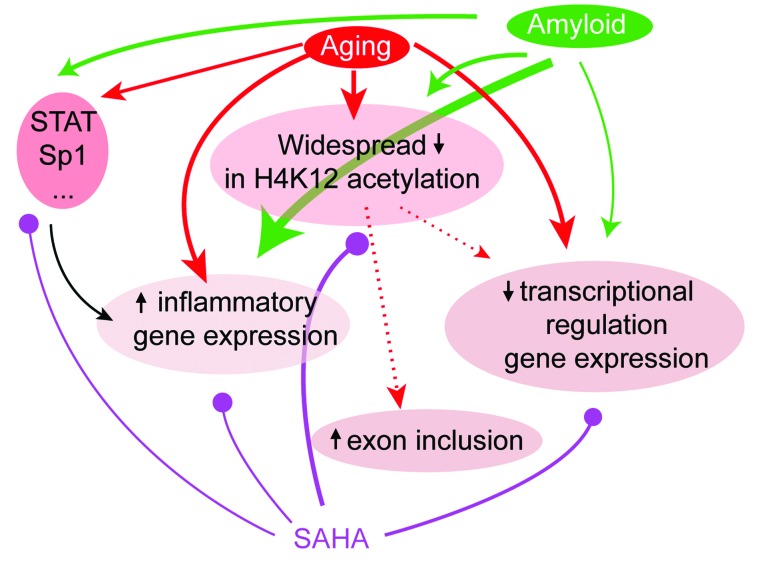
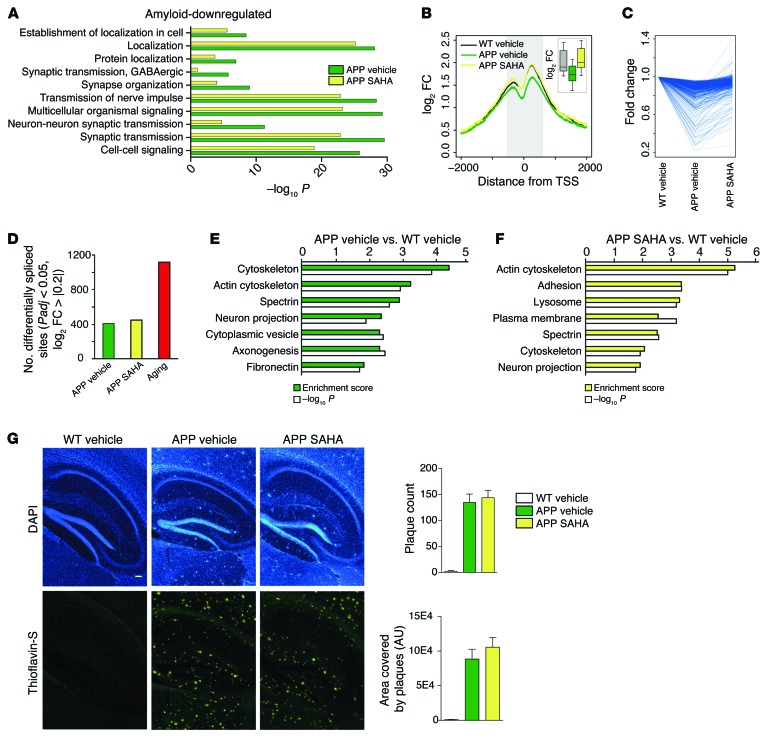
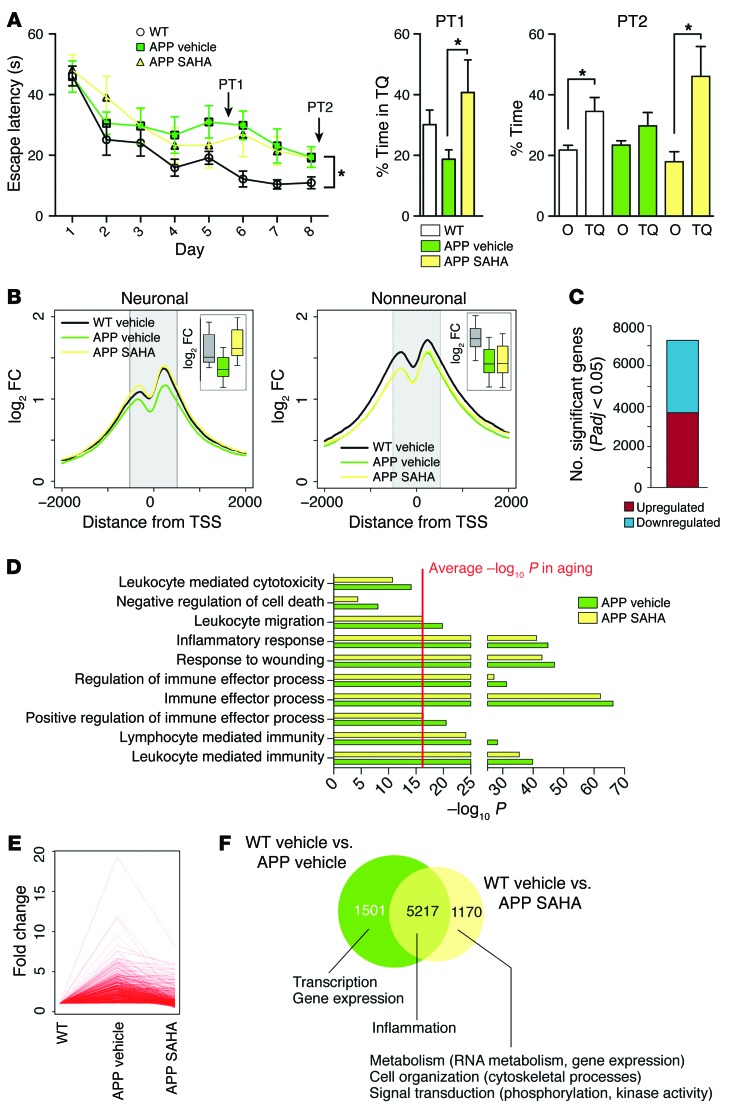
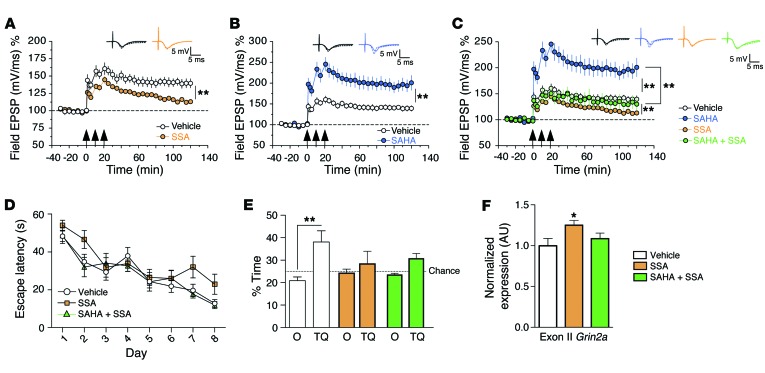
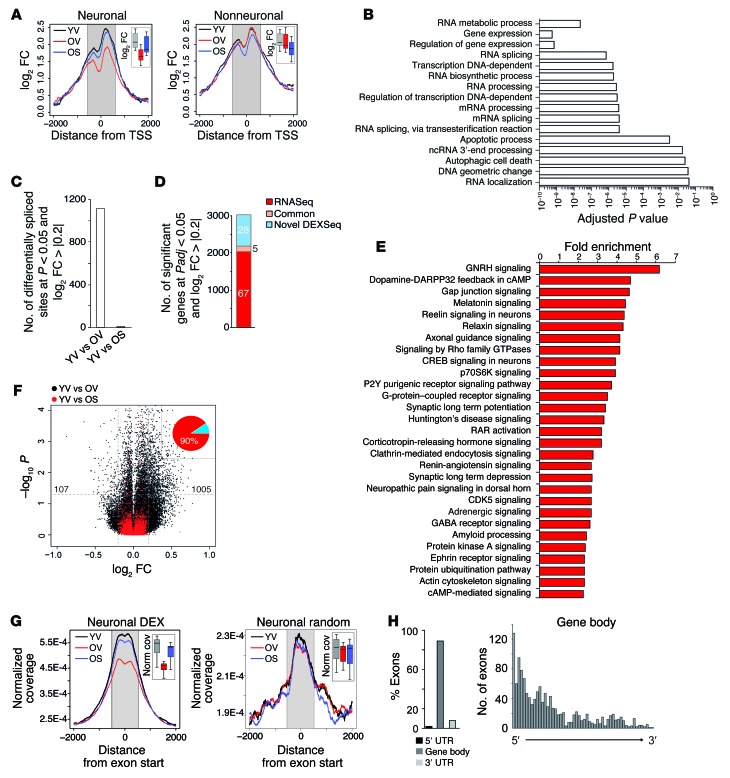
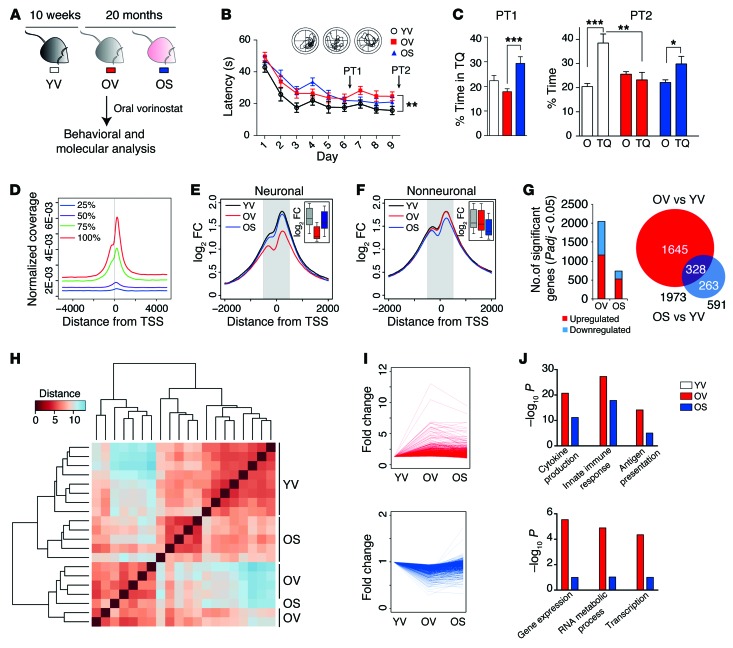
Aging and increased amyloid burden are major risk factors for cognitive diseases such as Alzheimer's disease (AD). Effective therapies for these diseases are lacking. Here, we evaluated mouse models of age-associated memory impairment and amyloid deposition to study transcriptome and cell type-specific epigenome plasticity in the brain and peripheral organs. We determined that aging and amyloid pathology are associated with inflammation and impaired synaptic function in the hippocampal CA1 region as the result of epigenetic-dependent alterations in gene expression. In both amyloid and aging models, inflammation was associated with increased gene expression linked to a subset of transcription factors, while plasticity gene deregulation was differentially mediated. Amyloid pathology impaired histone acetylation and decreased expression of plasticity genes, while aging altered H4K12 acetylation-linked differential splicing at the intron-exon junction in neurons, but not nonneuronal cells. Furthermore, oral administration of the clinically approved histone deacetylase inhibitor vorinostat not only restored spatial memory, but also exerted antiinflammatory action and reinstated epigenetic balance and transcriptional homeostasis at the level of gene expression and exon usage. This study provides a systems-level investigation of transcriptome plasticity in the hippocampal CA1 region in aging and AD models and suggests that histone deacetylase inhibitors should be further explored as a cost-effective therapeutic strategy against age-associated cognitive decline.


Figures

Figure 6
Figure 6. A graphical summary of the effects of aging and amyloid at the epigenetic, gene, and splicing level and the points of action of SAHA.
Both aging and amyloid pathology have indirect (epigenetic alterations [H2K12ac], regulation of transcription factors) and possibly direct effects on gene expression. We found that in aging these effects are primarily related to inflammation and splicing regulation. The effect on histone acetylation may also directly influence exon inclusion. Amyloid primarily targets inflammatory gene expression and, to a lesser extent, H4K12ac and nonhistone targets. SAHA acts on all of these molecular processes at all levels, though the exact mechanisms of action remain to be further investigated. Note that line thickness represents the extent to which a particular process is involved in aging/amyloid pathology or is targeted by SAHA according to our observations.
Figure 5
Figure 5. SAHA can partially reinstate amyloid-induced downregulation of transcriptional programs, but does not affect plaque load.
(A) Main functional categories associated with genes downregulated in APP vehicle animals and their significance. (B) Profile plot for H4K12ac signal for downregulated genes around the TSS in the neuronal population. The inset shows a box plot of the coverage within the shaded area. (C) Fold change for downregulated genes in APP vehicle and APP SAHA animals. Each line represents an individual gene. (D) Number of significant splice events under the indicated conditions. Note that aging is associated with almost a 3-fold greater deregulation of exon usage. (E and F) Functional categories associated with genes that contain 1 or more differentially expressed exons in APP vehicle (E) and APP SAHA (F) animals. (G) Representative images and quantification of plaque load in APP/PS1-21 animals treated with vehicle or SAHA. n = 4 (WT vehicle), 4 (APP vehicle), 5 (APP SAHA). Scale bar: 100 μm.
Figure 4
Figure 4. SAHA recapitulates the effects seen on aging in a model for amyloid deposition.
(A) Escape latency (left) and result from an early (PT1, middle) and later (PT2, right) probe test performed in APP/PS1-21 animals the received SAHA from 10 months of age. APP/PS1-21 animals treated with vehicle displayed significant learning impairment, as indicated by the escape latency (left panel). Repeated measures ANOVA, F(1,18) = 5.174. *P < 0.05, Student’s t test after Holm-Sidak correction, n = 11 (WT vehicle), 9 (APP vehicle), 7 (APP SAHA). (B) H4K12 profile plot across the genome around the TSS in the neuronal (left) and nonneuronal (right) population. Insets show the differences in signal within the shaded area. (C) Number of significantly up- and downregulated genes in APP/PS1-21 animals. Note the large difference in magnitude compared with aged WT animals. (D) Main functional categories associated with amyloid-induced upregulated genes and their significance. The red line indicates the average significance level for similar categories in aged animals for comparison purposes. (E) Fold change of genes upregulated in APP/PS1-21 mice that received vehicle solution (APP vehicle) and APP SAHA animals. Every line represents an individual gene. (F) Overlap of genes found to be significant in the control littermates that received vehicle solution (WT vehicle) vs. APP vehicle and WT vehicle vs. APP SAHA comparisons. The main functional categories associated with each set of genes are indicated. Error bars indicate SEM.
Figure 3
Figure 3. Impairment of hippocampal LTP and in spatial memory by deregulation of RNA splicing is only partially recovered via SAHA administration.
(A) When SSA (190 nM) was applied 1 hour prior to LTP induction, a significant reduction of LTP was observed. Repeated measures ANOVA, F(1,10) = 10.31, P < 0.01. (B) Administration of SAHA (10 μM) robustly enhances hippocampal LTP. Repeated measures ANOVA, F(1,10) = 15.21, P < 0.01. (C) Coadministration of SAHA with SSA could only partially recover the effect of SAHA. While LTP was significantly increased when comparing SSA alone to SSA plus SAHA (repeated measures ANOVA, F[1,10] = 14.37, P < 0.01), this effect barely reached the LTP level seen in the vehicle group. For each group, n = 6. Arrows indicate high-frequency stimulation to induce LTP. (D) Escape latency for vehicle-, SSA-, and SSA plus SAHA–treated animals. (E) Percentage of time spent in target quadrant vs. other quadrants during the probe test performed at day 9. **P < 0.01, t test after Holm-Sidak correction, n = 9 (vehicle), 8 (SSA), 7 (SSA plus SAHA). (F) qRT-PCR demonstrating increased expression of Grin2a’s exon II in SSA-treated animals. *P < 0.05, t test after Holm-Sidak correction, n = 7 (vehicle), 8 (SSA), 7 (SSA plus SAHA). Error bars indicate SEM.
Figure 2
Figure 2. SAHA reinstates physiological exon usage and H4K12ac levels at intron-exon junctions.
(A) Profile plot for H4K12ac for genes downregulated during aging and whose expression is fully reversed by SAHA in the neuronal (left) and nonneuronal (right) population. Inset shows box plots of the signal within the shaded area. (B) Functional categories and their significance associated with aging-downregulated genes whose expression is fully reversed by SAHA. (C) Number of splice sites significantly different in each of the indicated comparisons. (D) Of all genes found to be differentially expressed at the gene or exon level, the number and percentage (numbers inside each segment) of genes found in the RNA-seq only, in the DEX-seq analysis, or in common are represented. (E) Sample functional categories enriched within genes that contain 1 or more differential splicing events. (F) Volcano plot illustrating the magnitude and significance of changes at the exonic level that occur during aging after treatment with vehicle (black) or SAHA (red). Note that, whereas the distribution is clearly skewed toward the right (upregulations) in aged animals, this is reversed after SAHA treatment. Numbers within the graph denote the specific count of up- and downregulated exons at the indicated threshold for aged animals. Inset: percentage of exons with a higher inclusion rate (red) and a lower inclusion rate (blue) during aging. (G) H4K12ac signal around differentially spliced exons (left) and around a random set of exons (right) in the neuronal population. Insets represent box plots of the signal within the shaded area. DEX, differentially expressed exon. (H) Distribution of differentially spliced exons in aging across genes (left) and within the gene body (right).
Figure 1
Figure 1. Oral administration of SAHA improves memory function in an aging model and normalizes epigenetic and transcriptional activity.
(A) Experimental design. Old SAHA (OS), 20-month-old mice treated with SAHA for 4 weeks; old vehicle (OV), 20-month-old animals treated with vehicle; young vehicle (YV), 3-month-old mice treated with vehicle. (B) Escape latency during MWM training. Aged animals display significantly impaired escape latency in the MWM task. Repeated measures ANOVA, F(1,30) = 8.961, P < 0.01. (C) Probe test (PT) performance expressed as percentage of time spent in target quadrant (TQ) vs. average of other quadrants (O) for early (PT1) and later (PT2) probe test performed at indicated time points. *P < 0.05; **P < 0.01; ***P < 0.001, Student’s t test after Holm-Sidak correction. n = 14 (YV), 18 (OV), 16 (OS) (AC). (D) Profile plot of H4K12ac around TSS across whole genome for genes in 25th, 50th, 75th and 100th expression percentiles. Plot refers to CA1 neurons from YV-treated animals. (E) Profile plot of H4K12ac around TSS across genome for neuronal population. (F) Profile plot of H4K12ac around TSS across e genome for nonneuronal population. For E and F, inset shows box plot of the difference in coverage within shaded area (± 500 bp around TSS). Coverage is expressed as log2 fold-change over corresponding input. FC, fold change. (G) Left: number of genes at indicated significance cutoff up- or downregulated in the YV vs. OV and YV vs. OS comparisons. Right: Venn diagram illustrating overlap between genes in comparisons described above. Padj, P value adjusted. (H) Distance heat map with hierarchical clustering of YV, OV, and OS samples. Note that OS animals tend to cluster together with YV animals. (I) For every significant age-regulated gene, fold changes in OV and OS condition are plotted for upregulations (top) and downregulations (bottom) separately. (J) Sample functional categories overrepresented within upregulated (top) and downregulated (bottom) genes and their significance in animals treated with vehicle or SAHA. Error bars indicate SEM.

References

    1. Kouzarides T. Chromatin modifications and their function. Cell. 2007;128(4):693–705. doi: 10.1016/j.cell.2007.02.005. - DOI - PubMed
    1. Fischer A. Epigenetic memory: the Lamarckian brain. EMBO J. 2014;33(9):945–967. doi: 10.1002/embj.201387637. - DOI - PMC - PubMed
    1. Fischer A, Sananbenesi F, Mungenast A, Tsai LH. Targeting the right HDAC(s) to treat congitive diseases. Trends Pharmacol Sci. 2010;31(12):605–617. doi: 10.1016/j.tips.2010.09.003. - DOI - PubMed
    1. Gräff J, Tsai LH. Histone acetylation: molecular mnemonics on the chromatin. Nat Rev Neurosci. 2013;14(2):97–111. doi: 10.1038/nrn3427. - DOI - PubMed
    1. Mahgoub M, Monteggia L. Epigenetics and psychiatry. Neurotherapeutics. 2014;10(4):734–741. - PMC - PubMed

Publication types

MeSH terms