. 2015 Dec;23(6):504-12.
doi: 10.1037/pha0000045. Epub 2015 Aug 17.

A modified exponential behavioral economic demand model to better describe consumption data

Affiliations

A modified exponential behavioral economic demand model to better describe consumption data

Mikhail N Koffarnus et al. Exp Clin Psychopharmacol. 2015 Dec.

Abstract

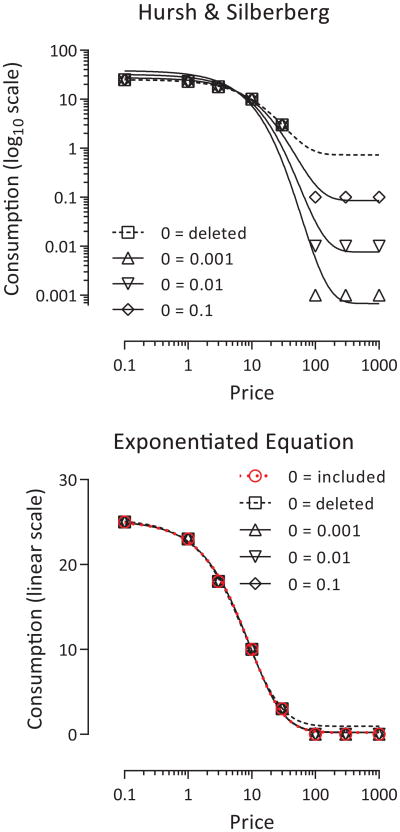
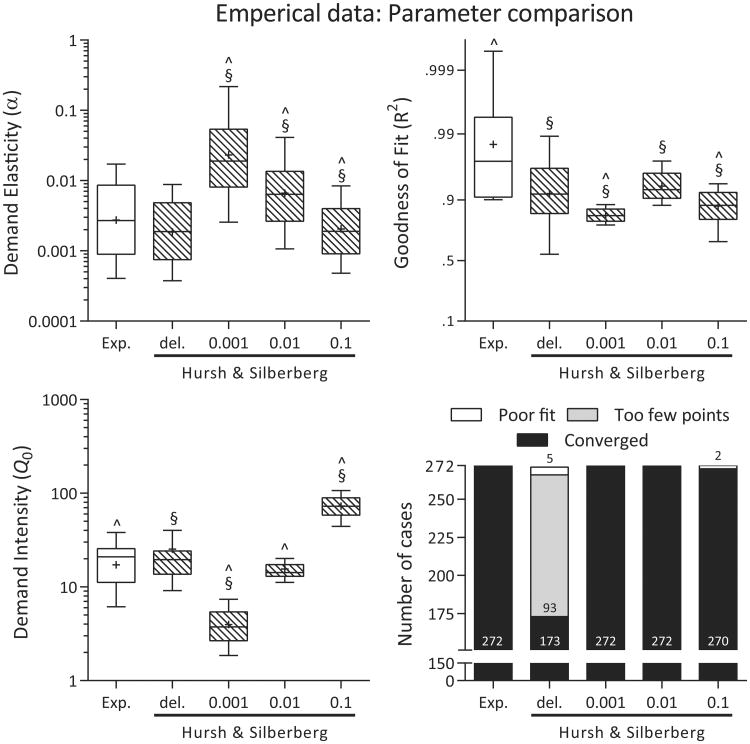
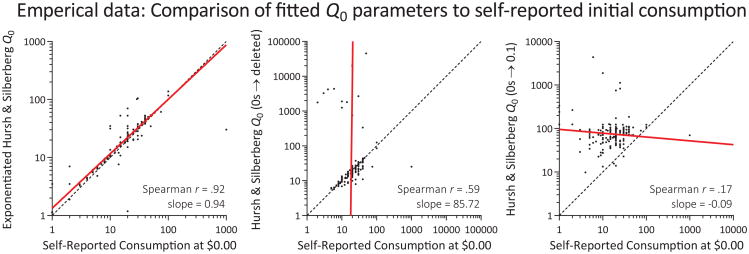
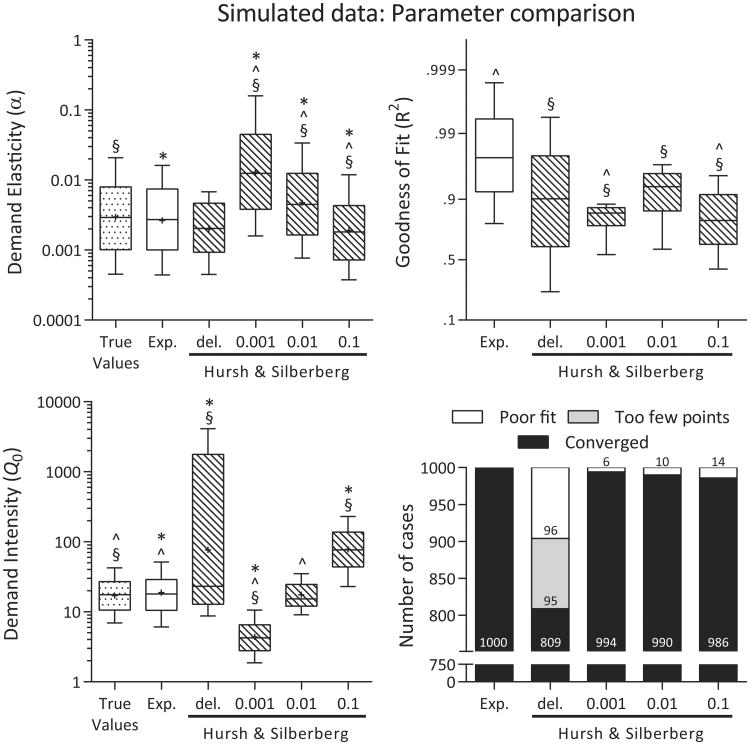
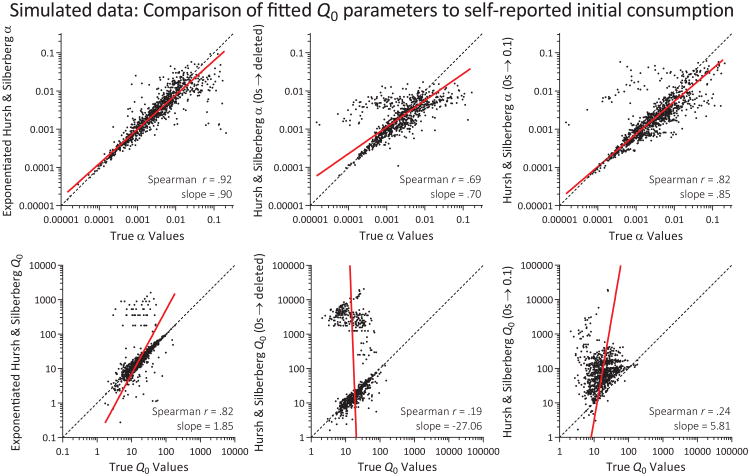
Behavioral economic demand analyses that quantify the relationship between the consumption of a commodity and its price have proven useful in studying the reinforcing efficacy of many commodities, including drugs of abuse. An exponential equation proposed by Hursh and Silberberg (2008) has proven useful in quantifying the dissociable components of demand intensity and demand elasticity, but is limited as an analysis technique by the inability to correctly analyze consumption values of zero. We examined an exponentiated version of this equation that retains all the beneficial features of the original Hursh and Silberberg equation, but can accommodate consumption values of zero and improves its fit to the data. In Experiment 1, we compared the modified equation with the unmodified equation under different treatments of zero values in cigarette consumption data collected online from 272 participants. We found that the unmodified equation produces different results depending on how zeros are treated, while the exponentiated version incorporates zeros into the analysis, accounts for more variance, and is better able to estimate actual unconstrained consumption as reported by participants. In Experiment 2, we simulated 1,000 datasets with demand parameters known a priori and compared the equation fits. Results indicated that the exponentiated equation was better able to replicate the true values from which the test data were simulated. We conclude that an exponentiated version of the Hursh and Silberberg equation provides better fits to the data, is able to fit all consumption values including zero, and more accurately produces true parameter values.


Figures

Figure 1
Figure 1
Hypothetical data illustrating the advantage of exponentiating the Hursh and Silberberg equation. Due to the necessary step of log-transforming consumption data when using the Hursh and Silberberg equation, consumption values of zero cannot be fit as-is. Depending on how these zeros are treated, very different curve fits result (top panel). The exponentiated equation uses non-transformed consumption values and can incorporate consumption values of zero without issue and is also less sensitive to small differences in consumption at high prices (bottom panel). Note that the x axes and the y axis of the top panel are on a log10 scale while the y axis of the bottom panel is a linear scale.
Figure 2
Figure 2
Comparison of best-fit α (top left) and Q0 (bottom left) parameter values on log10 scales for the empirical consumption data from the exponentiated equation and the Hursh and Silberberg equation with zeros either deleted or replaced by 0.001, 0.01, or 0.1. Goodness of fit R2 values (top right, logit scale) and the number of cases fit by each equation version (bottom right) are also shown. The bars in the box and whisker plots are at the median, the boxes extend to the 25th and 75th percentiles, the whiskers extend to the 10th and 90th percentiles, and the + sign indicates the mean. Note: ∧ Significantly different from the Hursh & Silberberg with zeros deleted condition. §Significantly different from the exponentiated equation. Exp. = Exponentiated equation. del. = deleted.
Figure 3
Figure 3
Correlations between self-reported consumption if the price were free and the derived consumption when free (Q0) from the exponentiated equation (left), Hursh and Silberberg equation with zeros deleted (center), and Hursh and Silberberg equation with each zero replaced by 0.1 (right). The exponentiated equation was most accurate at estimated the self-reported initial consumption. Note the log-log axes.
Figure 4
Figure 4
Comparison of the true values from the simulation runs to the best-fit α (top left) and Q0 (bottom left) parameter values on log10 scales for the simulated consumption data from the exponentiated equation and the Hursh and Silberberg equation with zeros either deleted or replaced by 0.001, 0.01, or 0.1. Goodness of fit R2 values (top right, logit scale) and the number of cases fit by each equation version (bottom right) are also shown for the fitted parameter estimates. The bars in the box and whisker plots are at the median, the boxes extend to the 25th and 75th percentiles, the whiskers extend to the 10th and 90th percentiles, and the + indicates the mean. Note: * Significantly different from the true values. ∧ Significantly different from the Hursh & Silberberg with zeros deleted condition. §Significantly different from the exponentiated equation. Exp. = Exponentiated equation. del. = deleted.
Figure 5
Figure 5
Correlations between the true α (top panels) and Q0 (bottom panels) parameter values from the simulation runs and the best-fit parameter values for the exponentiated equation (left panels), Hursh and Silberberg equation with zeros deleted (center panels), and Hursh and Silberberg equation with each zero replaced by 0.1 (right panels). The exponentiated equation was most accurate at estimating the true values. Note the log-log axes.

References

    1. Bickel WK, Johnson MW, Koffarnus MN, MacKillop J, Murphy JG. The behavioral economics of substance abuse disorders: Reinforcement pathologies and their repair. Annual Review of Clinical Psychology. 2014;10(1):641–677. doi: 10.1146/annurev-clinpsy-032813-153724. - DOI - PMC - PubMed
    1. Cohen J. A power primer. Psychological Bulletin. 1992;112(1):155–159. - PubMed
    1. Deming WE. Statistical Adjustment of Data. Vol. 1985 Wiley, NY: Dover Publications edition; 1943.
    1. Galuska CM, Banna KM, Willse LV, Yahyavi-Firouz-Abadi N, See RE. A comparison of economic demand and conditioned-cued reinstatement of methamphetamine-seeking or food-seeking in rats. Behavioural Pharmacology. 2011;22(4):312–323. doi: 10.1097/Fbp.0b013e3283473be4. - DOI - PMC - PubMed
    1. Hursh SR, Roma PG. Behavioral Economics and Empirical Public Policy. Journal of the Experimental Analysis of Behavior. 2013;99(1):98–124. doi: 10.1002/Jeab.7. - DOI - PubMed

Publication types