. 2015 Aug 17;10(8):e0134477.
doi: 10.1371/journal.pone.0134477. eCollection 2015.

Mathematical Model of Ammonia Handling in the Rat Renal Medulla

Affiliations

Mathematical Model of Ammonia Handling in the Rat Renal Medulla

Lorette Noiret et al. PLoS One. .

Abstract

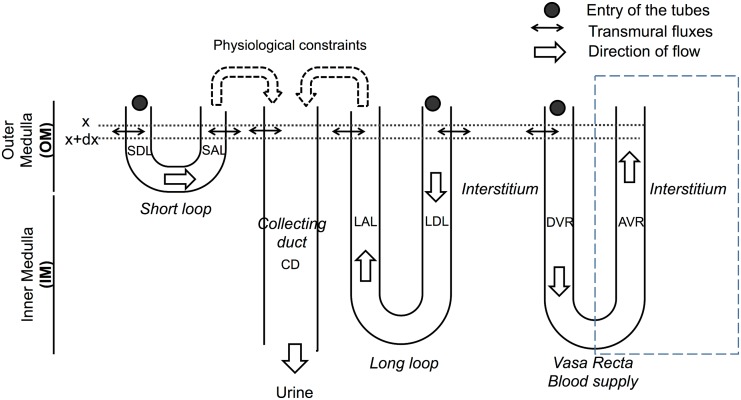
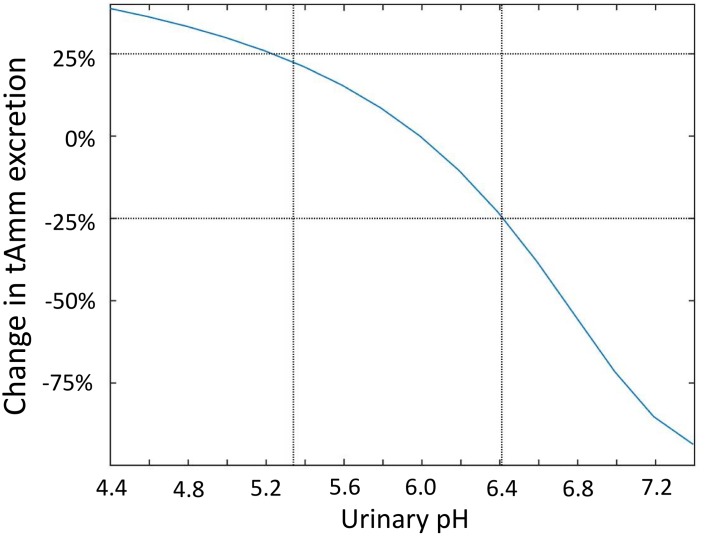
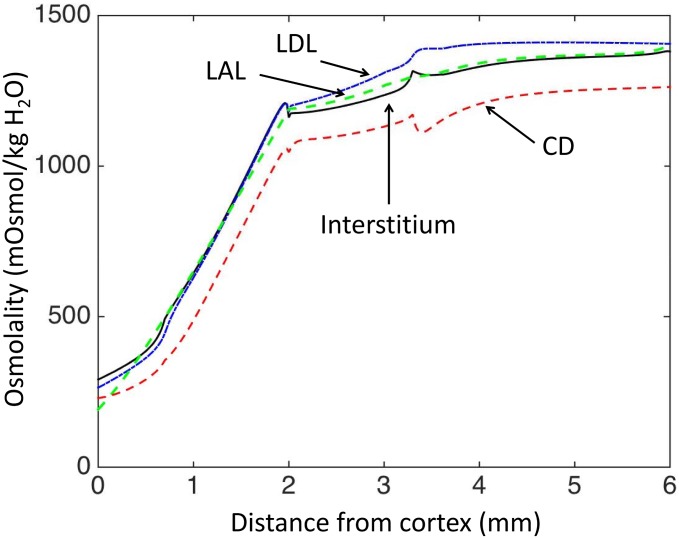
The kidney is one of the main organs that produces ammonia and release it into the circulation. Under normal conditions, between 30 and 50% of the ammonia produced in the kidney is excreted in the urine, the rest being absorbed into the systemic circulation via the renal vein. In acidosis and in some pathological conditions, the proportion of urinary excretion can increase to 70% of the ammonia produced in the kidney. Mechanisms regulating the balance between urinary excretion and renal vein release are not fully understood. We developed a mathematical model that reflects current thinking about renal ammonia handling in order to investigate the role of each tubular segment and identify some of the components which might control this balance. The model treats the movements of water, sodium chloride, urea, NH3 and [Formula: see text], and non-reabsorbable solute in an idealized renal medulla of the rat at steady state. A parameter study was performed to identify the transport parameters and microenvironmental conditions that most affect the rate of urinary ammonia excretion. Our results suggest that urinary ammonia excretion is mainly determined by those parameters that affect ammonia recycling in the loops of Henle. In particular, our results suggest a critical role for interstitial pH in the outer medulla and for luminal pH along the inner medullary collecting ducts.


Conflict of interest statement

Competing Interests: The authors have declared that no competing interests exist.

Figures

Fig 1
Fig 1. Schematic diagram of the model: medullary structures.
The model distinguishes short and long nephrons. The flows are set at the entry to the descending limbs and vasa recta (solid circles). Flows are then calculated along each tube using the equations for transmural fluxes. Inflow to the collecting ducts (CD) is calculated from the flows leaving the ascending limbs and under some physiological constraints (see [17] and text). The ascending vasa recta (AVR) is lumped with the interstitium. The figure does not depict the virtual shunts within the inner medulla that connect the descending and ascending part of the loops of Henle and vasa recta; these shunts are used to replicate the experimentally observed decrease in the number of tubes within the inner medulla. SDL: short descending limb, SAL: short ascending limb, LAL: long ascending limb (includes the thin ascending limb in the IM and the thick ascending limb in the OM), LDL: long descending limb, DVR: descending vasa recta.
Fig 2
Fig 2. Model results: osmolality gradients (mOsm/KgH2O).
The osmolality increases in the inner medulla thanks to our introduction of interstitial external osmoles as a surrogate concentration mechanism in the inner medulla. In our model, transport parameters are defined for each region (OS, IS, UIM and LIM), and therefore small discontinuities can be observed around the junctions of the regions.
Fig 3
Fig 3. Simulated total ammonia concentrations compared to micropuncture measurements (values in italics) [, , –20].
The baseline scenario is consistent with experimental measurements.
Fig 4
Fig 4. Model results: (A-B) NH4+ and NH3 concentration profiles.
In the outer medulla, passive diffusion gradients favor secretion of NH3 into nephron segments and reabsorption of NH4+. (C-D) NH4+ and NH3 transmural fluxes profiles. Positive fluxes denote absorption, whereas negative fluxes represent secretion. Please note the different scales for total fluxes in the collecting ducts (nmol.min-1mm-1), whereas fluxes are given per tube in nephron segments and blood vessels (pmol.min-1mm-1.tube-1).
Fig 5
Fig 5. Model results: flow of total ammonia (tAmm) in each structure under baseline conditions.
Ammonia is reabsorbed in OM ascending limb of the loops of Henle (decreased flow), and partly recycled into descending limbs (increased flow) or secreted into the collecting ducts. The increase in ammonia flow in the OM descending limbs is also due to tubular ammonia production. Please note the different scale for total flow in the collecting ducts, whereas flows are given per tube in nephron segments and blood vessels.
Fig 6
Fig 6. Parameter study.
%changes in total ammonia flows resulting from multiplying each baseline parameter by 5: A) changes at the papillary tip of long loops, B) changes at the tip of short loops (outer-inner medullary junction), C) changes in total ammonia secretion into the collecting ducts, D) changes in urinary excretion. Parameters associated with ammonia recycling in the loops of Henle (especially of short nephrons, see B) are associated with the largest increase in urinary ammonia flow (D). The figure only shows the parameters that affect urinary ammonia excretion by at least 10%. VmaxAL: maximum rate of active transport of NH4+ in thick ascending limbs; PNH3DLOS / PNH3ALIS / PNH3CSIS NH3 permeability of outer stripe descending limbs/ inner stripe ascending limbs/ inner stripe collecting ducts; PNH4+DVRIS NH4+ permeability in descending vasa recta of the inner stripe.
Fig 7
Fig 7. Inhibition of NH3 secretion in the DL OM (permeability PNH3DL OM=0) prevents ammonia recycling in the loops of Henle, which limits urinary ammonia excretion.
The effect is more potent when ammonia reabsorption in the MTAL is increased (maximum rate of active transport VmaxNH4+AL×5).
Fig 8
Fig 8. Impact of pH environment on urinary excretion of ammonia.
The figure shows the percentage change in ammonia excretion rate and the urinary total ammonia concentration when the pH at the top of the interstitium is varied (thus changing the medullary pH profile).
Fig 9
Fig 9. Impact of urinary pH on urinary excretion of ammonia.
The figure shows the percentage change in ammonia excretion rate when the pH at the exit of the collecting ducts is varied.
Fig 10
Fig 10. Model results (alternative baseline scenario): osmolality gradients (mOsm/KgH2O) obtained when the segments of the descending limbs are assumed to be water impermeable.

Similar articles

Cited by

References

    1. Dejong CH, Deutz NE, Soeters PB. Intestinal glutamine and ammonia metabolism during chronic hyperammonaemia induced by liver insufficiency. Gut. 1993. August;34(8):1112–1119. Available from: 10.1136/gut.34.8.1112. - DOI - PMC - PubMed
    1. Tizianello A, Garibotto G, Robaudo C, Saffioti S, Pontremoli R, Bruzzone M, et al. Renal ammoniagenesis in humans with chronic potassium depletion. Kidney International. 1991. October;40(4):772–778. 10.1038/ki.1991.274 - DOI - PubMed
    1. Tizianello A, Deferrari G, Garibotto G, Robaudo C, Bruzzone M, Passerone GC. Renal ammoniagenesis during the adaptation to metabolic acidosis in man. Contributions to nephrology. 1982;31:40–46. 10.1159/000406614 - DOI - PubMed
    1. Tizianello A, De Ferrari G, Garibotto G, Gurreri G, Robaudo C. Renal metabolism of amino acids and ammonia in subjects with normal renal function and in patients with chronic renal insufficiency. The Journal of Clinical Investigation. 1980. May;65(5):1162–1173. 10.1172/JCI109771 - DOI - PMC - PubMed
    1. Garibotto G, Verzola D, Sofia A, Saffioti S, Menesi F, Vigo E, et al. Mechanisms of renal ammonia production and protein turnover. Metabolic brain disease. 2009. March;24(1):159–167. 10.1007/s11011-008-9121-6 - DOI - PubMed

Publication types

LinkOut - more resources