

Effects of preoperative and intraoperative glucose administration on glucose use and fat catabolism during laparotomy under sevoflurane anesthesia in fasted rats
- PMID: 26280893
- PMCID: PMC10717368
- DOI: 10.1007/s12576-015-0390-7
Effects of preoperative and intraoperative glucose administration on glucose use and fat catabolism during laparotomy under sevoflurane anesthesia in fasted rats
Erratum in
-
Erratum to: Effects of preoperative and intraoperative glucose administration on glucose use and fat catabolism during laparotomy under sevoflurane anesthesia in fasted rats.J Physiol Sci. 2015 Nov;65(6):531. doi: 10.1007/s12576-015-0406-3. J Physiol Sci. 2015. PMID: 26449358 Free PMC article. No abstract available.
Abstract
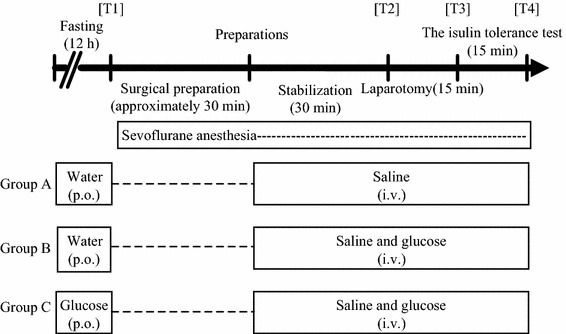
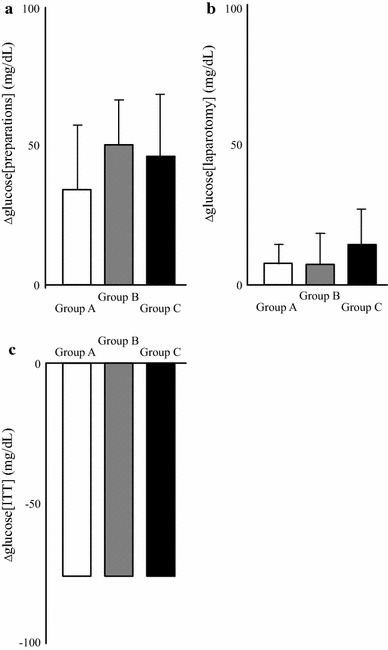
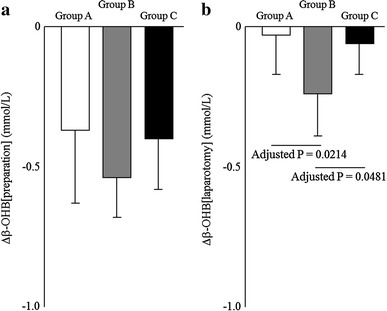
Preoperative fasting as well as surgical stress significantly modifies metabolisms. Recent studies reported the possible advantageous effects of glucose administration on perioperative metabolisms; however, the underlying mechanisms have not been fully elucidated. Rats were allocated to three groups. During the fasting period, groups A and B were administered water, but group C was administered glucose. During laparotomy and the insulin tolerance test (ITT) under sevoflurane anesthesia, group A was administered saline, but groups B and C were administered glucose. During laparotomy, group C showed higher glucose levels and lower β-hydroxybutyrate (β-OHB) levels than group A, and group B showed more decreases in β-OHB levels than group A without differences in changes in glucose levels. Insulin levels and insulin sensitivity during laparotomy were similar among the three groups. No significant difference in insulin sensitivity was also confirmed in ITT. In conclusion, perioperative glucose administration suppresses lipolysis without affecting insulin secretion and sensitivity.
Keywords: Adipocytokine; Insulin secretion; Insulin sensitivity; Intraoperative glycemic control; β-Hydroxybutyrate.
Conflict of interest statement
There is no conflict to disclose.
Figures
Similar articles
-
Glucose use in fasted rats under sevoflurane anesthesia and propofol anesthesia.Anesth Analg. 2013 Sep;117(3):627-633. doi: 10.1213/ANE.0b013e31829e4028. Epub 2013 Jul 18. Anesth Analg. 2013. PMID: 23868888
-
The involvement of adenosine triphosphate-sensitive potassium channels in the different effects of sevoflurane and propofol on glucose metabolism in fed rats.Anesth Analg. 2012 Jan;114(1):110-6. doi: 10.1213/ANE.0b013e3182373552. Epub 2011 Nov 29. Anesth Analg. 2012. PMID: 22127813
-
Comparison of mechanisms underlying changes in glucose utilization in fasted rats anesthetized with propofol or sevoflurane: Hyperinsulinemia is exaggerated by propofol with concomitant insulin resistance induced by an acute lipid load.Biosci Trends. 2014 Jun;8(3):155-62. doi: 10.5582/bst.2014.01060. Biosci Trends. 2014. PMID: 25030850
-
Effect of Intraoperative Glucose Infusion on Catabolism of Adipose Tissue and Muscle Protein in Patients Anesthetized With Remifentanil in Combination With Sevoflurane During Major Surgery: A Randomized Controlled Multicenter Trial.Anesth Analg. 2016 Oct;123(4):869-76. doi: 10.1213/ANE.0000000000001522. Anesth Analg. 2016. PMID: 27529317 Clinical Trial.
-
The effects of sevoflurane anesthesia on insulin secretion and glucose metabolism in pigs.Anesth Analg. 1997 Jun;84(6):1359-65. doi: 10.1097/00000539-199706000-00034. Anesth Analg. 1997. PMID: 9174321
Cited by
-
Effects of preoperative oral carbohydrate intake on catabolism, nutrition and adipocytokines during minor surgery: A randomized, prospective, controlled clinical phase II trial.PLoS One. 2019 May 13;14(5):e0216525. doi: 10.1371/journal.pone.0216525. eCollection 2019. PLoS One. 2019. PMID: 31083704 Free PMC article. Clinical Trial.
References
-
- Exton JH, Corbin JG, Harper SC. Control of gluconeogenesis in liver. J Biol Chem. 1972;247:4996–5003. - PubMed
-
- Soop N, Nygren J, Myrenfors P, Thorell A, Ljungqvist O. Preoperative oral carbohydrate treatment attenuates immediate postoperative insulin resistance. Am J Physiol Endocrinol Metab. 2001;280:E576–E583. - PubMed
Publication types
MeSH terms
Substances
LinkOut - more resources
Full Text Sources
