Review
. 2015 Nov;104(11):3612-3638.
doi: 10.1002/jps.24594. Epub 2015 Aug 17.

The Future of Pharmaceutical Manufacturing Sciences

Affiliations
Review

The Future of Pharmaceutical Manufacturing Sciences

Jukka Rantanen et al. J Pharm Sci. 2015 Nov.

Abstract

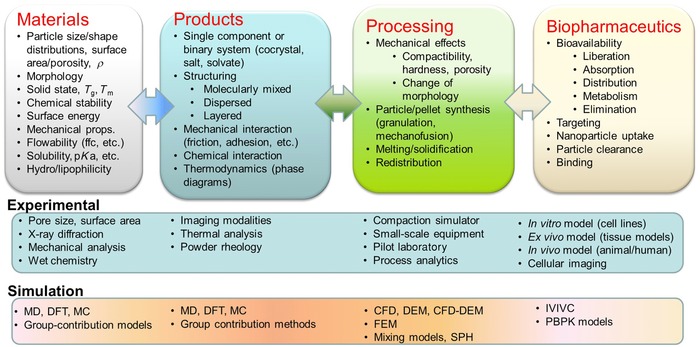
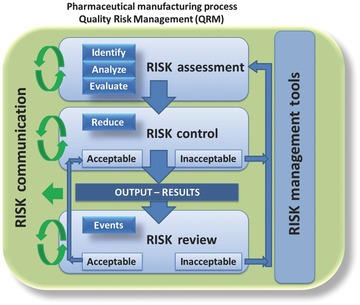
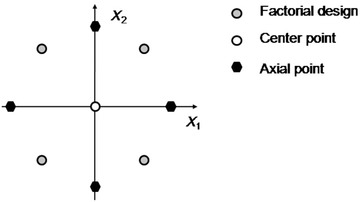
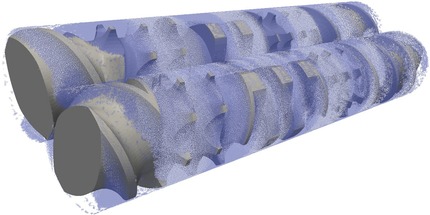
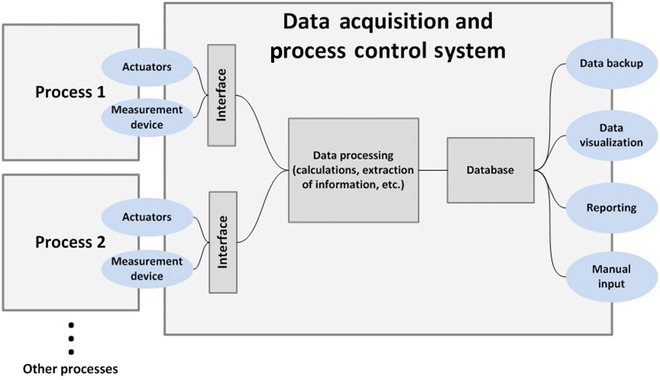
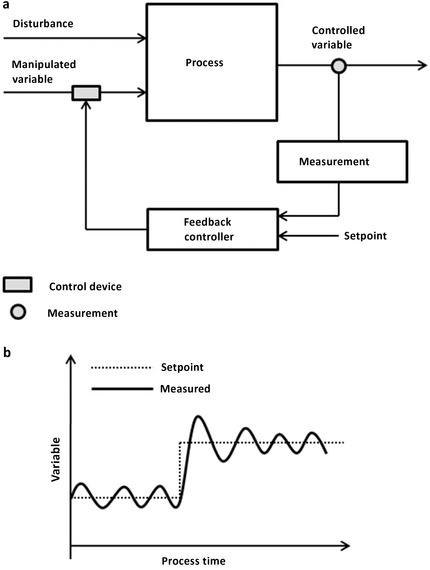
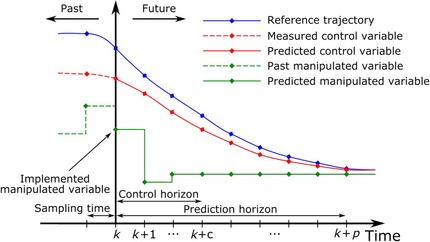
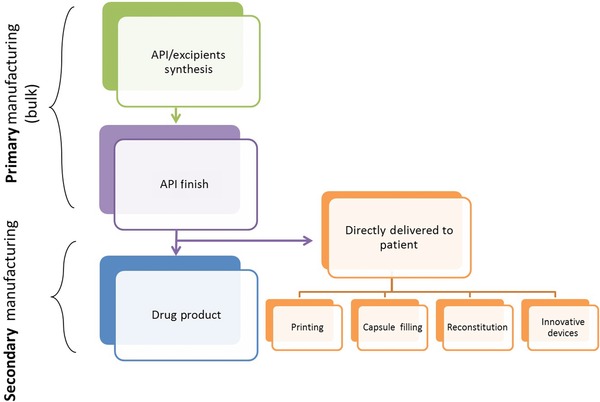
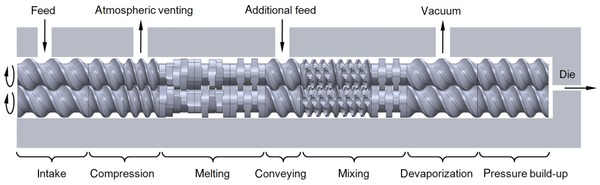
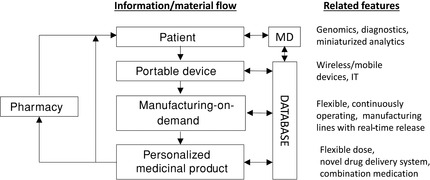
The entire pharmaceutical sector is in an urgent need of both innovative technological solutions and fundamental scientific work, enabling the production of highly engineered drug products. Commercial-scale manufacturing of complex drug delivery systems (DDSs) using the existing technologies is challenging. This review covers important elements of manufacturing sciences, beginning with risk management strategies and design of experiments (DoE) techniques. Experimental techniques should, where possible, be supported by computational approaches. With that regard, state-of-art mechanistic process modeling techniques are described in detail. Implementation of materials science tools paves the way to molecular-based processing of future DDSs. A snapshot of some of the existing tools is presented. Additionally, general engineering principles are discussed covering process measurement and process control solutions. Last part of the review addresses future manufacturing solutions, covering continuous processing and, specifically, hot-melt processing and printing-based technologies. Finally, challenges related to implementing these technologies as a part of future health care systems are discussed.

Keywords: in silico modeling; materials science; mathematical model; process analytical technology (PAT); quality by design (QBD).


Figures

Figure 1
Figure 1
Engineering view of pharmaceutical development (MD, molecular dynamics; DFT, density functional theory computations; MC, Monte Carlo methods; CFD, computational fluid dynamics; DEM, discrete element method; FEM, finite element method; SPH, smoothed particle hydrodynamics; IVIVC, in vitro–in vivo correlations; PBPK, physiologically based pharmacokinetics).
Figure 2
Figure 2
Overview of a pharmaceutical quality risk management (QRM) system.
Figure 3
Figure 3
Constructing central composite design (CCD) for two variables.
Figure 4
Figure 4
Snapshot of a 3D free‐surface flow in a co‐rotating twin‐screw extruder via smoothed particle hydrodynamics (SPH). The image shows two fully filled intermeshing screws with conveying and mixing elements. The polymer melt is shown as blue and white particles with identical properties, representing the flow. Energy dissipation, flow rate, power consumption, mixing performance, and pressure characteristics can be determined from the simulations.
Figure 5
Figure 5
Direct numerical simulation (DNS) of a swarm of fully deformable reacting bubbles, including mass transfer. Reynolds number = 38, Schmidt number = 50. The figure shows the concentration field of gas transferred from bubbles into the gas phase. The complex concentration distribution (striations) in the liquid phase can be seen.
Figure 6
Figure 6
Comparison of experiments and DEM simulations of a powder blending process of cohesionless particles.95 In both experiments and simulations, a four‐bladed powder mixer was filled with identical 2 mm Dragonite® glass spheres. One half of the bed was colored red and the particle mixing process was followed for several rotations of the stirred. A good agreement between experiments and DEM simulations was observed.
Figure 7
Figure 7
DEM simulation of a tablet coating process, including the coating spray. The spray droplets are colored blue, with darker shades indicating bigger droplets. The tablets are colored according to coating mass, from white (no coating mass) to red (high coating mass). For more details of the simulation setup, refer to Toschkoff and Khinast.114
Figure 8
Figure 8
CFD–DEM of a fluid bed process involving 25 million particles. The fine structure of particle clusters (streamers) can be observed. For details regarding the simulation setup refer to Jajcevic et al.155
Figure 9
Figure 9
Nanoindentation with atomic force microscope (AFM) helping to identify a weak crystallographic direction in the crystal.203 Reproduced with permission of The Royal Society of Chemistry.
Figure 10
Figure 10
Small‐scale formulation screening platform for estimating the role of secondary manufacturing operations on solid form stability.223 Reprinted with permission from Elsevier.
Figure 11
Figure 11
Schematic illustration of various modes of process analysis. Modified from Ref. 5.
Figure 12
Figure 12
Various levels of control strategies. Adapted from Ref. 269.
Figure 13
Figure 13
Schematic structure of an automation system (adapted from Ref. 270). The data obtained from the measurement devices are collected and processed in a data acquisition and process control system. The resulting controller action is implemented in the process through suitable actuators. Process data are stored in a comprehensive database for quality assurance and regulatory purposes.
Figure 14
Figure 14
(a) Schematic structure of a feedback control loop. The deviation between the controlled variable and the specified set point is used to trigger and actuator action, adjusting the associated manipulated variable and compensating for the occurring disturbances. (b) Exemplary control action resulting in an overshoot reaction and oscillatory behavior during the set point changes.
Figure 15
Figure 15
Schematic structure of a MPC approach (adapted from Ref. 265). Past measurements of control variables and prior implemented actuator values are used to predict the future behavior of the system.
Figure 16
Figure 16
General overview of a continuous manufacturing process, from primary manufacturing (API synthesis, purification, and finish) to secondary manufacturing. It is also possible to make individualized products directly for the patient in a continuous manner.
Figure 17
Figure 17
Schematic structure of a co‐rotating, intermeshing twin‐screw extruder.
Figure 18
Figure 18
Elements of the future healthcare system.

Similar articles

Cited by

References

    1. Yu L. 2008. Pharmaceutical quality by design: Product and process development, understanding, and control. Pharm Res 25(4):781–791. - PubMed
    1. Rathore AS, Winkle H. 2009. Quality by design for biopharmaceuticals. Nat Biotechnol 27(1):26–34. - PubMed
    1. Oksanen CA, Muñoz S García. 2010. Process modeling and control in drug development and manufacturing. Comput Chem Eng 34(7):1007–1008.
    1. Reklaitis GV, Khinast J, Muzzio F. 2010. Pharmaceutical engineering science—New approaches to pharmaceutical development and manufacturing. Chem Eng Sci 65(21):iv–vii.
    1. Callis JB, Illman DL, Kowalski BR. 1987. Process analytical chemistry. Anal Chem 59(9):624A–637A.

MeSH terms