. 2015 Aug 18:6:8020.
doi: 10.1038/ncomms9020.

Experimental colitis in SIV-uninfected rhesus macaques recapitulates important features of pathogenic SIV infection

Affiliations

Experimental colitis in SIV-uninfected rhesus macaques recapitulates important features of pathogenic SIV infection

Xing Pei Hao et al. Nat Commun. .

Abstract

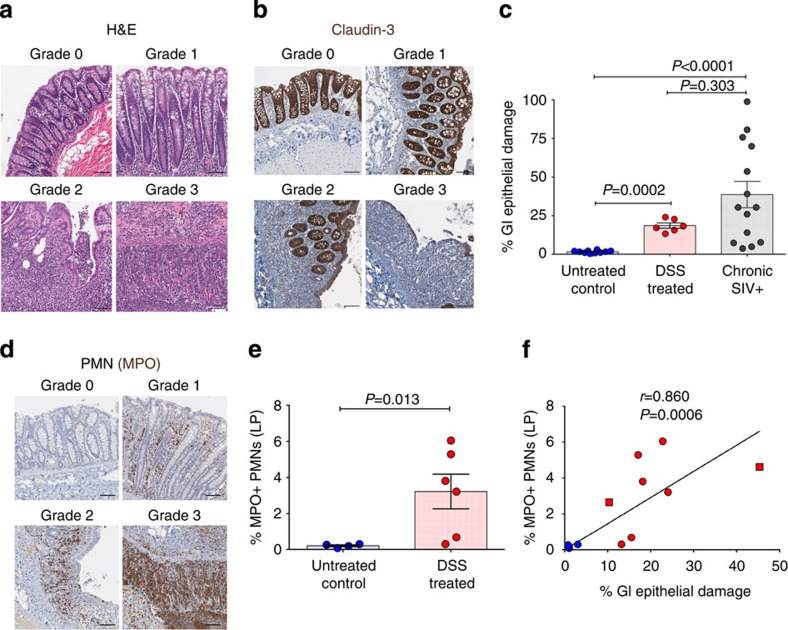
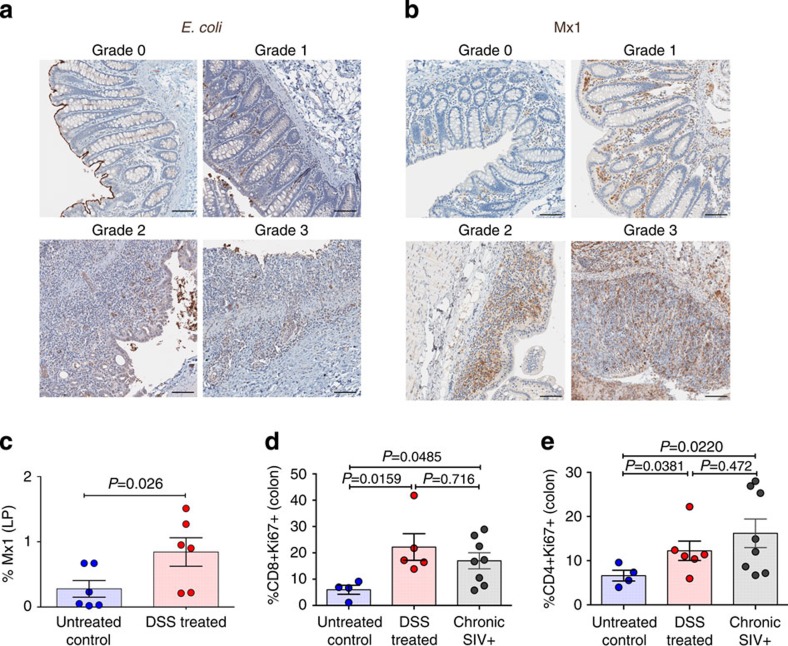
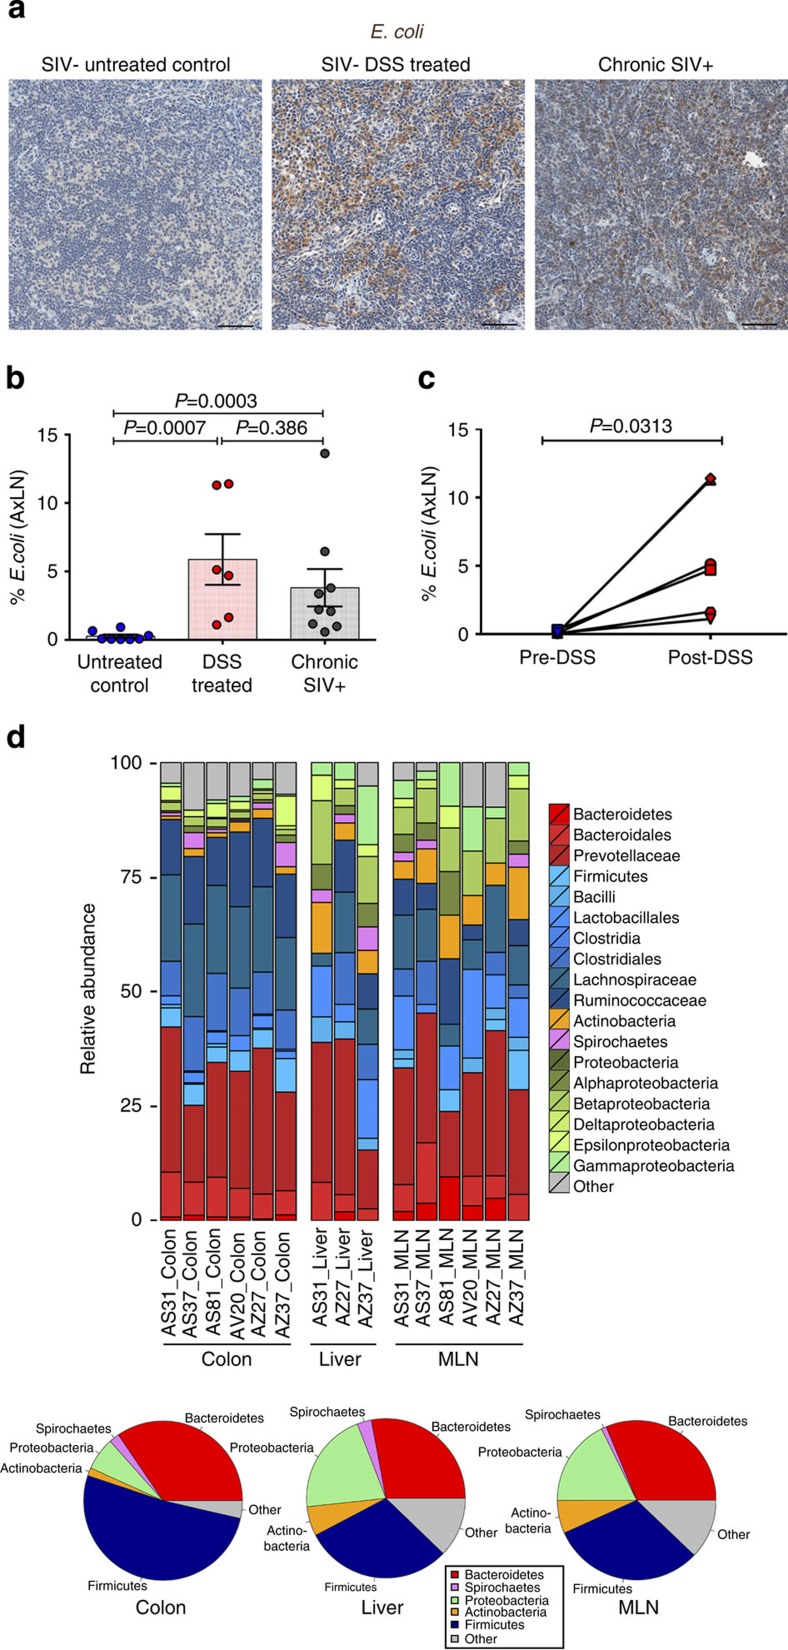
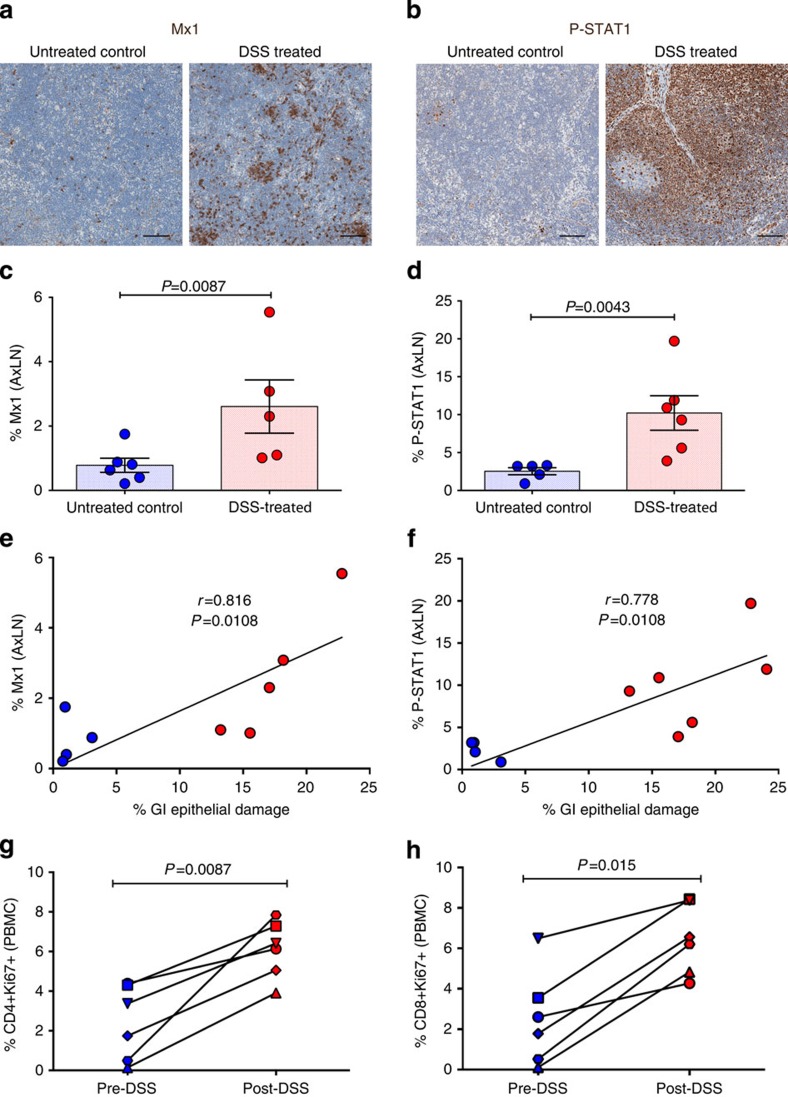
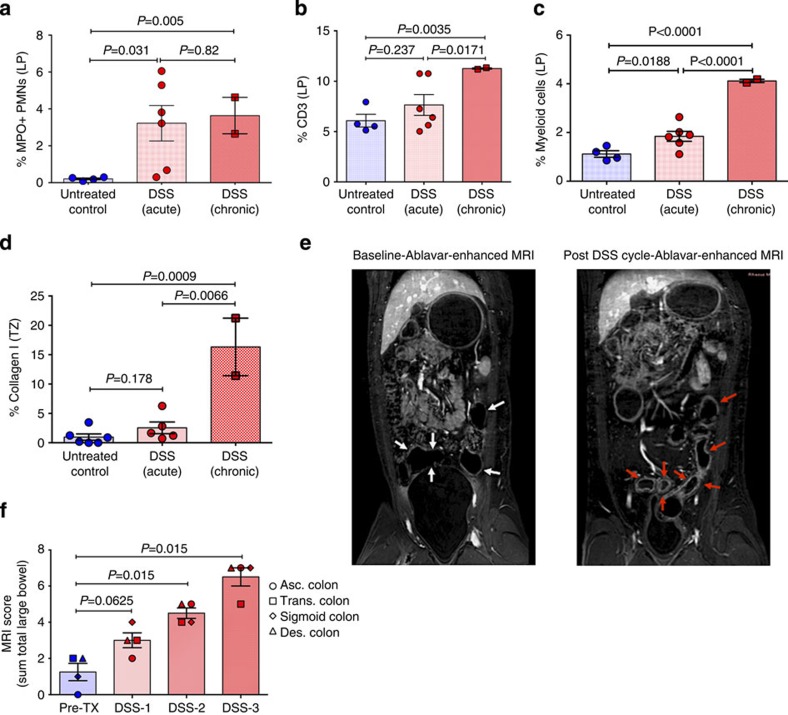
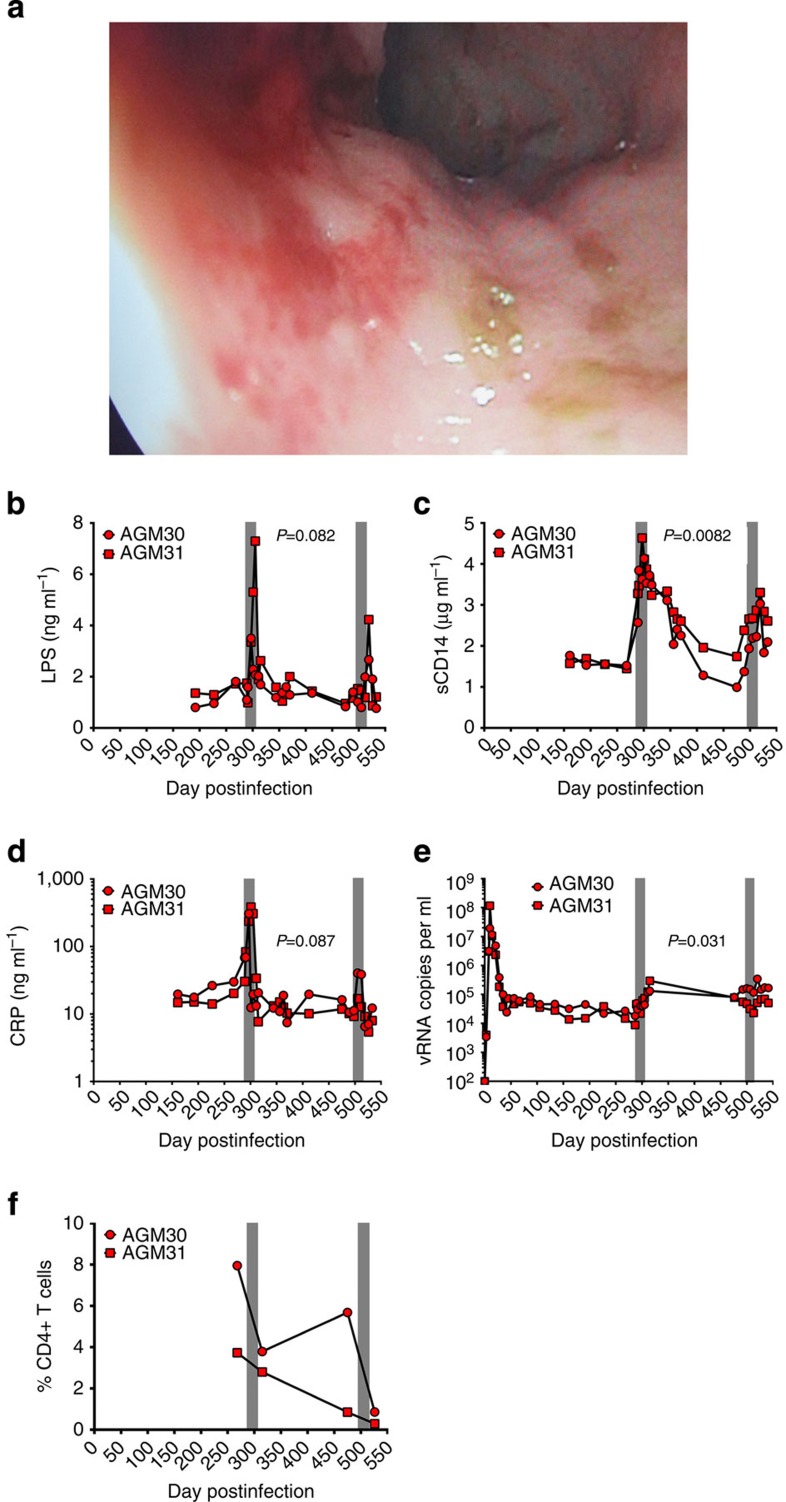
Mucosal damage to the gastrointestinal (GI) tract with resulting microbial translocation is hypothesized to significantly contribute to the heightened and persistent chronic inflammation and immune activation characteristic to HIV infection. Here we employ a non-human primate model of chemically induced colitis in SIV-uninfected rhesus macaques that we developed using dextran sulfate sodium (DSS), to directly test this hypothesis. DSS treatment results in GI barrier damage with associated microbial translocation, inflammation and immune activation. The progression and severity of colitis are longitudinally monitored by a magnetic resonance imaging approach. DSS treatment of SIV-infected African green monkeys, a natural host species for SIV that does not manifest GI tract damage or chronic immune activation during infection, results in colitis with elevated levels of plasma SIV RNA, sCD14, LPS, CRP and mucosal CD4+ T-cell loss. Together these results support the hypothesis that GI tract damage leading to local and systemic microbial translocation, and associated immune activation, are important determinants of AIDS pathogenesis.


Figures

Figure 1
Figure 1. Extent and type of GI tract pathology induced by DSS treatment.
(a) Representative colon haematoxylin and eosin images showing normal grade 0 (untreated control RM) and grade 1–3 (DSS-treated RM) colitis. (b) Representative images of claudin-3-stained colon showing normal grade 0 (untreated control RM) and grade 1–3 (DSS-treated RM) lesions. Notice the strong claudin-3 expression in the colonic epithelium from grade 0 and grade 1, with reduced and absent claudin-3 expression in grade 2 and 3 lesions, respectively. (c) Quantification of the percentage of the colon linear length that is damaged (that is, claudin-3 negative). (d) Representative images of MPO-stained colon showing the lack of PMN infiltration in normal grade 0 (untreated control RM) colon and the increased PMN infiltrate in grade 1–3 (DSS-treated RM) lesions. (e) Quantification of the percent area of the colon (all segments) that is occupied by MPO+ PMNs. (f) Direct positive correlation between the extent of GI tract epithelial damage and the magnitude of PMN infiltration into the colon (all segments). Lines are based on linear regression and r and P values are based on Spearman rank correlation coefficient. P values are based on the Mann–Whitney test (c,e). Untreated control RMs (blue circles) n=4 (e,f) to 10 (c), acute DSS-treated RMs (red circles) n=6, chronic DSS-treated RMs (red squares) n=2, and chronic SIV+ RMs (grey circles) n=14. Bar graphs show group means ±s.e.m. with individual animal data points shown. Scale bars=100 μm.
Figure 2
Figure 2. Effect of DSS-induced GI tract damage on local microbial translocation and resulting inflammation and immune activation.
(a) Representative images of E. coli-stained colon showing the lack of microbial translocation in normal grade 0 (untreated control RM) colon and increased presence of bacterial products in grade 1–3 (DSS-treated RM) lesions. (b) Representative images of Mx1-stained colon showing limited inflammation in normal grade 0 (untreated control RM) colon and increased inflammation in grade 1–3 (DSS-treated RM) lesions. (c) Quantification of the percent area of the colon lamina propria (LP) positive for Mx1. (d) The proportion of CD8+ T cells in the colon that express the activation/proliferation marker Ki67. (e) The proportion of CD4+ T cells in the colon that express the activation/proliferation marker Ki67. P values are based on the Mann–Whitney test (ce). Untreated control RMs (blue circles) n=4 (d,e) to 6 (c), acute DSS-treated RMs (red circles) n=6, and chronic SIV+ RMs (grey circles) n=8. Bar graphs show group means ±s.e.m. with individual animal data points shown. Scale bars=100 μm.
Figure 3
Figure 3. Effect of DSS-induced GI tract damage on systemic microbial translocation within distal tissues.
(a) Representative images of E. coli-stained AxLN showing the lack of microbial translocation in untreated control RM and increased presence of bacterial products in DSS-treated and chronic SIV+ RMs. (b) Quantification of the percent area of AxLN positive for E. coli. (c) Longitudinal analysis of bacterial products (E. coli) in peripheral LNs pre- and post-DSS treatment. P values are based on the Mann–Whitney test (b) or the Wilcoxon matched pairs test (c). Untreated control RMs (blue circles) n=8, acute DSS-treated RMs (red circles) n=6 and chronic SIV+ RMs (grey circles) n=9. Scale bars=100 μm. (d) Analysis of bacterial communities within the colon and identification of translocating gut flora following DSS treatment analysed for 16S rDNA by 454 pyrosequencing. Bar graphs indicate the relative makeup of the bacterial community in individual animals at each tissue site. Pie charts show the average bacterial community makeup of all animals shown above in colon, liver and MesLN. Analysis of molecular variance with uncorrected pairwise distances calculated from all aligned reads was performed comparing colon and liver (P=0.018), colon and MLN (P<0.001) and liver and MLN (P=0.5). Bar graphs show group means ±s.e.m. with individual animal data points shown.
Figure 4
Figure 4. Effect of DSS-induced GI tract damage on systemic inflammation and immune activation within the distal AxLN.
Representative images of (a) Mx1- and (b) P-STAT1-stained AxLNs showing limited inflammation in untreated control RMs and increased inflammation in DSS-treated RMs. Scale bars = 100 μm. Quantification of the percent area of the AxLN positive for (c) Mx1 and (d) P-STAT1. Direct positive correlation between the extent of GI tract epithelial damage and the magnitude of (e) Mx1 and (f) P-STAT1 expression in AxLNs. Lines are based on linear regression and r and P values are based on Spearman rank correlation coefficient. Longitudinal analysis of (g) CD4+Ki67+ and (h) CD8+Ki67+ in the peripheral blood mononuclear cells (PBMC) pre- and post-DSS treatment. P values are based on the Mann–Whitney test (c,d) or the Wilcoxon matched pairs test (g,h). Untreated control RMs (blue circles) n=4 (eh) to 6 (c,d) and acute DSS-treated RMs (red circles) n=6, with individual shapes representing individual animals (g,h). Bar graphs show group means±s.e.m. with individual animal data points shown.
Figure 5
Figure 5. Features of DSS-induced chronic colitis and noninvasive MRI evaluation.
Quantification of the percent area of the colon (all segments) that is occupied by (a) MPO+ PMNs, (b) CD3+ T cells and (c) CD68/CD163+ myeloid/macrophages in untreated control and DSS-treated acute and chronic colitis RMs. (d) The percent area of the AxLN that is occupied by collagen 1 in untreated control and DSS-treated acute and chronic colitis RMs. (e) Prominent inflammatory changes appear as enhancement with Ablavar (red arrows) in the colon after DSS treatment, as well as evident increased thickness of the colonic wall, stenosis and narrowing of colonic cavity. (f) Summation of the qualitative MRI scoring for each GI tract segment from both RMs showing the progression in the severity of colitis. P values are based on the Mann–Whitney test. Untreated control RMs (blue circles) n=4 (ac) to 6 (d), acute DSS-treated RMs (red circles) n=6, and chronic DSS-treated RMs (red squares) n=2. Bar graphs show group means ±s.e.m. with individual animal data points shown.
Figure 6
Figure 6. Impact of DSS treatment on chronically SIV+ AGMs.
(a) Colonoscopy image showing multifocal mucosa thickening, redness and ulcerations. Longitudinal changes in plasma levels of LPS (b), sCD14 (c), CRP (d) and viral loads (e), and frequency of mucosal CD4+ T cells (f) in SIV+ AGMs (n=2) before and after two DSS treatments (shown by grey bars). P values were derived from repeated measures analysis of variance, linear hierarchical mixed effects models as described in methods section.

Similar articles

Cited by

References

    1. Hazenberg M. D. et al. Persistent immune activation in HIV-1 infection is associated with progression to AIDS. AIDS 17, 1881–1888 (2003). - PubMed
    1. Deeks S. G. et al. Immune activation set point during early HIV infection predicts subsequent CD4+ T-cell changes independent of viral load. Blood 104, 942–947 (2004). - PubMed
    1. Somsouk M. Gut epithelial barrier and systemic inflammation during chronic HIV infection. AIDS 29, 43–51 (2015). - PMC - PubMed
    1. Epple H. J. et al. Impairment of the intestinal barrier is evident in untreated but absent in suppressively treated HIV-infected patients. Gut 58, 220–227 (2009). - PubMed
    1. Epple H. J. et al. Acute HIV infection induces mucosal infiltration with CD4+ and CD8+ T cells, epithelial apoptosis, and a mucosal barrier defect. Gastroenterology 139, 1289–1300 (2010). - PubMed

Publication types

Substances

Associated data