

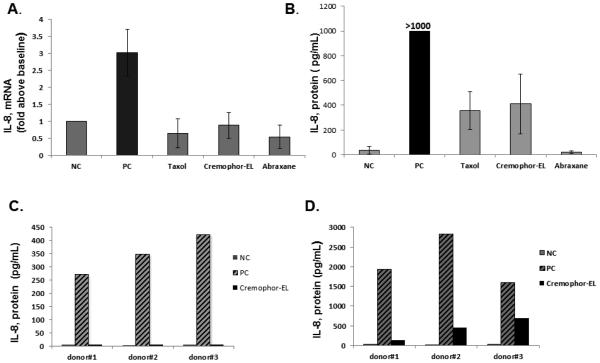
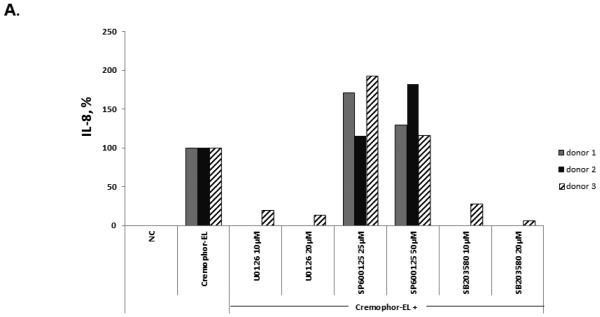
Induction of oxidative stress by Taxol® vehicle Cremophor-EL triggers production of interleukin-8 by peripheral blood mononuclear cells through the mechanism not requiring de novo synthesis of mRNA
- PMID: 26282378
- PMCID: PMC4652134
- DOI: 10.1016/j.nano.2015.07.012
Induction of oxidative stress by Taxol® vehicle Cremophor-EL triggers production of interleukin-8 by peripheral blood mononuclear cells through the mechanism not requiring de novo synthesis of mRNA
Abstract
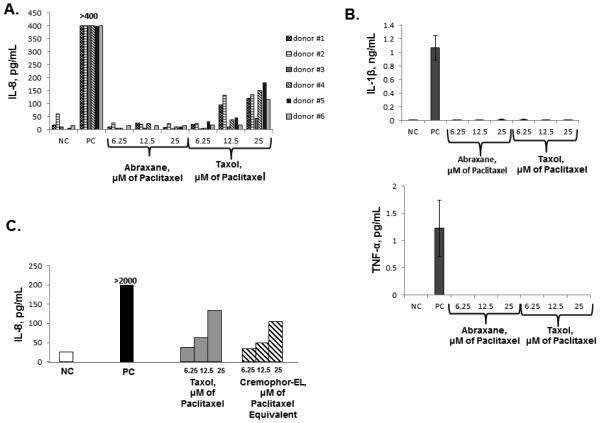
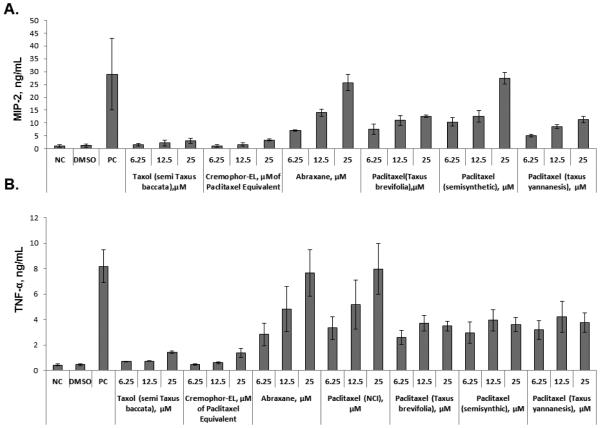
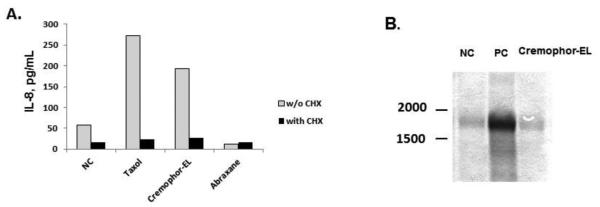
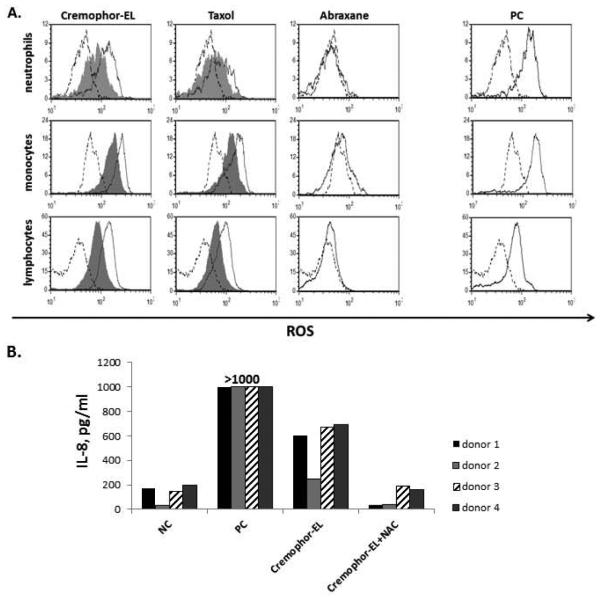
Understanding the ability of cytotoxic oncology drugs, and their carriers and formulation excipients, to induce pro-inflammatory responses is important for establishing safe and efficacious formulations. Literature data about cytokine response induction by the traditional formulation of paclitaxel, Taxol®, are controversial, and no data are available about the pro-inflammatory profile of the nano-albumin formulation of this drug, Abraxane®. Herein, we demonstrate and explain the difference in the cytokine induction profile between Taxol® and Abraxane®, and describe a novel mechanism of cytokine induction by a nanosized excipient, Cremophor EL, which is not unique to Taxol® and is commonly used in the pharmaceutical industry for delivery of a wide variety of small molecular drugs.
From the clinical editor: Advances in nanotechnology have enabled the production of many nano-formulation drugs. The cellular response to drugs has been reported to be different between traditional and nano-formulations. In this article, the authors investigated and compared cytokine response induction profiles between Taxol® and Abraxane®. The findings here provided further understanding to create drugs with better safety profiles.
Keywords: Abraxane®; Cremophor-EL; Cytokines; Immunotoxicity; Interleukin 8; Oxidative stress; Paclitaxel; Taxol®.
Copyright © 2015 Elsevier Inc. All rights reserved.
Figures
References
-
- Nehate C, Jain S, Saneja A, Khare V, Alam N, Dubey R, et al. Paclitaxel Formulations: Challenges and Novel Delivery Options. Curr Drug Deliv. 2014 - PubMed
-
- Gelderblom H, Verweij J, Nooter K, Sparreboom A. Cremophor EL: the drawbacks and advantages of vehicle selection for drug formulation. Eur J Cancer. 2001;37:1590–8. - PubMed
-
- Szebeni J, Muggia FM, Alving CR. Complement activation by Cremophor EL as a possible contributor to hypersensitivity to paclitaxel: an in vitro study. J Natl Cancer Inst. 1998;90:300–6. - PubMed
-
- Gradishar WJ, Tjulandin S, Davidson N, Shaw H, Desai N, Bhar P, et al. Phase III trial of nanoparticle albumin-bound paclitaxel compared with polyethylated castor oil-based paclitaxel in women with breast cancer. J Clin Oncol. 2005;23:7794–803. - PubMed
-
- Dobrovolskaia MA, McNeil SE. In vitro assays for monitoring nanoparticle intreaction with components of the immune system. In: Yarmush ML, Shi D, editors. Handbook of immunological properties of engeenered nanomaterials. World Scientific Publishing; Singapore: 2013. pp. 581–639.
Publication types
MeSH terms
Substances
Grants and funding
LinkOut - more resources
Full Text Sources
Other Literature Sources
