

Sample size calculation for a stepped wedge trial
- PMID: 26282553
- PMCID: PMC4538764
- DOI: 10.1186/s13063-015-0840-9
Sample size calculation for a stepped wedge trial
Abstract
Background: Stepped wedge trials (SWTs) can be considered as a variant of a clustered randomised trial, although in many ways they embed additional complications from the point of view of statistical design and analysis. While the literature is rich for standard parallel or clustered randomised clinical trials (CRTs), it is much less so for SWTs. The specific features of SWTs need to be addressed properly in the sample size calculations to ensure valid estimates of the intervention effect.
Methods: We critically review the available literature on analytical methods to perform sample size and power calculations in a SWT. In particular, we highlight the specific assumptions underlying currently used methods and comment on their validity and potential for extensions. Finally, we propose the use of simulation-based methods to overcome some of the limitations of analytical formulae. We performed a simulation exercise in which we compared simulation-based sample size computations with analytical methods and assessed the impact of varying the basic parameters to the resulting sample size/power, in the case of continuous and binary outcomes and assuming both cross-sectional data and the closed cohort design.
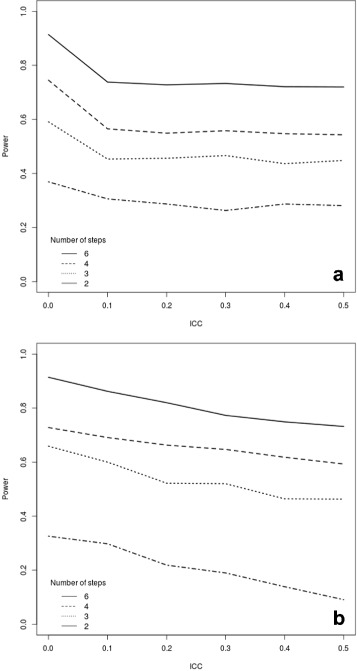
Results: We compared the sample size requirements for a SWT in comparison to CRTs based on comparable number of measurements in each cluster. In line with the existing literature, we found that when the level of correlation within the clusters is relatively high (for example, greater than 0.1), the SWT requires a smaller number of clusters. For low values of the intracluster correlation, the two designs produce more similar requirements in terms of total number of clusters. We validated our simulation-based approach and compared the results of sample size calculations to analytical methods; the simulation-based procedures perform well, producing results that are extremely similar to the analytical methods. We found that usually the SWT is relatively insensitive to variations in the intracluster correlation, and that failure to account for a potential time effect will artificially and grossly overestimate the power of a study.
Conclusions: We provide a framework for handling the sample size and power calculations of a SWT and suggest that simulation-based procedures may be more effective, especially in dealing with the specific features of the study at hand. In selected situations and depending on the level of intracluster correlation and the cluster size, SWTs may be more efficient than comparable CRTs. However, the decision about the design to be implemented will be based on a wide range of considerations, including the cost associated with the number of clusters, number of measurements and the trial duration.
Figures


Comment in
-
Sample size calculations for stepped wedge trials using design effects are only approximate in some circumstances.Trials. 2016 May 4;17(1):234. doi: 10.1186/s13063-016-1359-4. Trials. 2016. PMID: 27146064 Free PMC article.
References
-
- Murray D. The design and analysis of group randomised trials. Oxford, UK: Oxford University Press; 1998.
-
- Donner A, Birkett N, Buck C. Randomization by cluster: sample size requirements and analysis. Am J Epidemiol. 1981;114:906–14. - PubMed
Publication types
MeSH terms
Grants and funding
LinkOut - more resources
Full Text Sources
Other Literature Sources
Medical
