. 2015 Sep;146(3):205-19.
doi: 10.1085/jgp.201511383. Epub 2015 Aug 17.

Constitutive and ghrelin-dependent GHSR1a activation impairs CaV2.1 and CaV2.2 currents in hypothalamic neurons

Affiliations

Constitutive and ghrelin-dependent GHSR1a activation impairs CaV2.1 and CaV2.2 currents in hypothalamic neurons

Eduardo Javier López Soto et al. J Gen Physiol. 2015 Sep.

Abstract

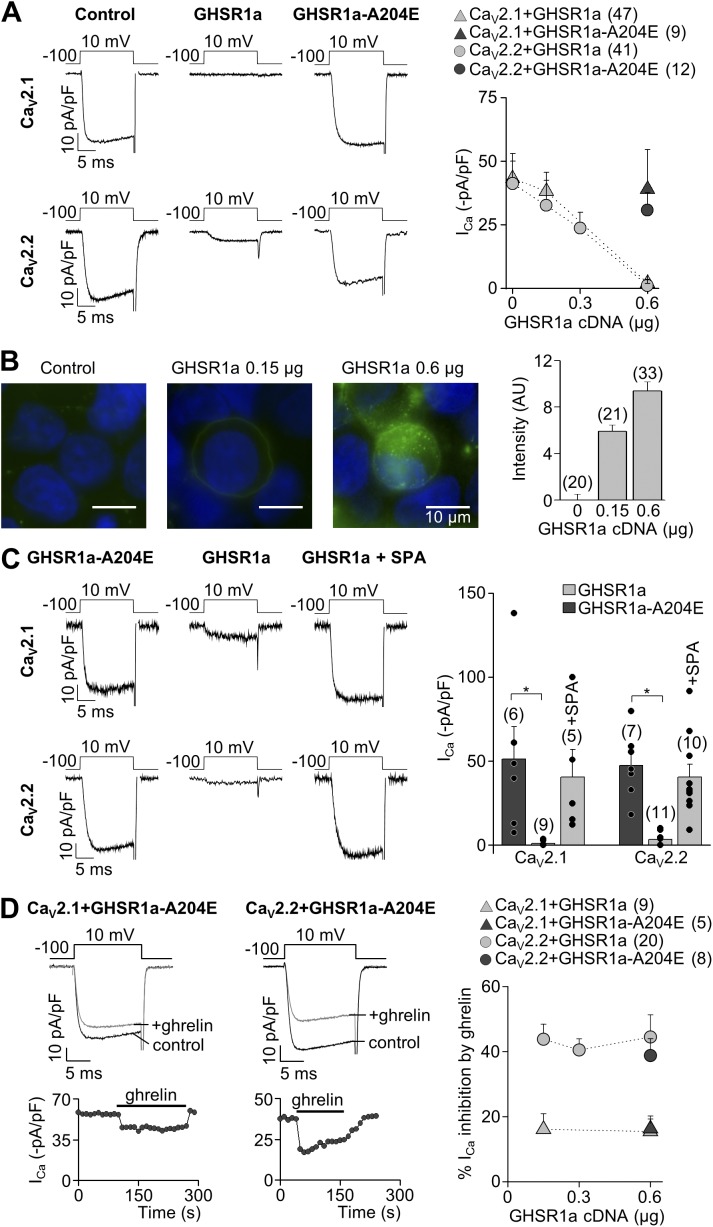
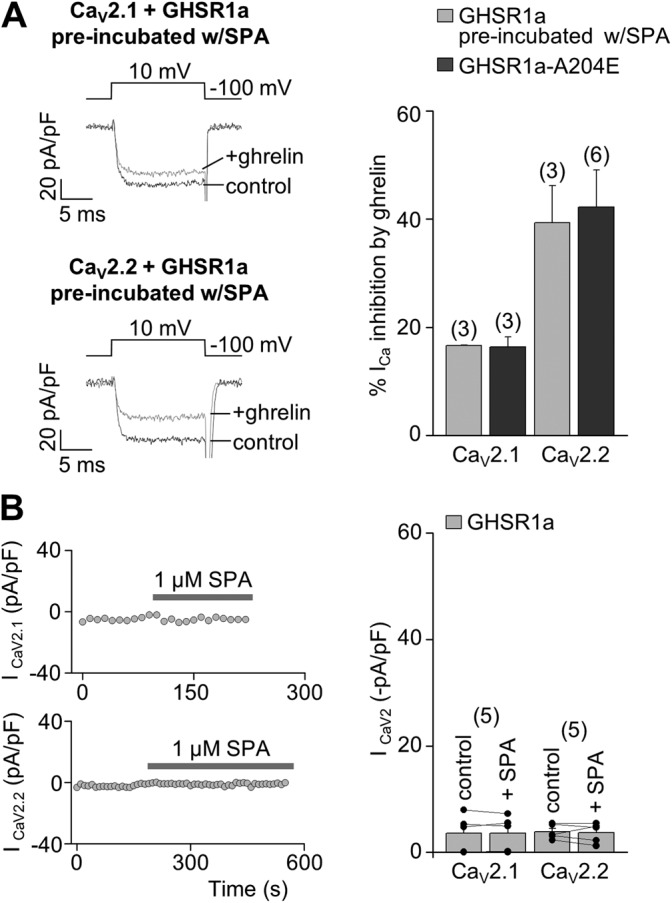
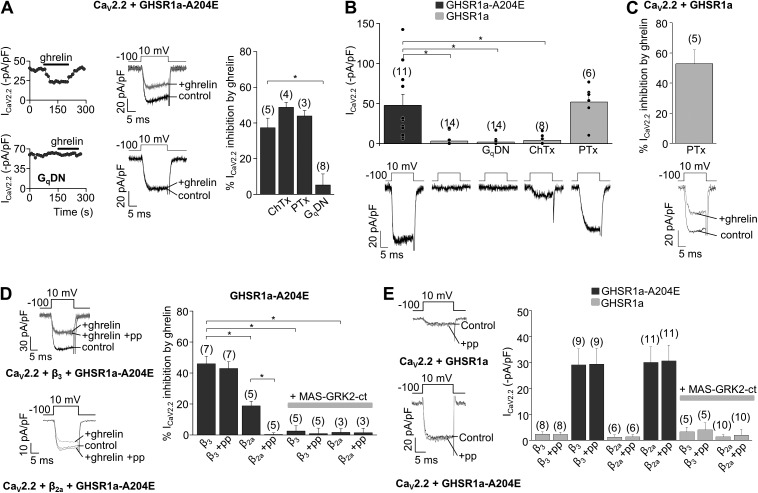
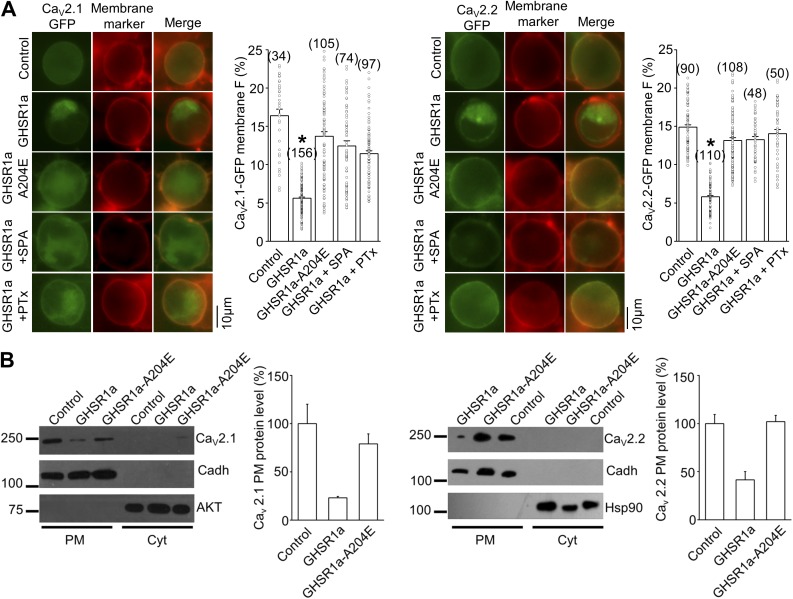
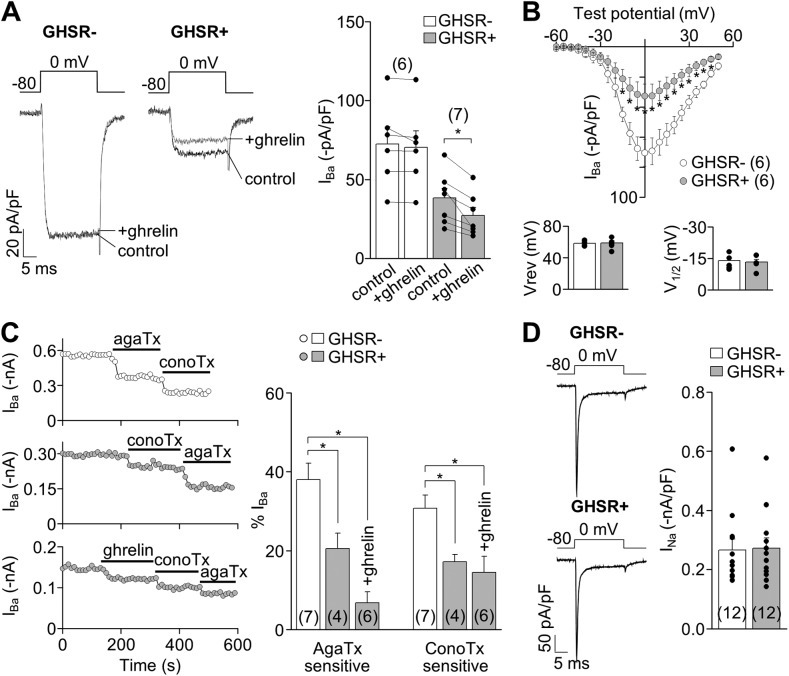
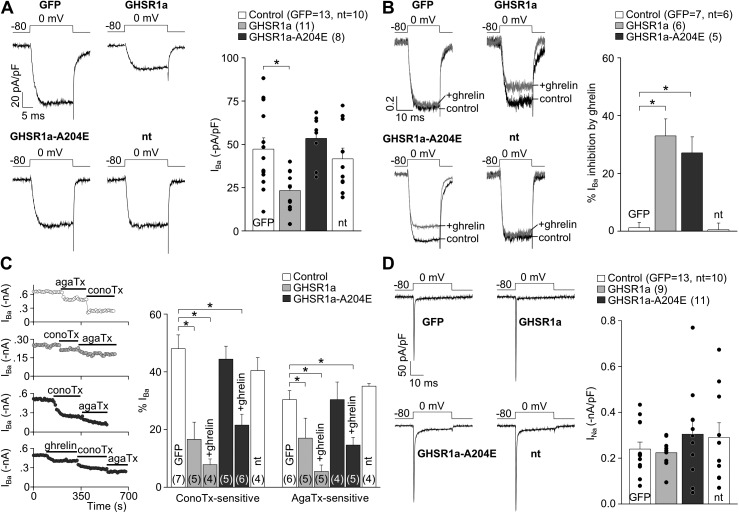
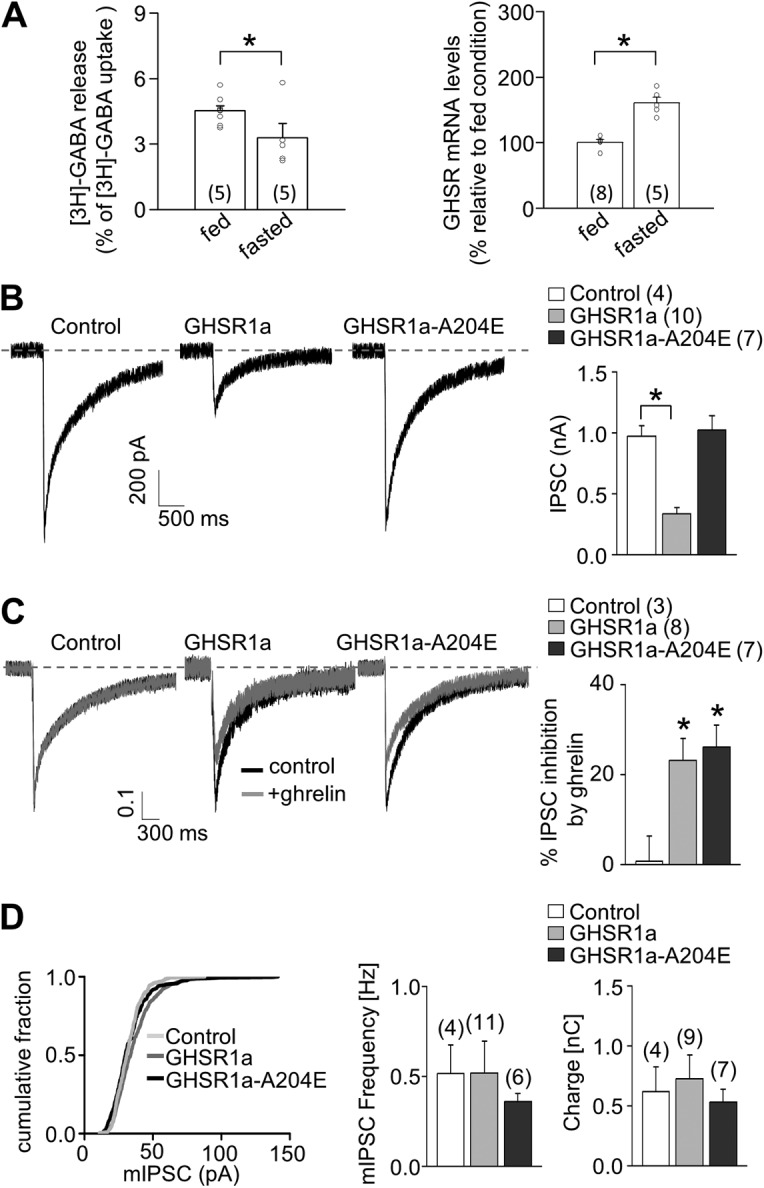
The growth hormone secretagogue receptor type 1a (GHSR1a) has the highest known constitutive activity of any G protein-coupled receptor (GPCR). GHSR1a mediates the action of the hormone ghrelin, and its activation increases transcriptional and electrical activity in hypothalamic neurons. Although GHSR1a is present at GABAergic presynaptic terminals, its effect on neurotransmitter release remains unclear. The activities of the voltage-gated calcium channels, CaV2.1 and CaV2.2, which mediate neurotransmitter release at presynaptic terminals, are modulated by many GPCRs. Here, we show that both constitutive and agonist-dependent GHSR1a activity elicit a strong impairment of CaV2.1 and CaV2.2 currents in rat and mouse hypothalamic neurons and in a heterologous expression system. Constitutive GHSR1a activity reduces CaV2 currents by a Gi/o-dependent mechanism that involves persistent reduction in channel density at the plasma membrane, whereas ghrelin-dependent GHSR1a inhibition is reversible and involves altered CaV2 gating via a Gq-dependent pathway. Thus, GHSR1a differentially inhibits CaV2 channels by Gi/o or Gq protein pathways depending on its mode of activation. Moreover, we present evidence suggesting that GHSR1a-mediated inhibition of CaV2 attenuates GABA release in hypothalamic neurons, a mechanism that could contribute to neuronal activation through the disinhibition of postsynaptic neurons.


Figures

Figure 1.
Figure 1.
Constitutive and ghrelin-dependent GHSR1a activity inhibit CaV2 currents. (A) Representative ICa traces from HEK 293T cells transfected with CaV2.1 or CaV2.2, CaVα2δ1, CaVβ3, and 0.6 µg GHSR1a, GHSR1a-A204E, or empty pcDNA3.1+ (control), and averaged ICa at different amounts of GHSR1a plasmid transfected. (B) Representative microphotographs (left) and average fluorescent signal intensity (right) for the F-ghrelin binding in cells transfected with increasing amounts of GHSR1a plasmid. (C) Representative ICa traces from cells cotransfected with CaV2.1 and CaV2.2, CaVα2δ1, CaVβ3, and 0.6 µg GHSR1a or GHSR1a-A204E with or without 1 µM SPA preincubation (left), and the averaged ICa for each condition (right). (D) Time courses and representative traces of ghrelin effect on ICa from cells expressing CaV2.1 or CaV2.2, CaVα2δ1, CaVβ3, and GHSR1a-A204E (left), and the averaged percentage of CaV2.1 and CaV2.2 current inhibition at different amounts of GHSR1a plasmid transfected. ANOVA with Dunnett’s (C) and Tukey’s post-test (D). *, P < 0.05. Error bars represent mean ± SE.
Figure 2.
Figure 2.
Constitutive GHSR1a activity inhibits by a long-term mechanism the CaV2 currents preserving CaV2 current inhibition by ghrelin-dependent GHSR1a activity. (A) Representative ICa traces (left) from HEK 293T cells expressing CaV2.1 (above) or CaV2.2 (below), CaVα2δ1, CaVβ3, and GHSR1a preincubated with 1 µM SPA, before (control) and after (+ghrelin) 500-nM ghrelin application, and averaged percentage of ICa inhibition by 500 nM ghrelin (right) from HEK 293T cells expressing CaV2.1 or CaV2.2, CaVα2δ1, CaVβ3, and GHSR1a preincubated with 1 µM SPA or GHSR1a-A204E as a control condition. (B) Time courses of peak CaV2 currents (left) with the acute application of 1 µM SPA (gray bars) from HEK 293T cells expressing CaV2.1 (above) or CaV2.2 (below), CaVα2δ1, CaVβ3, and GHSR1a, and the averaged CaV2.1 or CaV2.2 currents before (control) and after (+SPA) acute application of 1 µM SPA. Two sample (A) and paired (B) Student’s t tests. Error bars represent mean ± SE.
Figure 3.
Figure 3.
CaV2.2 inhibition by constitutive and ghrelin-dependent GHSR1a activity is signaled by Gi/o and Gq proteins, respectively. (A) Time course, representative traces, and averaged ICa inhibition by 500 nM ghrelin in HEK 293T cells transfected with CaV2.2, CaVα2δ1, CaVβ3, and GHSR1a-A204E in control conditions or preincubated with 500 ng/ml ChTx or 500 ng/ml PTx, or cotransfected with a GqDN. (B) Representative traces and averaged ICa in HEK 293T cells expressing CaV2.2, CaVα2δ1, CaVβ3, and GHSR1a or GHSR1a-A204E in control or preincubated with 500 ng/ml ChTx or 500 ng/ml PTx, or cotransfected with GqDN. (C) Representative traces and averaged ICa inhibition by 500 nM ghrelin in HEK 293T cells transfected with CaV2.2, CaVα2δ1, CaVβ3, and GHSR1a preincubated with 500 ng/ml PTx. (D) Representative ICa in HEK 293T cells cotransfected with CaV2.2, CaVα2δ1, GHSR1a-A204E, and CaVβ3 or CaVβ2a without (control) or with (+ghrelin) 500 nM ghrelin without or with (+pp) an 80-mV prepulse application (left), and averaged percentage of ICa inhibition by 500 nM ghrelin in cells expressing CaV2.2, CaVα2δ1, and GHSR1a-A204E with the coexpression of CaVβ3 or CaVβ2a and MAS-GRK2-ct and prepulse application (+pp; right). (E) Representative ICa traces from cells cotransfected with CaV2.2, CaVα2δ1, CaVβ3, and GHSR1a or GHSR1a-A204E with (+pp) or without (Control) the application of an 80-mV prepulse (left) and averaged ICa from HEK 293T cells expressing CaV2.2, CaVα2δ1, GHSR1a, or GHSR1a-A204E, with the coexpression of CaVβ3 or CaVβ2a and MAS-GRK2ct and an 80-mV prepulse application (+pp; right). ANOVA with Dunnett’s (A and B) or Tukey’s post-test (D), and two-sample Student’s t test (E). *, P < 0.05. Error bars represent mean ± SE.
Figure 4.
Figure 4.
GHSR1a decreases surface CaV2.1 and CaV2.2 density. (A) Photomicrographs and averaged percentages of green fluorescent plasma membrane signal of HEK 293T cells transfected with CaV2.1-GFP (left) and CaV2.2-GFP (right), its auxiliary subunits (Control) with GHSR1a or GHSR1a-A204E, and preincubated or not with 1 µM SPA or 500 ng/ml PTx. Green and red signals correspond to the eGFP tag on CaV2 and the membrane marker CellMask, respectively. Kruskal–Wallis with Dunn’s post-test; *, P < 0.01. (B) Western blot analysis displaying the CaV2.1-GFP and CaV2.2-GFP protein level in the plasma membrane (PM) or the cytoplasmic (Cyt) fraction of HEK 293T cells transfected with CaV2.1-GFP or CaV2.2-GFP and its auxiliary subunits (Control), and cotransfected with GHSR1a or GHSR1a-A204E (left), and averaged percentage of CaV2.1-GFP and CaV2.2-GFP PM protein level in each condition normalized against cadherin signal used as the plasma membrane loading control (right). Both AKT and Hsp90 as cytosolic markers. n = 2 and 3 for CaV2.1-GFP or CaV2.2-GFP, respectively. Error bars represent mean ± SE.
Figure 5.
Figure 5.
GHSR1a activity modulates native CaV2 currents in hypothalamic neurons from GHSR-eGFP reporter mice. (A) Representative IBa traces and averaged IBa before (control) and after (+ghrelin) 500-nM ghrelin application in hypothalamic GHSR1a− and GHSR1a+ neurons. (B) Averaged peak IBa–voltage (I-V) relationships (evoked from a holding of −80 mV), reversal (Vrev), and activation (V1/2) potential midpoints (calculated by Boltzmann linear function) obtained from GHSR1a− and GHSR1a+ neurons. (C) IBa time courses of application of 1 µM ω-conotoxin-GVIA (conoTx) and 0.2 µM ω-agatoxin-IVA (agaTx) with or without previous 500-nM ghrelin application from hypothalamic GHSR1a− (top) and GHSR1a+ neurons (middle and bottom; left). Averaged percentage of IBa sensitive to agaTx and conoTx from GHSR1a− and GHSR1a+ neurons, with (+ghrelin) or without 500-nM ghrelin application (right). (D) Representative and averaged INa from GHSR1a− and GHSR1a+ neurons. Paired (A) or two-sample (B and D) Student’s t test and ANOVA with Dunnett’s post-test (C). *, P < 0.05. Error bars represent mean ± SE.
Figure 6.
Figure 6.
GHSR1a activity inhibits native CaV2 currents from rat hypothalamic neurons. (A) Representative and averaged IBa from nontransfected (nt) and GFP-, GHSR1a-YFP–, and GHSR1a-A204E-YFP–transfected neurons. (B) Normalized IBa traces before (control) and after (+ghrelin) 500-nM ghrelin application, and averaged percentage of IBa inhibition by ghrelin in each condition. (C) IBa time courses of application of 1 µM ω-conotoxin-GVIA (conoTx) and 0.2 µM ω-agatoxin-IVA (agaTx) with or without previous 500-nM ghrelin application from GFP-, GHSR1a-, and GHSR1a-A204E–transfected neurons (left). Averaged percentage of IBa sensitive to agaTx and conoTx from nontransfected (nt), GFP-, GHSR1a-, and GHSR1a-A204E–transfected neurons, with (+ghrelin) or without 500-nM ghrelin application (right). (D) Representative and averaged INa from nontransfected (nt) and GFP-, GHSR1a-, and GHSR1a-A204E–transfected neurons. ANOVA with Dunnett’s post-test (A–D). *, P < 0.05. Error bars represent mean ± SE.
Figure 7.
Figure 7.
GHSR1a activity impacts GABA release. (A) [3H]GABA release (left) and GHSR1a mRNA levels (right) from ARC-enriched explants from ad libitum–fed or 48 h–fasted mice. (B) Representative traces and averaged IPSC size obtained from GHSR-null primary cultured neurons transduced or not with GHSR1a-YFP and GHSR1a-A204E-YFP. (C) Representative normalized traces with or without the application of 500 nM ghrelin, and average values of percentage of IPSC inhibition by ghrelin obtained from GHSR-null primary cultured neurons transduced or not with GHSR1a-YFP and GHSR1a-A204E-YFP. (D) Distribution of mIPSC size and averaged values for mIPSC frequencies and charge movement by 0.5-M sucrose solution application in GHSR-null primary cultured neurons transduced or not with GHSR1a-YFP and GHSR1a-A204E-YFP. Two-sample Student’s t test (A) and ANOVA with Dunnett’s post-test (B–D). *, P < 0.05. Error bars represent mean ± SE.

Comment in

References

    1. Agosti F., López Soto E.J., Cabral A., Castrogiovanni D., Schioth H.B., Perelló M., and Raingo J.. 2014. Melanocortin 4 receptor activation inhibits presynaptic N-type calcium channels in amygdaloid complex neurons. Eur. J. Neurosci. 40:2755–2765. 10.1111/ejn.12650 - DOI - PubMed
    1. Altier C., Khosravani H., Evans R.M., Hameed S., Peloquin J.B., Vartian B.A., Chen L., Beedle A.M., Ferguson S.S., Mezghrani A., et al. . 2006. ORL1 receptor-mediated internalization of N-type calcium channels. Nat. Neurosci. 9:31–40. 10.1038/nn1605 - DOI - PubMed
    1. Andrews Z.B., Liu Z.W., Walllingford N., Erion D.M., Borok E., Friedman J.M., Tschöp M.H., Shanabrough M., Cline G., Shulman G.I., et al. . 2008. UCP2 mediates ghrelin’s action on NPY/AgRP neurons by lowering free radicals. Nature. 454:846–851. 10.1038/nature07181 - DOI - PMC - PubMed
    1. Andrews Z.B., Erion D., Beiler R., Liu Z.W., Abizaid A., Zigman J., Elsworth J.D., Savitt J.M., DiMarchi R., Tschoep M., et al. . 2009. Ghrelin promotes and protects nigrostriatal dopamine function via a UCP2-dependent mitochondrial mechanism. J. Neurosci. 29:14057–14065. 10.1523/JNEUROSCI.3890-09.2009 - DOI - PMC - PubMed
    1. Beedle A.M., McRory J.E., Poirot O., Doering C.J., Altier C., Barrere C., Hamid J., Nargeot J., Bourinet E., and Zamponi G.W.. 2004. Agonist-independent modulation of N-type calcium channels by ORL1 receptors. Nat. Neurosci. 7:118–125. 10.1038/nn1180 - DOI - PubMed

Publication types

LinkOut - more resources