. 2015 Sep 1;112(35):E4864-73.
doi: 10.1073/pnas.1512025112. Epub 2015 Aug 17.

Talin determines the nanoscale architecture of focal adhesions

Affiliations

Talin determines the nanoscale architecture of focal adhesions

Jaron Liu et al. Proc Natl Acad Sci U S A. .

Abstract

Insight into how molecular machines perform their biological functions depends on knowledge of the spatial organization of the components, their connectivity, geometry, and organizational hierarchy. However, these parameters are difficult to determine in multicomponent assemblies such as integrin-based focal adhesions (FAs). We have previously applied 3D superresolution fluorescence microscopy to probe the spatial organization of major FA components, observing a nanoscale stratification of proteins between integrins and the actin cytoskeleton. Here we combine superresolution imaging techniques with a protein engineering approach to investigate how such nanoscale architecture arises. We demonstrate that talin plays a key structural role in regulating the nanoscale architecture of FAs, akin to a molecular ruler. Talin diagonally spans the FA core, with its N terminus at the membrane and C terminus demarcating the FA/stress fiber interface. In contrast, vinculin is found to be dispensable for specification of FA nanoscale architecture. Recombinant analogs of talin with modified lengths recapitulated its polarized orientation but altered the FA/stress fiber interface in a linear manner, consistent with its modular structure, and implicating the integrin-talin-actin complex as the primary mechanical linkage in FAs. Talin was found to be ∼97 nm in length and oriented at ∼15° relative to the plasma membrane. Our results identify talin as the primary determinant of FA nanoscale organization and suggest how multiple cellular forces may be integrated at adhesion sites.

Keywords: focal adhesions; mechanobiology; nanoscale architecture; superresolution microscopy; talin.


Conflict of interest statement

The authors declare no conflict of interest.

Figures

Fig. S1.
Fig. S1.
Expression and siRNA-mediated depletion of talin1 in HUVECs. (A) Immunolocalization of talin isoforms in HUVECs and human foreskin fibroblasts (HFF1). Top row, first and third columns, staining with a pan-Talin antibody (TLN1+TLN2, clone 8d4). Top row, second and fourth columns, staining with a talin2-specific antibody (clone 121A). Middle row, Paxillin staining. Bottom row, merged images (green: Talin, magenta: paxillin). (Scale bar: 10 μm.) (B) Immunoblot analysis of HUVECs (left) and HFF1 (right), using antibodies specific to (top to bottom) pan-Talin (1 + 2) (clone 8d4), talin1 (clone 93E12), talin2 (clone 121A), talin2 (clone 538), and GAPDH (loading control). (C) RT-PCR for talin1 and talin2 in HUVECs, Ea.hy926 (immortalized human umbilical vein cell line), and HFF1 cells. Primers used as described in SI Materials and Methods. (D and E) Flow cytometric analysis of HUVECs transfected with Alexa Fluor 647-conjugated control siRNA (D) or hTalin1 siRNA (E). Transfected cells (quadrant 1): 99.2% (D), 98.9% (E). (F) Time-course immunoblot analysis of siRNA-knockdown of human talin1 in HUVECs, 24–96 h. (G and H) Migration trajectory of HUVECs transfected with control siRNA + GFP (G) or hTalin1 siRNA + GFP (H) over 12 h on fibronectin; Ncells: 62 (SiCON) and 97 (SiTLN1). (I) Time-lapse phase contrast images of HUVECs transfected with control siRNA (Upper) or hTalin1 siRNA (Lower) spreading on fibronectin. (Scale bar: 20 μm.) (J) Statistical comparisons of cell migration parameters for control siRNA (blue) and hTalin1 siRNA (red).
Fig. S2.
Fig. S2.
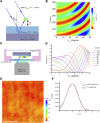
Three-dimensional superresolution microscopy by iPALM. (A) The iPALM instrument. 1 and 1′: Sample holder z piezo; 2 and 2′: upper and lower objective lenses (60×, N.A. 1.49); 3: TIRF excitation and photoactivation beampath; 4 and 4′: 22.5° slotted mirrors; 5: imaging sample (sealed chamber made from two no. 1.5 coverglasses); 6 and 6′: beampaths of fluorescence emission collected by objective lenses; 7: the Hess beamsplitter for three-way multiphase interferometry; 8′, 8′′, and 8′′′: beampaths of self-interfered emission exiting the beamsplitter; not shown: 400-mm tube lenses for each exiting beam, emission filter wheels, electron-multiplying CCD cameras, stage translator. (B) Schematic diagram of the Hess beamsplitter. Surface 1, 2:1 transmission/reflection; surface 2, 1:1 transmission/reflection; surface 3: 100% reflection with index-matching oil, mounted on a three-axis z-tip-tilt piezo pedestal. (C) iPALM calibration curve. Plasmonic gold nanoparticles immobilized on the coverglass are used as fiducial marks. The sample vertical position (z) is scanned by the piezoelectric stage (A: 1 and 1′). Fits to camera 1 (beam 8′′′, red); camera 2 (beam 8′′, green); camera 3 (beam 8′, blue). (D) Extracted z-position of fiducials (black) vs. the piezo stage position (red). (E and F) Localization precision in x (E) and z (F), estimated by repeatedly imaging a fiducial with photon numbers similar to typical Alexa Fluor 647 photon output.
Fig. S3.
Fig. S3.
Measurement of topographic Z map with nanoscale precision by surface-generated structured illumination. (A) Principles of surface-generated structured illumination (VIA-FLIC or SAIM) for high-precision mapping of fluorophore (green) z-position. (B) Intensity of excitation field as a function of incidence angle (θinc) and fluorophore height (z). (C) Schematic diagram of VIA-FLIC/SAIM measurements. (D) Angle dependence of fluorescence emission as a function of fluorophore z-position. The dramatic changes in lineshape as a function of z provide the basis for the nanoscale precision of the methods. (E) Topographic z map of rhodamine-fibronectin–coated substrate relative to SiO2 surface. Z-positions are extracted pixel by pixel as described in SI Materials and Methods. Thermal SiO2 thickness, 508.6 nm; excitation wavelength, 561 nm; color bar, 0–100 nm. (Scale bar: 5 μm.) (F) Histogram of z-position distribution (red) and fit to a Gaussian function (blue dashed line). Total number of pixels fitted and peak z-value ± SE shown.
Fig. 1.
Fig. 1.
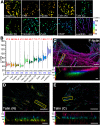
Nanoscale architecture of FAs in HUVECs. (A) Topographic maps of FA protein z-positions (nanometers) in HUVECs. (B) Nanoscale stratification of FA protein z-positions. Notched boxes and histograms (bin size, 1 nm) for zFA of indicated FA proteins: first and third quartiles, median and confidence intervals; whiskers, 5th and 95th percentiles. Numbers indicated: median zFA (red), number of FA ROIs (black), and number of cells (blue). (C) iPALM 3D superresolution images of F-actin, (D) talin (N-terminal probe), and (E) talin (C-terminal probe). F-actin is highly enriched at z >100 nm but is sparse within FA core region, whereas talin adopts a polarized N–C orientation as described earlier (16). CE, Upper show top view (xy). CE, Lower show side-view projection of boxed regions in upper panels, cell edges on left. Color bar indicates z-position relative to ECM: 30–100 nm (A); 0–150 nm (CE). (Scale bars: 5 μm in A, 2 μm in CE, Upper, and 250 nm in CE, Lower.)
Fig. 2.
Fig. 2.
Nanoscale architecture of FAs in vinculin-null MEF. (A) Topographic map of FA protein z-positions (nanometers) in vinculin-null MEF. (B) Nanoscale stratification of FA protein z-positions. Notched box plots and histograms (bin size, 1 nm) for zFA of indicated FA proteins: first and third quartiles, median and confidence intervals; whiskers, 5th and 95th percentiles. Numbers indicated: median zFA (red), number of FA ROIs (black), and number of cells (blue). (C) iPALM 3D superresolution images of F-actin, indicating high density at z >80 nm, and low density within FA core region. (Upper) Top view (xy). (Lower) Side view projection of boxed region, cell edge on left. Color bar indicates z-position relative to the ECM: (A) 30–100 nm; (C) 0–150 nm. (Scale bars: 5 μm in A, 2 μm in C, Upper, and 250 nm in C, Lower.)
Fig. 3.
Fig. 3.
Recombinant minitalins support FA assembly. (A) Schematic diagram of minitalin constructs with selective deletions in the rod domain (see also Fig. S4). (B) Immunoblot analysis of mEmerald-tagged mouse talin and minitalin constructs (probed with anti-GFP antibody). (C) Epifluorescence micrographs of HUVECs cotransfected with hTalin1 siRNA (KD) or control siRNA (siCON), and mEmerald-tagged full-length talin (T100), minitalins (T29-T58), or GFP (control). GFP channel (green) indicates talin or minitalins localization to FAs. Knockdown of endogenous talin is verified by hTalin1-specific antibody (huTLN, cyan). FAs and cytoskeletal actin organization are visualized by paxillin immunofluorescence (magenta) and phalloidin (blue), respectively. (D) Magnified view, GFP channel of C. (Scale bars: 25 μm in C and 12.5 μm in D.)
Fig. S4.
Fig. S4.
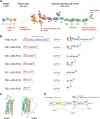
Recombinant talin analogs. (A) Talin1 structure. Models assembled from X-ray crystallography and NMR, adapted from ref. . Key domains, sequence number, and binding sites are indicated. (B) Schematic of talin analogs (Left) and structure-based models (Right), shorthand notation (T##) indicated. Note the slight deviations from the sequence-based and the structure-based lengths due to the topology of the R2–R3 four-helical bundles, e.g., T46. (C) Differences in the end-to-end (rN–C) lengths between four-helix and five-helix bundles. Four-helix (Talin R2 domain, PDB ID code 2L7A); five-helix (Talin R6 domain, PDB ID code 2L10). (D) FilaminA domain structure and key binding sites. The IgFLNa1-8 region that we inserted into chimeric-talin is highlighted in yellow.
Fig. S5.
Fig. S5.
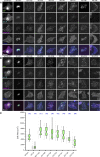
Effects on integrin clustering and cell areas by recombinant talin analogs. Epifluorescence micrographs of HUVECs cotransfected with hTalin1 siRNA (KD) or control siRNA (siCON), and mEmerald-tagged full-length talin (T100), GFP (control), and (A) minitalin constructs (T29–T58) or (B) chimeric-talin (XT29–XT58). GFP channel (green) indicates talin or minitalin localization to FAs. Efficient knockdown of endogenous talin was verified by hTalin1-specific antibody (cyan). Activated integrin was probed with 9EG7 antibody, and F-actin was probed with phalloidin (blue). (Scale bar: 25 μm.) (C) Effect of talin analogs on cell spread areas. Notched boxes: first and third quartiles, median and confidence intervals; whiskers, 5th and 95th percentiles. Number of cells indicated (blue).
Fig. 4.
Fig. 4.
Polarized orientation of recombinant minitalins. (A) Topographic map of talin analog z-positions (nanometers). N-terminal FP fusions (Upper) and C-terminal FP fusions (Lower). (B and C) Polarized orientation of minitalins in FAs. Notched boxes and histograms (bin size, 1 nm): first and third quartiles, median and confidence intervals; whiskers, 5th and 95th percentiles, for N-terminal probes (B), and C-terminal probes (C). (D) Comparison of N- and C-terminal zFA positions. Numbers of FA ROIs in parentheses; median zFA of the distribution indicated in red (B and C). (E) Polarized orientation of talin and minitalins is independent of calpain cleavage. Topographic map of C-terminal FP fusions containing L432G mutation (denoted by asterisk) that suppress calpain II cleavage in the linker between the talin FERM and rod domains. (F) Notched boxes and histograms (bin size, 1 nm): first and third quartiles, median and confidence intervals; whiskers, 5th and 95th percentiles. Numbers indicated in B, C, and E: median zFA (red), number of FA ROIs (black), and number of cells (blue). (G) Comparison of the C-terminal z-positions of talin analogs with or without the L432G mutation. Statistical significance in D and G: ****P << 10−6; *P < 0.05, Mann–Whitney u test. Color bars indicate z-position, 40–80 nm (A and E). (Scale bars: 5 μm.)
Fig. S6.
Fig. S6.
Statistics of protein Z-positions in FAs. (A) Statistics of FA protein z-positions in HUVECs (Fig. 1 A and B). (B) Statistics of FA protein z-positions in Vinculin (−/−) MEFs (Fig. S3). (C) Statistics of z-positions of recombinant talin analogs coexpressed with Talin1 siRNA in HUVECs. (DF) Normalized histograms of pixel z-position (zpixel) for recombinant talin analogs: minitalins (D), minitalins/L432G (E), chimeric-talin (F). (G) C-terminal z-positions of minitalins and chimeric-talin. Notched boxes: first and third quartiles, median and confidence intervals; whiskers, 5th and 95th percentiles. Full-length talin (T100) in orange; minitalins in blue; chimeric-tain in coral. ****P << 10−6, Mann–Whitney u test. (H) Statistics of FA protein z-positions in cells substituted with recombinant talin analogs in HUVECs. (IK) ANOVA Tukey test for z-positions of recombinant talin analogs: N termini of minitalins (I), C termini of minitalins (J), C termini of minitalin/L432G (K).
Fig. S7.
Fig. S7.
(A) Topographic map of talin C-terminal z-positions in KD+T100 HUVECs with pharmacological inhibition of calpain II. Color bar, 40–80 nm. (B) Notched box plots and histograms (bin size, 1 nm) for zFA of indicated FA proteins: first and third quartiles, median and confidence intervals; whiskers, 5th and 95th percentiles. Numbers indicated: median zFA (red), number of FA ROIs (black), and number of cells (blue). ****P <<10−12, Mann–Whitney u test. (C) Dual-channel z-position analysis of talin C terminus and F-actin. Topographic z map of talin C terminus (Left) and F-actin (Right). (D) Merged image (green: KD+T100, mEmerald) and F-actin (red: phalloidin, Alexa Fluor 568). (E) Pixel-based correlation between F-actin (x axis) and talin C terminus (y axis). Gray line, linear regression: y = mx + b, m = 0.461 ± 0.021, b = 19.713 ± 2.10. Spearman rank correlation ρ = 0.2416 (P <<10−12, two-tailed test). (F) Topographic map of vinculin coexpressed in T100 or minitalin HUVECs. Color bars indicate z-position, 30–100 nm. (G) Box and whisker plot of vinculin z-positions. Notched boxes, histograms (1- nm bin): first and third quartiles, median and confidence intervals; whiskers, 5th and 95th percentiles. Numbers indicated in B, C, and E: median zFA (red), number of FA ROIs (black), and number of cells (blue). (Scale bars in A, C, D, and F: 5 μm.) (H) Relationship between talin sequence lengths and the z-positions of vinculin (red) or stress fiber core (purple). Median of zFA distribution (symbols), SD (error bands), and linear regression (solid line, y = mx + b): stress fiber (purple circle, b = 90.42 ± 0.78 nm, m = 0.063 ± 0.013), vinculin (red square, b = 67.7 ± 0.87 nm, m = 0.073 ± 0.015).
Fig. 5.
Fig. 5.
Recombinant chimeric-talins support FA assembly and adopt a polarized orientation. (A) Schematic diagram of recombinant chimeric-talin constructs. The IgFLNa1-8 domain (yellow) is inserted in place of the deletion in minitalins. (B) Immunoblot analysis of mEmerald-tagged chimeric-talin fusions, probed with anti-GFP antibody. (C) Epifluorescence micrographs of HUVECs cotransfected with hTalin1 siRNA (KD) or control siRNA (siCON), and mEmerald-tagged full-length talin (T100), chimeric-talins (XT29-XT58), or GFP (control). GFP channel (green) indicates talin or chimeric-talins localization to FAs. (D) Magnified view. Efficient knockdown of endogenous talin is verified by hTalin1-specific antibody (huTLN, cyan). FAs and the actin cytoskeletal organization are visualized by paxillin immunofluorescence (magenta) and phalloidin (blue), respectively. (E) Topographic map of chimeric-talin z-position (C-terminal FP fusion). Color bars indicate z-position, 40–80 nm. (F) Box and whisker plot of chimeric-talin C-terminal z-positions. Notched boxes and histograms (bin size, 1 nm): first and third quartiles, median and confidence intervals; whiskers, 5th and 95th percentiles. Numbers indicated in B, C, and E: median zFA (red), number of FA ROIs (black), and number of cells (blue). (Scale bars: 25 μm in C, 12.5 μm in D, and 5 μm in E.)
Fig. 6.
Fig. 6.
Modulation of FA architecture. (A) iPALM 3D superresolution images of F-actin in HUVECs expressing full-length talin (T100) or minitalin constructs. (Upper) Top-view (xy) image with color encoding z-position. (Lower) Side-view projection of boxed regions in upper panel, cell edge on left. Histograms (bin size 1 nm) of z-position shown on left. Color bar, 0–150 nm relative to substrate surface. Gray line, z = 50 nm. (Scale bars: 2 μm in top view and 250 nm in side view.) (B) Topographic map of vertical (z) positions of VASP in HUVECs expressing T100 or minitalins. Color bars indicate z-position, 30–100 nm. (Scale bar: 5 μm.) (C) Box and whisker plot of FA/stress fiber interface as marked by VASP. Notched boxes, histograms (bin size, 1 nm): first and third quartiles, median and confidence intervals; whiskers, 5th and 95th percentiles. Numbers indicated in B, C, and E: median zFA (red), number of FA ROIs (black), and number of cells (blue).
Fig. 7.
Fig. 7.
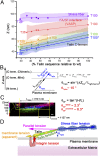
Molecular geometry of the integrin–talin–actin module. (A) Relationship between talin sequence lengths and the z-positions of talin analogs, or FA components. Median of zFA distribution (symbols), SD (error bands), and linear regression (solid line, y = mx + b): minitalins (blue square, b = 34.2 ± 2.66 nm, m = 0.326 ± 0.048); minitalins-L432G (blue circle, b = 31.7 ± 1.08 nm, m = 0.309 ± 0.019); chimeric-talins (orange triangle, b = 41.6 ± 4.37 nm, m = 0.332 ±0.099); VASP (red inverted triangle, b = 65.16 ± 0.91 nm, m = 0.176 ± 0.015); F-actin (purple square, b = 90.42 ± 0.78 nm, m = 0.063 ± 0.013). (B) Talin geometry in FAs. Talin-membrane contact angle (θTalin) is calculated from ΔZFA, the z-offset between chimeric-talins and minitalins regression lines, and the ∼30-nm length of the IgFLNa1-8 domain, yielding θTalin ∼15 °. (C) Actin stress fiber geometry at FA interface. Measurements based on side view iPALM image of actin (Fig. 1C). FA/actin contact angles (θSF) ranges from 2° to 6°, for the distal and proximal FA edges, respectively (cell edge on left). Color scale, 0–150 nm relative to substrate surface. Histograms (bin size, 1 nm). (Scale bar: 250 nm.) (D) Geometry and force-balance relationship of the integrin–talin–actin module. Molecule sizes and orientation are approximately to scale. Talin dimer is omitted and some vectors are rescaled for clarity. Vectors indicate the direction of cellular forces, assuming mechanical equilibrium.
Fig. S8.
Fig. S8.
Geometry-dependent talin-mediated force transmission model. (A) End-to-end length vs. force for a freely jointed polymer chain with contour lengths L0 of 40 nm (green) and 80 nm (blue), with a subunit length of 5.7 nm to approximate talin and mini-Talin sizes. (B) End-to-end length vs. force for a semiflexible polymer according to the worm-like chain (Marko–Siggia) with contour lengths L0 of 40 nm (green) and 80 nm (blue), and persistence length of 5 nm. Red line denotes the ratio between the extension for the 80-nm- vs. the 40-nm-long chains as a function of force. (C) Graphical representation of talin/actin balanced tension vectors in a case of talin/actin angular mismatch. Tensions depicted are actin stress fiber tension (blue), intramolecular Talin tension (green), in-plane tension at the talin–actin interface (parallel tension, magenta). Tension vectors at integrin–talin interface are omitted for clarity. Molecule size is approximately to scale. (D) Geometric relationship of three-vector force balance for C. All force vectors can be calculated from θTalin = 15°, θSF = 5°, and talin tension of 10 pN, using sine’s rule. The majority of tension is transmitted by the parallel component (magenta). (E) Graphical representation of talin/actin balanced tension vectors in a case of talin/actin near colinearity. Because θSF is constrained to small angle for cells on 2D substrate, this requires a significant lengthening of talin. (F) Geometric relationship of three-vector force balance for E, with θTalin nearly equal to θSF. Tension magnitudes are calculated with the assumption of similar actomyosin tension as in C and D. The majority of tension is transmitted through talin to integrin. The high intramolecular tension likely promotes talin lengthening.

References

    1. Geiger B, Bershadsky A, Pankov R, Yamada KM. Transmembrane crosstalk between the extracellular matrix--cytoskeleton crosstalk. Nat Rev Mol Cell Biol. 2001;2(11):793–805. - PubMed
    1. Bershadsky AD, Balaban NQ, Geiger B. Adhesion-dependent cell mechanosensitivity. Annu Rev Cell Dev Biol. 2003;19:677–695. - PubMed
    1. Ridley AJ, et al. Cell migration: Integrating signals from front to back. Science. 2003;302(5651):1704–1709. - PubMed
    1. Parsons JT, Horwitz AR, Schwartz MA. Cell adhesion: Integrating cytoskeletal dynamics and cellular tension. Nat Rev Mol Cell Biol. 2010;11(9):633–643. - PMC - PubMed
    1. Burridge K, Wittchen ES. The tension mounts: Stress fibers as force-generating mechanotransducers. J Cell Biol. 2013;200(1):9–19. - PMC - PubMed

Publication types