. 2015 Sep 1;112(35):10973-8.
doi: 10.1073/pnas.1504977112. Epub 2015 Aug 17.

Phytochemical diversity drives plant-insect community diversity

Affiliations

Phytochemical diversity drives plant-insect community diversity

Lora A Richards et al. Proc Natl Acad Sci U S A. .

Abstract

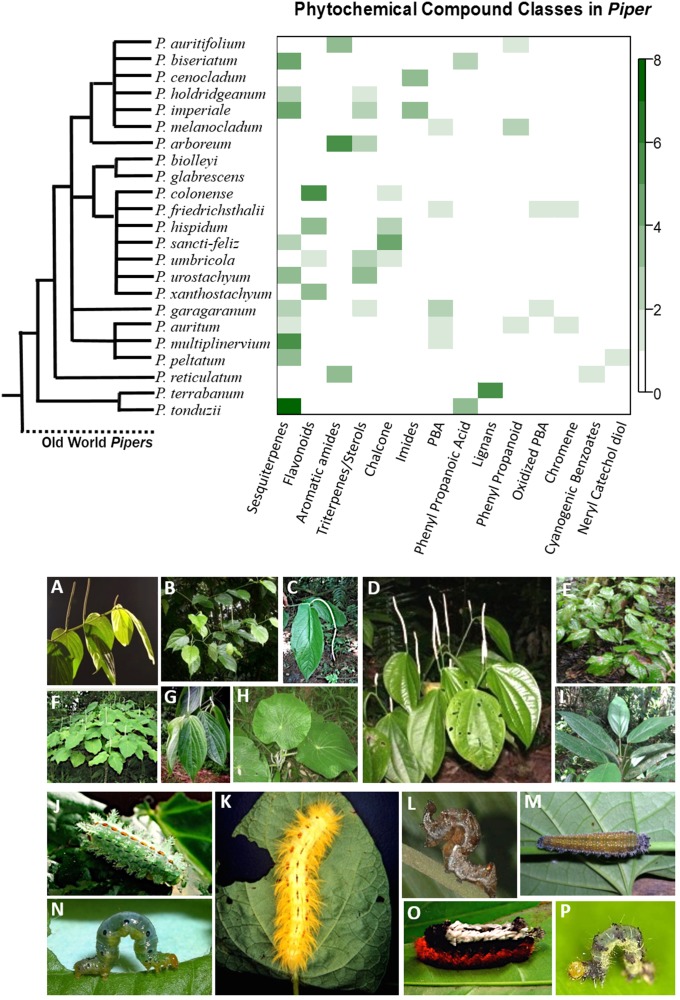
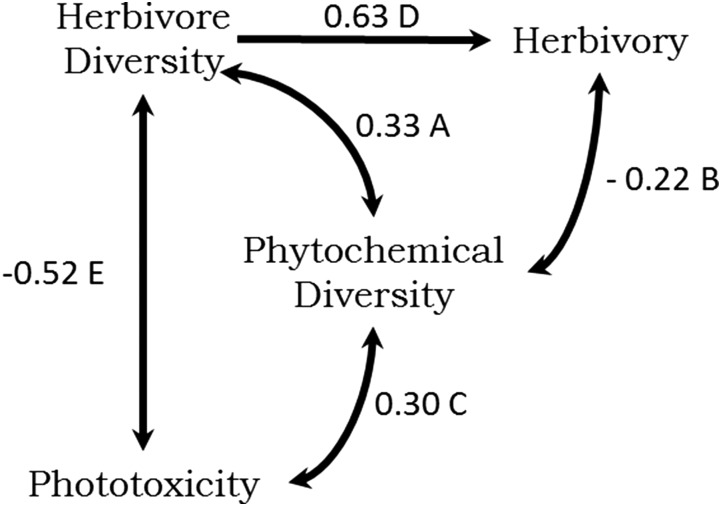
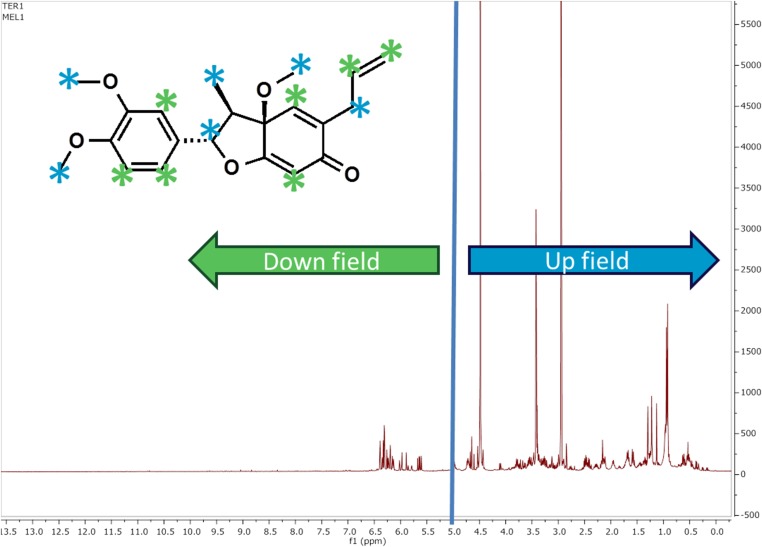
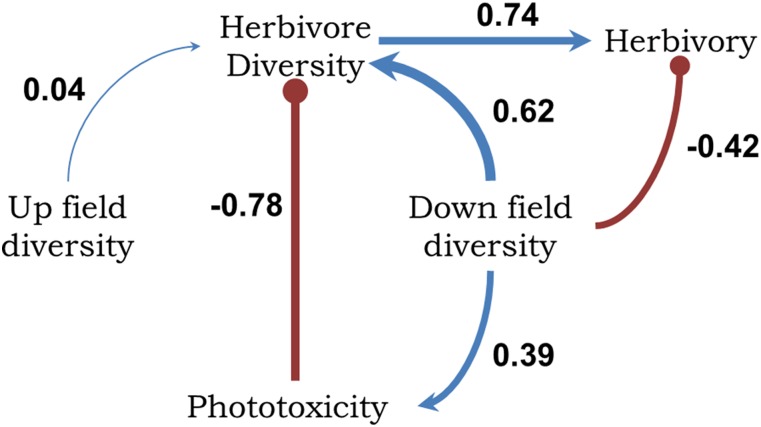
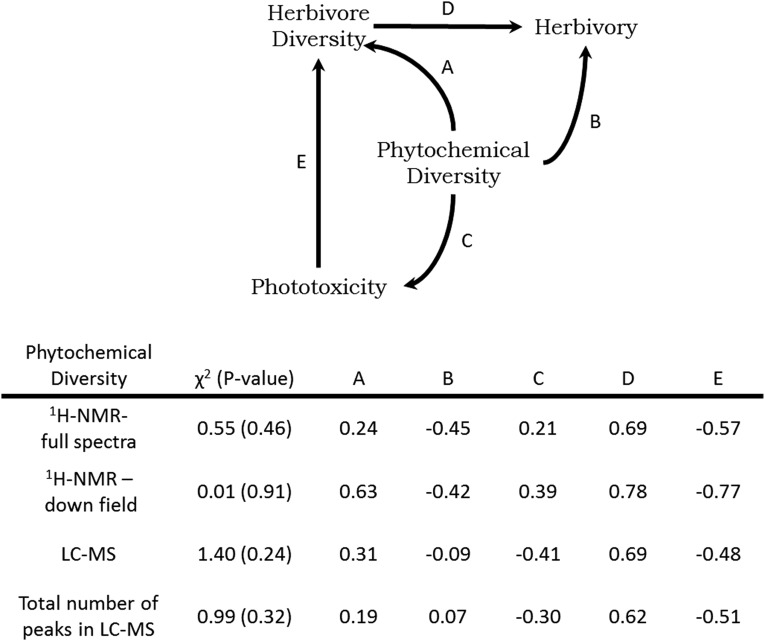
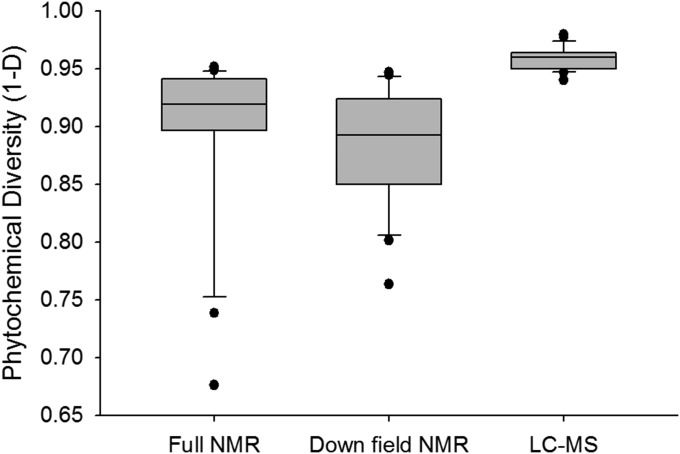
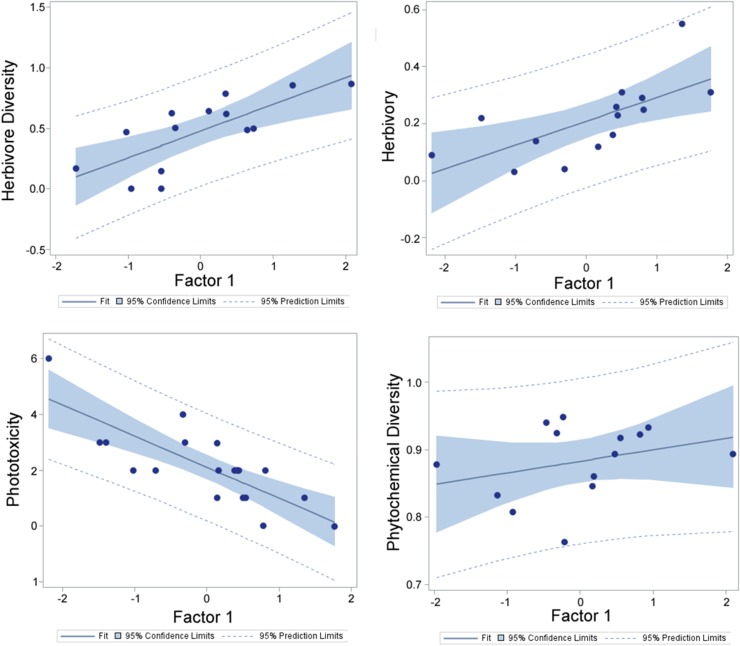
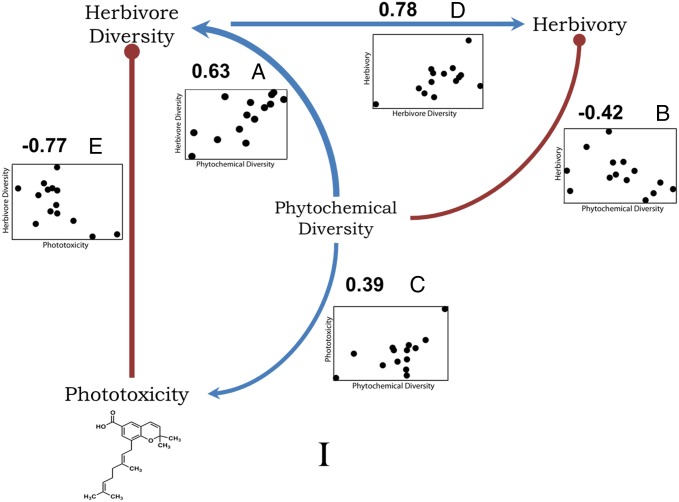
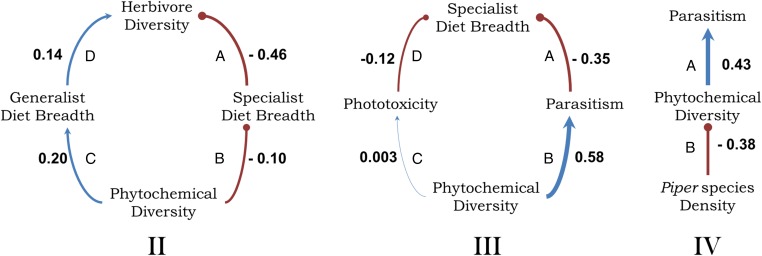
What are the ecological causes and consequences of variation in phytochemical diversity within and between plant taxa? Despite decades of natural products discovery by organic chemists and research by chemical ecologists, our understanding of phytochemically mediated ecological processes in natural communities has been restricted to studies of either broad classes of compounds or a small number of well-characterized molecules. Until now, no studies have assessed the ecological causes or consequences of rigorously quantified phytochemical diversity across taxa in natural systems. Consequently, hypotheses that attempt to explain variation in phytochemical diversity among plants remain largely untested. We use spectral data from crude plant extracts to characterize phytochemical diversity in a suite of co-occurring plants in the tropical genus Piper (Piperaceae). In combination with 20 years of data focused on Piper-associated insects, we find that phytochemical diversity has a direct and positive effect on the diversity of herbivores but also reduces overall herbivore damage. Elevated chemical diversity is associated with more specialized assemblages of herbivores, and the cascading positive effect of phytochemistry on herbivore enemies is stronger as herbivore diet breadth narrows. These results are consistent with traditional hypotheses that predict positive associations between plant chemical diversity, insect herbivore diversity, and trophic specialization. It is clear from these results that high phytochemical diversity not only enhances the diversity of plant-associated insects but also contributes to the ecological predominance of specialized insect herbivores.

Keywords: diet breadth; diversity; herbivore; plant defense; tritrophic.


Conflict of interest statement

The authors declare no conflict of interest.

Figures

Fig. 1.
Fig. 1.
Photographs include examples of Piper species and herbivores included in this study. (Top) The heat map summarizes the number of compounds in each class that have been discovered in the corresponding species; absent classes are shown in white, and more abundant compounds are depicted by darker colors. (A) Piper santi-felicis. (B) Piper multiplinervium. (C) Piper cenocladum. (D) Piper reticulatum. (E) Piper holdrigeanum. (F) Piper auritum. (G) Piper xanthostachym. (H) Piper peltatum. (I) Piper melanocladum. (J) Euclea plumgma (Limacodidae, host: 1 Piper sp. and 6 other species from different families). (K) Apatelodes erotina (Apatelodidae, hosts: 5 Piper spp. and 18 other species from different families). (L) Gonodonta latimacula (Erebidae, hosts: 3 Piper spp.). (M) Consul parariste jansoni (Nymphalidae, hosts: 3 Piper spp.). (N) Eois picalis (Geometridae, host: 1 Piper sp.). (O) Tarchon felderi (Apatelodidae, hosts: 8 Piper spp. and 40 other species from different families). (P) Eois nympha (Geometridae, hosts: 6 Piper spp.).
Fig. S1.
Fig. S1.
Null model with no causal assumptions regarding the effects of phytochemical diversity on ecological interactions associated with 14 Piper species. All pairwise relationships were unresolved (double-headed arrows; indicating a correlation rather than a causal relationship) except path D, which was necessary to provide 1 degree of freedom. Model fit: χ2 = 1.640, df = 1, P = 0.20.
Fig. S2.
Fig. S2.
Example of a 1H-NMR spectrum with downfield and upfield regions marked. Protons associated with the downfield and upfield regions are indicated in the structure by the color-coordinated asterisks.
Fig. S3.
Fig. S3.
Path model based on predicted relationships between phytochemical diversity (including both upfield diversity and downfield diversity) and associated arthropod parameters for Piper species (model fit: χ2 = 2.415, df = 3, P = 0.49). Relationship strengths are indicated by the standardized path coefficient; blue lines indicate positive effects, and red lines indicate negative effects.
Fig. S4.
Fig. S4.
Summary of path models using different measures of phytochemical diversity: diversity quantified from 1H-NMR using the full spectra (0.5–14.0 ppm), diversity quantified from the downfield region (5.0–14.0 ppm), LC-MS spectra, and a sum of the total number of peaks from LC-MS. The table indicates model fit (χ2) and the standardized path coefficients for associated causal relationships.
Fig. S5.
Fig. S5.
Box plots of phytochemical diversity calculated from full 1H-NMR spectra (0–14.0 ppm), the downfield region of the 1H-NMR spectrum (5–14 ppm), and LC-MS traces. Medians are represented by lines within the box plots, the boxes represent upper (75th) and lower (25th) quartiles, and the whiskers show the minimum and maximum observations of the data.
Fig. S6.
Fig. S6.
Linear regressions of herbivore diversity, herbivory, phototoxicity, and phytochemical diversity and their respective factor from a factor analysis.
Fig. 2.
Fig. 2.
Path model I based on predicted relationships between phytochemical diversity and associated arthropod parameters for Piper species. Standardized path coefficients are noted. Positive relationships are shown in blue with arrowheads indicating causality; negative relationships are indicated in red with bullet heads. Plots of the partial correlations for each path are shown with the dependent variable on the x axis and the response variable on the y axis. The data support hypothesized causal relationships between insect herbivore species diversity, phytochemical diversity, leaf area lost to herbivores, and phototoxicity in 14 Piper species (model fit: χ2 = 0.012, df = 1, P = 0.914).
Fig. 3.
Fig. 3.
Summary of the best-fitting path models based on predicted relationships between phytochemical diversity and herbivore diet breadth (model II) and parasitism rates (models III and IV) for Piper species. Each model used subsets of Piper host species for which all relevant data were available. Standardized path coefficients are noted. Positive relationships are indicated in blue with arrowheads indicating causality; negative relationships are indicated in red with bullet heads. Model II includes different diet breadths and quantifies associations between herbivore diversity, phytochemical diversity, and diet breadth of the herbivore community for 22 Piper species (model fit: χ2 = 0.1047, df = 2, P = 0.95). Greater phytochemical diversity drives greater levels of specialization and generalization, both of which contribute to higher herbivore diversity. For the subset of data that includes only Piper specialist caterpillars, model III quantifies associations between phytochemical diversity, phototoxicity, parasitism rates, and the number of Piper species that are hosts to the herbivore community for 13 Piper species (model fit: χ2 = 0.1676, df = 2, P = 0.92). In model IV, local Piper species density is included in a model of phytochemical diversity and specialist parasitism rates (20 species; model fit: χ2 = 0.040, df = 1, P = 0.84).

References

    1. Dyer LA, Parchman TL, Jeffrey CS, Richards LA. New dimensions of tropical diversity: An inordinate fondness for insect molecules, taxa, and trophic interactions. Curr Opin Insect Sci. 2014;2:14–19. - PubMed
    1. Firn RD, Jones CG. Natural products—A simple model to explain chemical diversity. Nat Prod Rep. 2003;20(4):382–391. - PubMed
    1. Ehrlich PR, Raven PH. Butterflies and plants: A study in coevolution. Evolution. 1964;18:586–608.
    1. Wilson JS, et al. Host conservatism, host shifts and diversification across three trophic levels in two Neotropical forests. J Evol Biol. 2012;25(3):532–546. - PubMed
    1. Crutsinger GM, et al. Plant genotypic diversity predicts community structure and governs an ecosystem process. Science. 2006;313(5789):966–968. - PubMed

Publication types

LinkOut - more resources