. 2015 Aug 19:14:322.
doi: 10.1186/s12936-015-0841-x.

Where have all the mosquito nets gone? Spatial modelling reveals mosquito net distributions across Tanzania do not target optimal Anopheles mosquito habitats

Affiliations

Where have all the mosquito nets gone? Spatial modelling reveals mosquito net distributions across Tanzania do not target optimal Anopheles mosquito habitats

Emily S Acheson et al. Malar J. .

Abstract

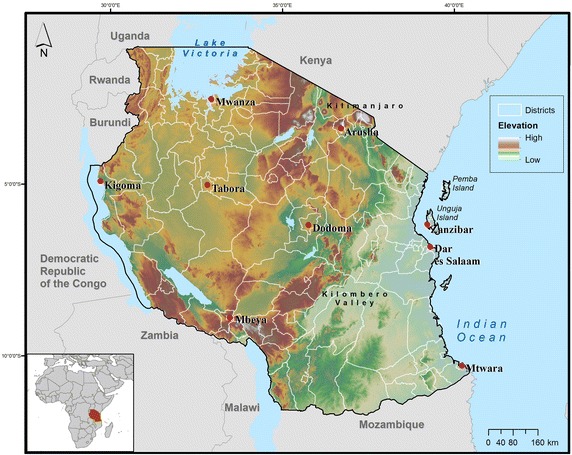
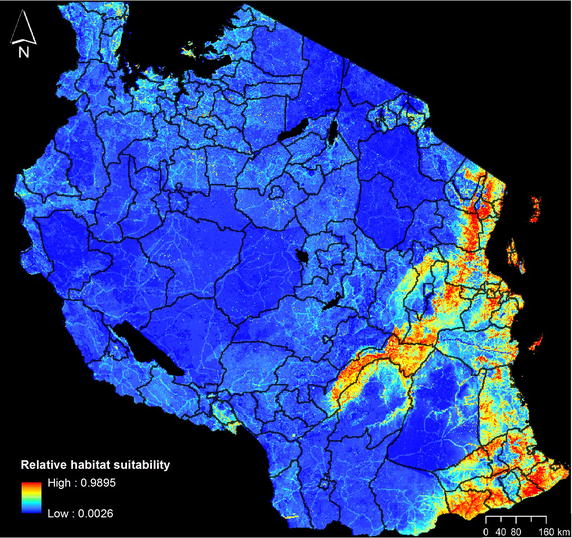
Background: Malaria remains the deadliest vector-borne disease despite long-term, costly control efforts. The United Republic of Tanzania has implemented countrywide anti-malarial interventions over more than a decade, including national insecticide-treated net (ITN) rollouts and subsequent monitoring. While previous analyses have compared spatial variation in malaria endemicity with ITN distributions, no study has yet compared Anopheles habitat suitability to determine proper allocation of ITNs. This study assesses where mosquitoes were most likely to thrive before implementation of large-scale ITN interventions in Tanzania and determine if ITN distributions successfully targeted those areas.

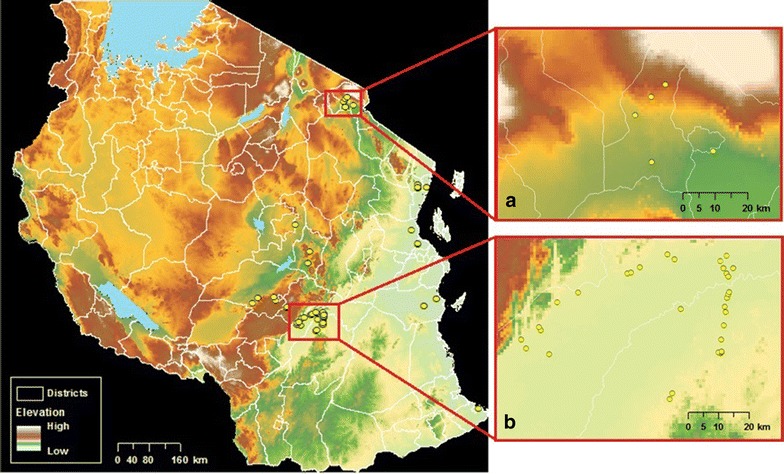
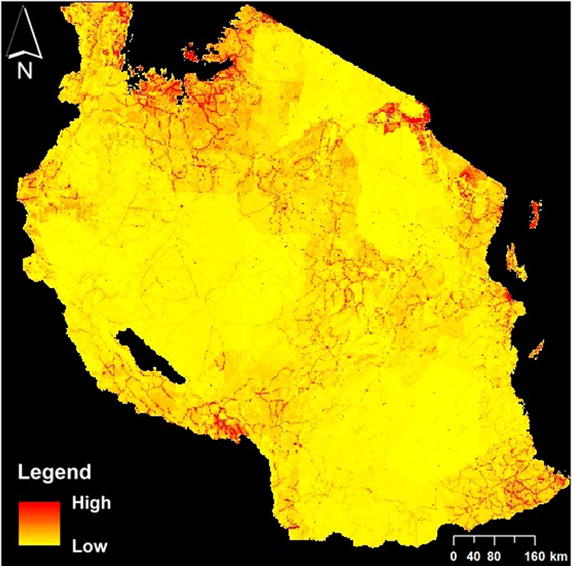
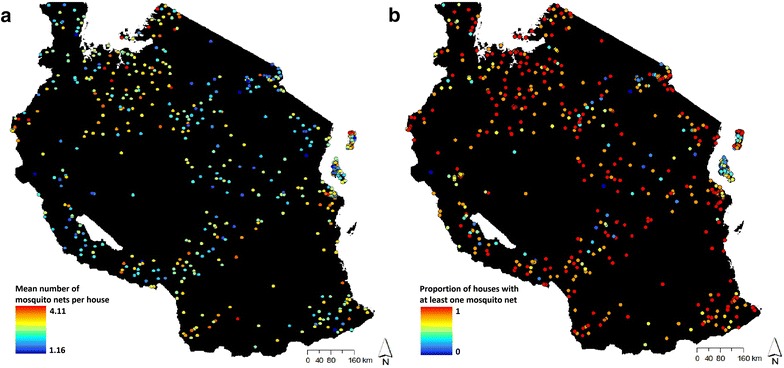
Methods: Using Maxent, a species distribution model was constructed relating anopheline mosquito occurrences for 1999-2003 to high resolution environmental observations. A 2011-2012 layer of mosquito net ownership was created using georeferenced data across Tanzania from the Demographic and Health Surveys. The baseline mosquito habitat suitability was compared to subsequent ITN ownership using (1) the average ITN numbers per house and (2) the proportion of households with ≥1 net to test whether national ITN ownership targets have been met and have tracked malaria risk.

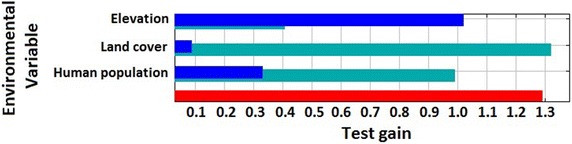
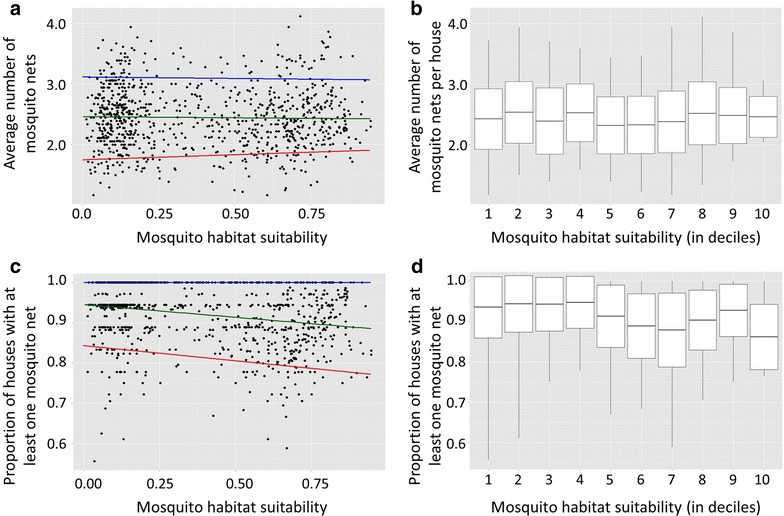
Results: Elevation, land cover, and human population distribution outperformed variants of temperature and Normalized Difference Vegetation Index (NDVI) in anopheline distribution models. The spatial distribution of ITN ownership across Tanzania was near-random spatially (Moran's I = 0.07). Householders reported owning 2.488 ITNs on average and 93.41 % of households had ≥1 ITN. Mosquito habitat suitability was statistically unrelated to reported ITN ownership and very weakly to the proportion of households with ≥1 ITN (R(2) = 0.051). Proportional ITN ownership/household varied relative to mosquito habitat suitability (Levene's test F = 3.0037). Quantile regression was used to assess trends in ITN ownership among households with the highest and lowest 10 % of ITN ownership. ITN ownership declined significantly toward areas with the highest vector habitat suitability among households with lowest ITN ownership (t = -3.38). In areas with lowest habitat suitability, ITN ownership was consistently higher.

Conclusions: Insecticide-treated net ownership is critical for malaria control. While Tanzania-wide efforts to distribute ITNs has reduced malaria impacts, gaps and variance in ITN ownership are unexpectedly large in areas where malaria risk is highest. Supplemental ITN distributions targeting prime Anopheles habitats are likely to have disproportionate human health benefits.


Figures

Fig. 1
Fig. 1
United Republic of Tanzania, detailed by districts and elevation. The map shows the 148 Demographic and Health Surveys “admin 2” district boundaries, as well as elevation, several major cities, and bordering countries. The inset map details Tanzania’s location within Africa
Fig. 2
Fig. 2
Map of 56 Anopheles occurrence points used in Maxent. Insets show clustering of biased sampled points around a Mount Kilimanjaro and b Kilombero Valley
Fig. 3
Fig. 3
Map of human population distribution from LandScan with pixel size of ~1 km2
Fig. 4
Fig. 4
The 573 raw georeferenced cluster points provided by the 2011–2012 DHS survey. Cluster points are colour coded to represent spatial variation in a average number of mosquito nets used per household or b the proportion of households with at least one mosquito net across Tanzania
Fig. 5
Fig. 5
Jackknife plot of testing gain for Maxent niche model building. Green bars represent test gain without the specified variable. Blue bars represent test gain with only the specified variable. The red bar represents the test gain with all variables included
Fig. 6
Fig. 6
Maxent output of relative Anopheles mosquito habitat suitability (n = 56). The habitat suitability map ranges from blue to red, with blue representing lowest predicted relative habitat suitability for Anopheles mosquitoes. The suitability map is overlaid with the “admin 2” districts of Tanzania. Predicted relative habitat suitability in many areas are coterminous with the LandScan human population data (e.g. the southeastern polygonal area of low habitat suitability corresponds substantially with the Selous Game Reserve, where human population approaches zero in most areas.)
Fig. 7
Fig. 7
Scatterplots and corresponding boxplots of mosquito net use as a function of mosquito habitat suitability. a Scatterplot of the average number of mosquito nets per house as a function of relative Anopheles habitat suitability with quantile regression and ordinary least squares (OLS) regression lines shown. The 0.9 quantile line is shown in blue, the ordinary least squares regression line is shown in green, and the 0.1 quantile line is shown in red. b Boxplot of mean and standard deviation of average number of mosquito nets used per house as a function of Anopheles relative habitat suitability, where habitat suitability is divided into deciles (e.g. 1 corresponds to lowest 10 %, etc.). Boxplot whiskers extend to the maximum and minimum values. c Scatterplot of the proportion of houses with mosquito nets as a function of relative Anopheles habitat suitability (i.e. houses with ≥1 mosquito net were assigned a value of 1; otherwise, 0), with quantile regression and ordinary least squares (OLS) regression lines shown. The 0.9 quantile line is shown in blue, the ordinary least squares regression line is shown in green, and the 0.1 quantile line is shown in red. d Boxplot of mean and standard deviation of the proportion of houses with mosquito nets as a function of relative Anopheles habitat suitability, where habitat suitability is divided into deciles

References

    1. WHO . World Malaria Report 2014. Geneva: World Health Organization; 2014.
    1. Kelly-Hope LA, Hemingway J, McKenzie FE. Environmental factors associated with the malaria vectors Anopheles gambiae and Anopheles funestus in Kenya. Malar J. 2009;8:268. doi: 10.1186/1475-2875-8-268. - DOI - PMC - PubMed
    1. Ernst KC, Adoka SO, Kowuor DO, Wilson ML, John CC. Malaria hotspot areas in a highland Kenya site are consistent in epidemic and non-epidemic years and are associated with ecological factors. Malar J. 2006;5:78. doi: 10.1186/1475-2875-5-78. - DOI - PMC - PubMed
    1. Kulkarni MA, Desrochers RE, Kerr JT. High resolution niche models of malaria vectors in northern Tanzania: a new capacity to predict malaria risk? PLoS One. 2010;5:e9396. doi: 10.1371/journal.pone.0009396. - DOI - PMC - PubMed
    1. Fuller DO, Ahumada ML, Quinones ML, Herrera S, Beier JC. Near-present and future distribution of Anopheles albimanus in Mesoamerica and the Caribbean Basin modeled with climate and topographic data. Int J Health Geogr. 2012;11:13. doi: 10.1186/1476-072X-11-13. - DOI - PMC - PubMed

Publication types

LinkOut - more resources