. 2015 Aug 17;210(4):565-82.
doi: 10.1083/jcb.201502107.

TopBP1 is required at mitosis to reduce transmission of DNA damage to G1 daughter cells

Affiliations

TopBP1 is required at mitosis to reduce transmission of DNA damage to G1 daughter cells

Rune Troelsgaard Pedersen et al. J Cell Biol. .

Abstract

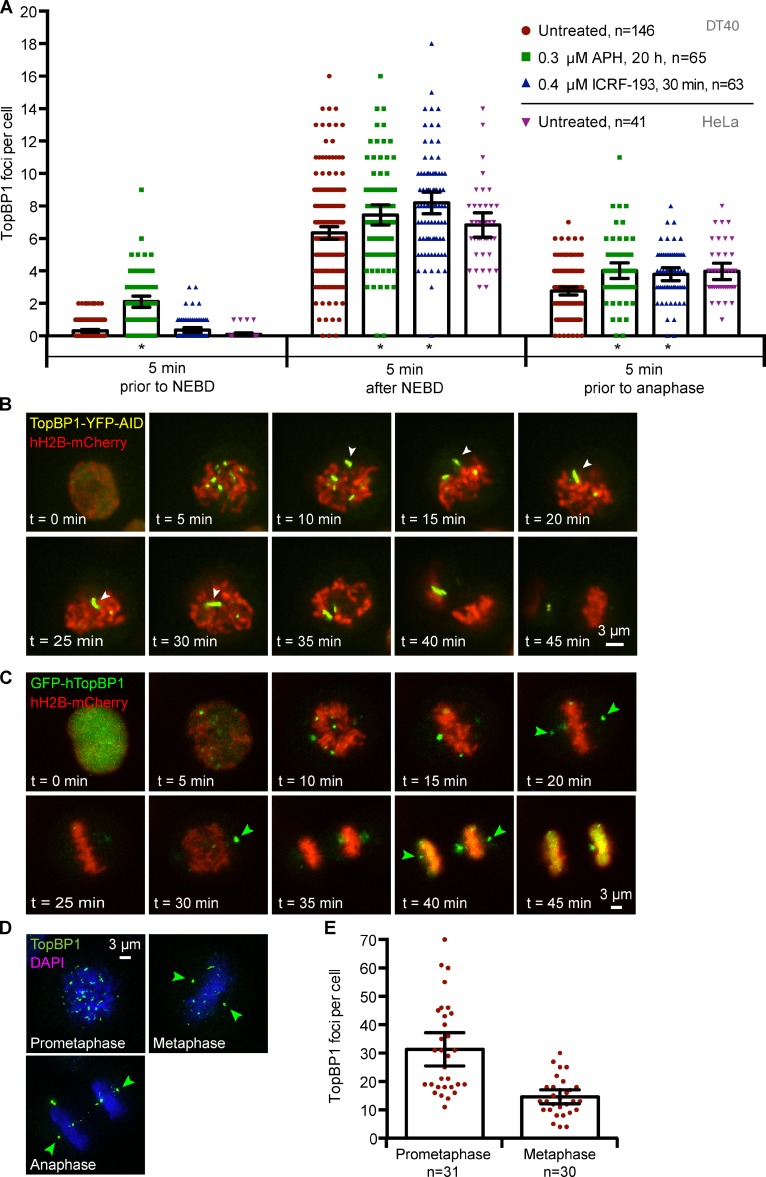
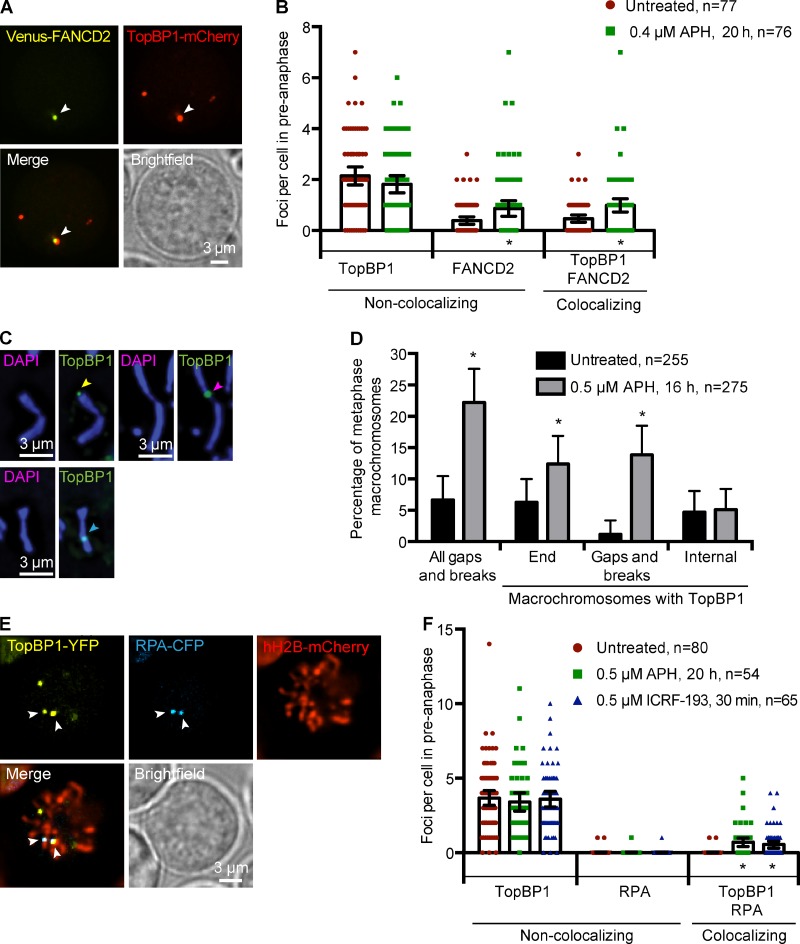
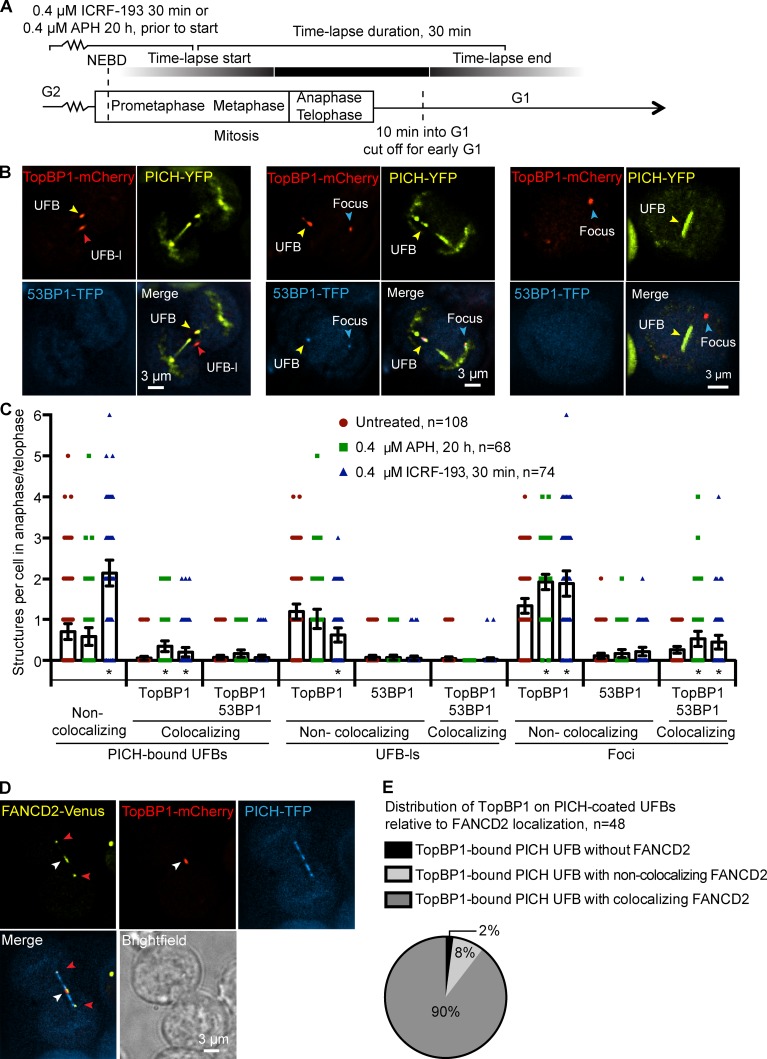
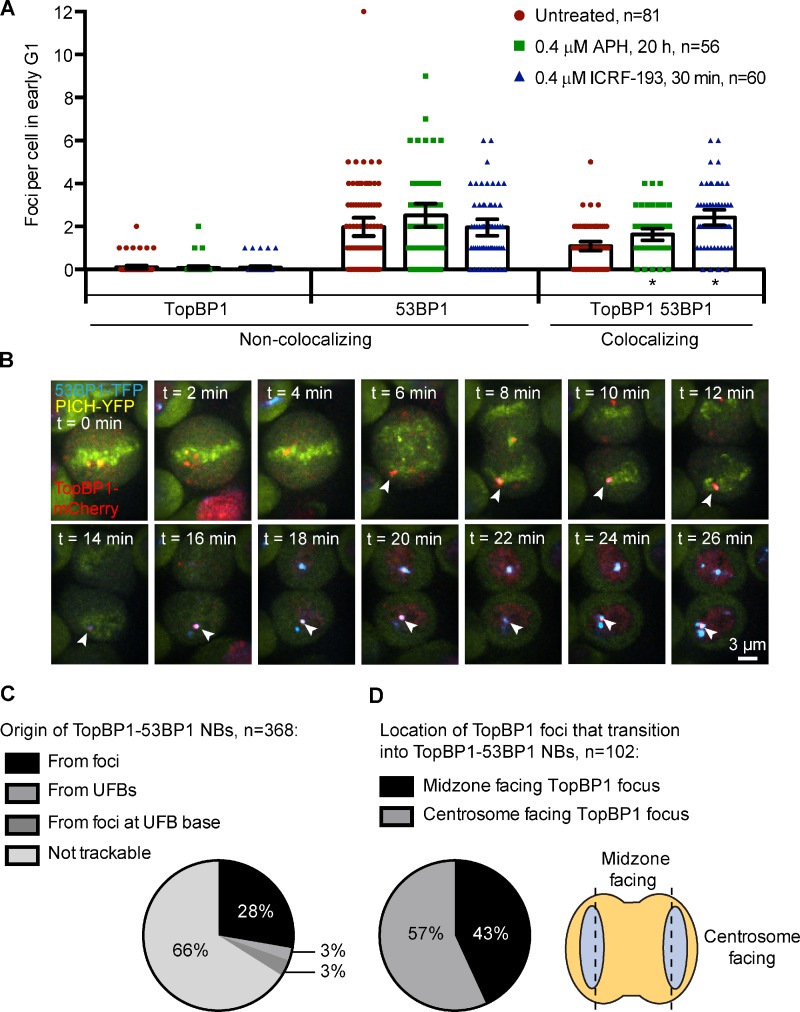
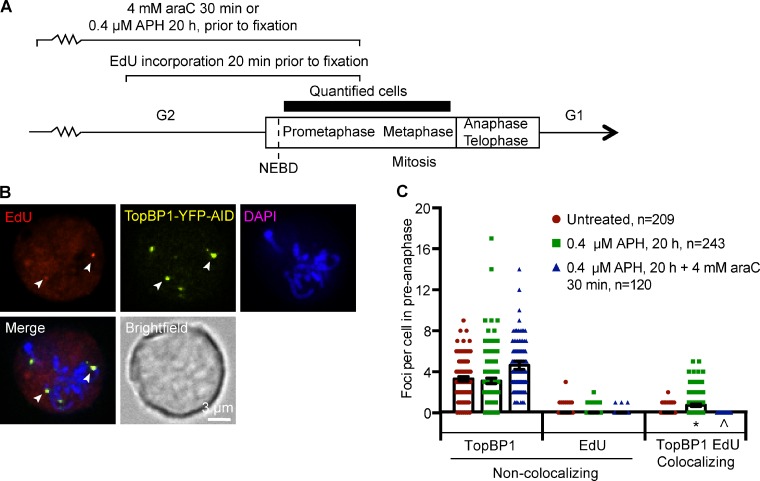
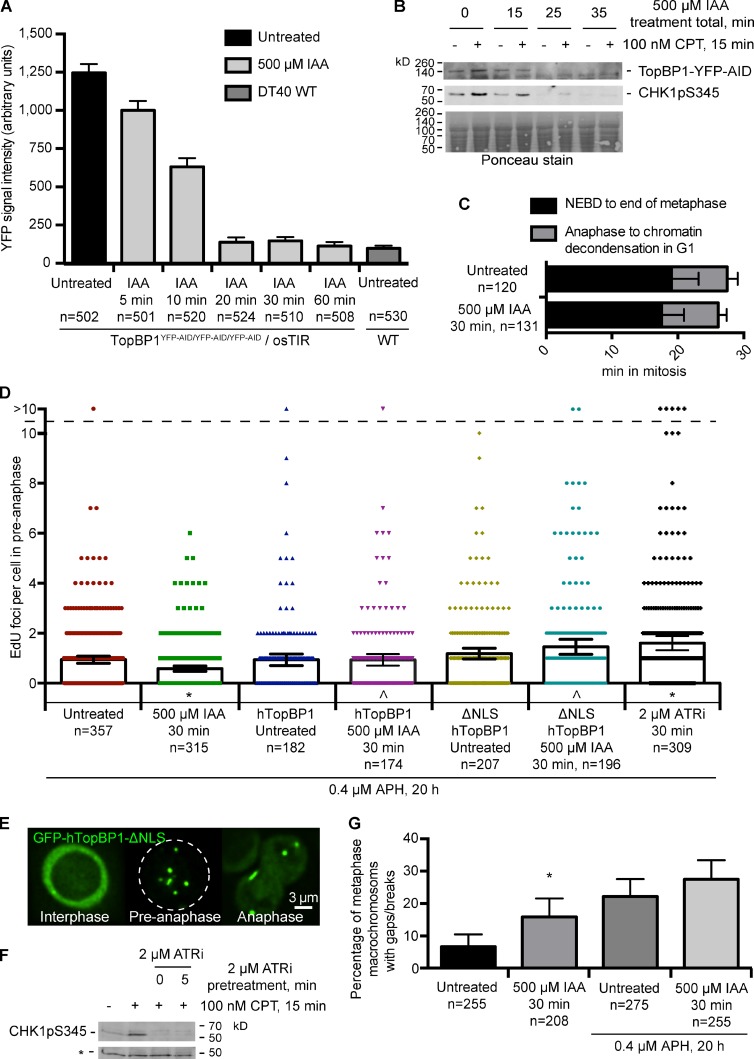
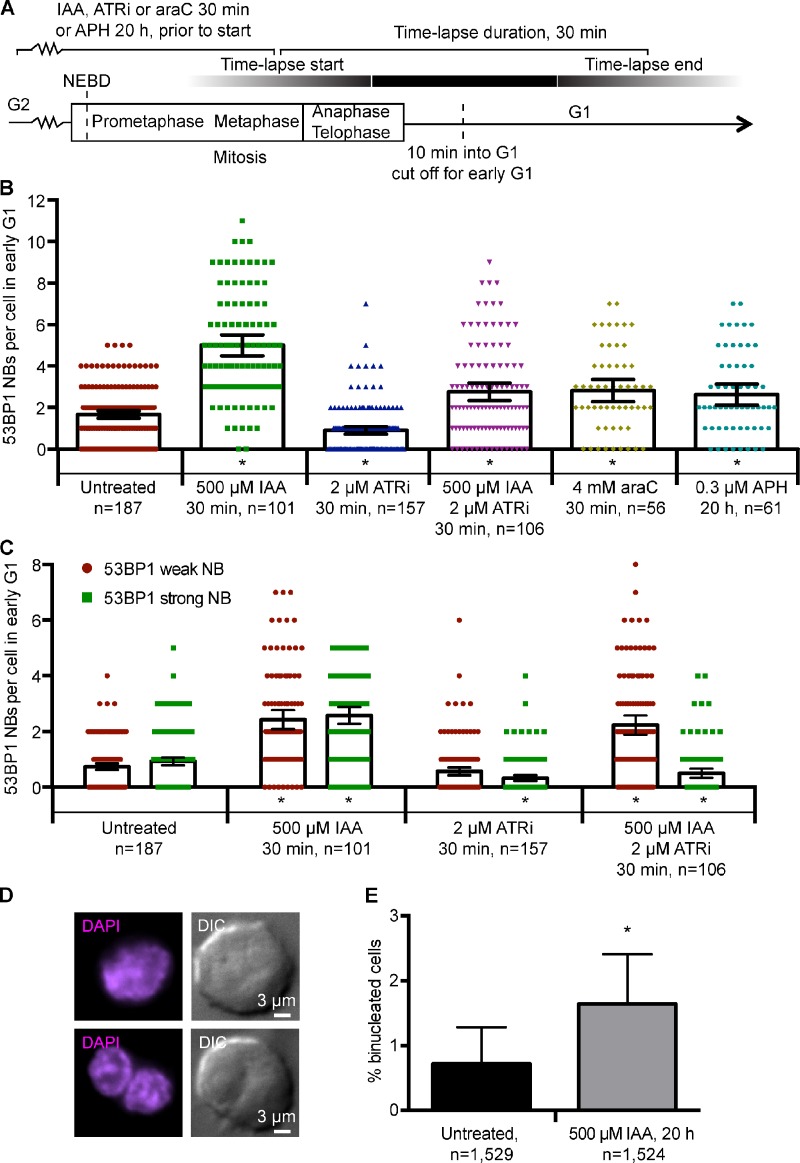
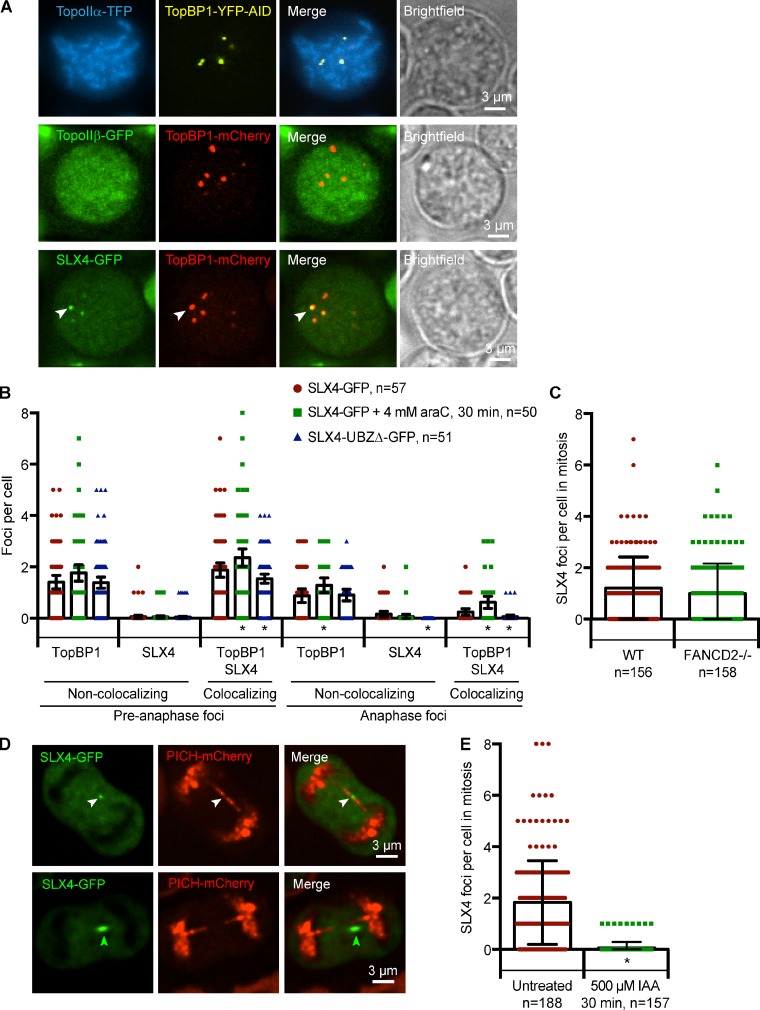
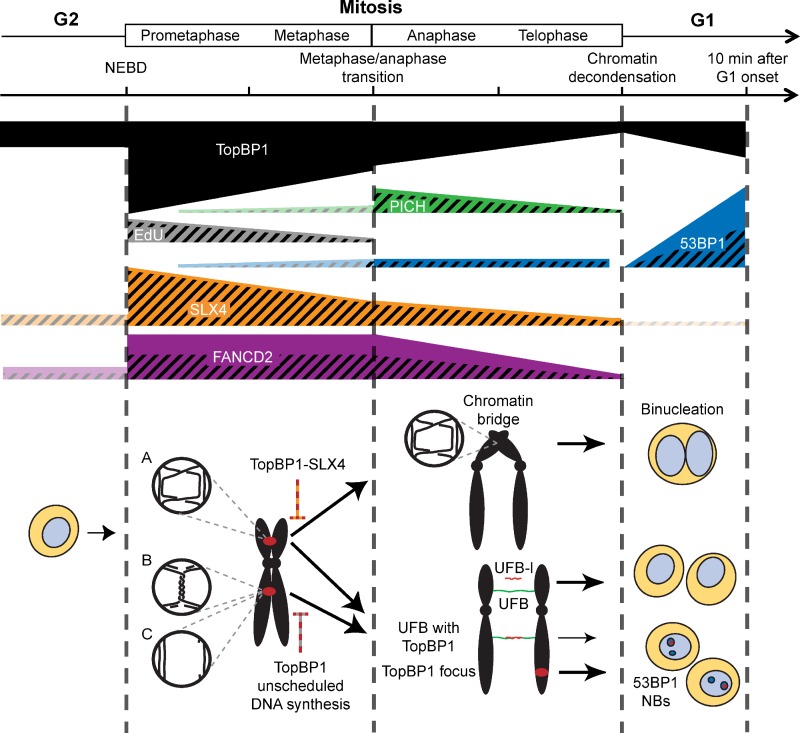
Genome integrity is critically dependent on timely DNA replication and accurate chromosome segregation. Replication stress delays replication into G2/M, which in turn impairs proper chromosome segregation and inflicts DNA damage on the daughter cells. Here we show that TopBP1 forms foci upon mitotic entry. In early mitosis, TopBP1 marks sites of and promotes unscheduled DNA synthesis. Moreover, TopBP1 is required for focus formation of the structure-selective nuclease and scaffold protein SLX4 in mitosis. Persistent TopBP1 foci transition into 53BP1 nuclear bodies (NBs) in G1 and precise temporal depletion of TopBP1 just before mitotic entry induced formation of 53BP1 NBs in the next cell cycle, showing that TopBP1 acts to reduce transmission of DNA damage to G1 daughter cells. Based on these results, we propose that TopBP1 maintains genome integrity in mitosis by controlling chromatin recruitment of SLX4 and by facilitating unscheduled DNA synthesis.


Figures

Figure 1.
Figure 1.
TopBP1 foci accumulate upon NEBD and gradually disappear during progression of mitosis. (A) Quantification of TopBP1 foci in mitosis in avian DT40 and human HeLa cells. The DT40 cell line RTP217 (TopBP1YFP-AID/YFP-AID/YFP-AID/53BP1TFP/WT/osTIR/hH2B-mCherry) and HeLa cells expressing GFP-hTopBP1 and hH2B-mCherry were imaged by time-lapse microscopy with a frequency of 5 min for 60 min. RTP217 was treated with 0.3 µM APH for 20 h, 0.4 µM ICRF-193 for 30 min, or 0.0125% DMSO (vol/vol, untreated) for 20 h before imaging. TopBP1 foci in each cell were scored 5 min before NEBD, 5 min after NEBD, and 5 min before anaphase. Asterisks indicate significant differences from the untreated (P < 0.05) and error bars represent 95% confidence intervals. The number of cells analyzed is indicated (n). (B) Representative time-lapse image sequence of a DMSO-treated RTP217 cell. White arrowheads indicate TopBP1 thread-like structure. (C) Representative time-lapse image sequence of an untreated HeLa cell expressing GFP-hTopBP1 and hH2B-mCherry. Green arrowheads indicate centrosome localization of TopBP1. (D) Representative images of HeLa cells immunostained for TopBP1. Green arrowheads indicate centrosome localization of TopBP1. (E) Quantification of TopBP1 structures in prometaphase and metaphase cells from the experiment described in D.
Figure 2.
Figure 2.
TopBP1 colocalizes with FANCD2 in mitosis and binds to gaps and breaks on metaphase chromosomes. (A) Representative images of the APH-treated DT40 cell line, RTP284 (PICHTFP/WT/FANCD2Venus/WT/TopBP1mCherry/WT/WT). White arrowheads indicate colocalization of FANCD2 and TopBP1. (B) Quantification of FANCD2 and TopBP1 foci in live cell images. Images were captured 20 h after the addition of 0.4 µM APH or 0.0125% DMSO (vol/vol, untreated). TopBP1 and FANCD2 foci in preanaphase cells were quantified. (C) Representative images of TopBP1 localization on APH-treated metaphase macrochromosomes. Arrowheads indicate localization of TopBP1 foci on metaphase macrochromosomes at the end (yellow), a gap/break (green), or internal (pink). (D) Quantification of APH-induced gaps and breaks on metaphase macrochromosomes. Metaphase spreads with the DT40 cell line RTP164 (TopBP1YFP-AID/YFP-AID/YFP-AID/osTIR) treated for 16 h with 0.5 µM APH or 0.0125% DMSO (vol/vol, untreated) before immunofluorescence staining against TopBP1-YFP-AID. All macrochromosomes were analyzed for gaps or breaks and TopBP1 foci localization. (E) Representative images of the APH-treated DT40 cell line RTP156 (TopBP1YFP/WT/WT/RPACFP/WT/hH2B-mCherry). Arrowheads indicate colocalization of RPA and TopBP1. (F) Quantification of RPA and TopBP1 foci in live cell images. RTP156 cells were treated with 0.5 µM APH for 20 h, 0.5 µM ICRF-193 for 30 min, or 0.0125% DMSO (vol/vol, untreated) for 20 h before imaging. TopBP1 and RPA foci in preanaphase cells were quantified. For all graphs in this figure, asterisks indicate significant differences from the untreated (P < 0.05) and error bars represent 95% confidence intervals. The number of cells analyzed is indicated (n).
Figure 3.
Figure 3.
TopBP1 binds several distinct structures in anaphase/telophase. (A) Schematic representation of the experimental setup used in C, showing the duration of time-lapse microscopy and drug treatments relative to cell cycle phase. (B) Representative images of the DT40 cell line RTP252 (PICHYFP/YFP/53BP1TFP/WT/TopBP1mCherry/WT/WT). (B, left) A DMSO-treated cell. The yellow arrowheads indicate the UFB bound by TopBP1 and the red arrowheads indicate a TopBP1 UFB-l. (B, middle) An APH-treated cell. Yellow arrowheads indicate 53BP1 colocalization with TopBP1 on a PICH-coated UFB and blue arrowheads indicate a chromatin-associated TopBP1 focus. (B, right) A DMSO-treated cell. Yellow arrowheads indicate a UFB. Blue arrowheads indicate a chromatin-associated TopBP1 focus. (C) Quantification of TopBP1 and 53BP1 structures in mitosis. Cells were imaged by time-lapse microscopy with a frequency of 2 min for 30 min. Cells were monitored from anaphase through telophase and structures were scored in each cell. The maximum number of structures visible at one time point was noted as representative for the entire anaphase of a given cell. Cells were treated with 0.4 µM APH for 20 h, 0.4 µM ICRF-193 for 30 min, or 0.0125% DMSO (vol/vol, untreated) for 20 h before imaging. Asterisks indicate significant differences from the untreated (P < 0.05) and error bars represent 95% confidence intervals. The number of cells analyzed is indicated (n). (D) Representative live cell images of an APH-treated DT40 cell line RTP284 (PICHTFP/WT/FANCD2Venus/WT/TopBP1mCherry/WT/WT). White arrowheads indicate colocalization between FANCD2 and TopBP1 on a PICH-coated UFB. Red arrowheads indicate FANCD2 sister foci at the terminus of a UFB. (E) Pie chart of the localization of FANCD2 foci relative to TopBP1-bound PICH UFBs after treatment with 0.3 µM APH for 20 h. The number of TopBP1-bound UFBs analyzed is indicated (n).
Figure 4.
Figure 4.
Mitotic TopBP1 foci can transition into 53BP1 NBs in G1. (A) Quantification of TopBP1 and 53BP1 structures in G1. Time-lapse microscopy of the DT40 cell line RTP252 (PICHYFP/YFP/53BP1TFP/WT/TopBP1mCherry/WT/WT) with an imaging frequency of 2 min for 30 min. Cells were monitored from anaphase into early G1, which was defined as the first 10 min after chromatin decondensation. The maximum number of structures visible at one time point was noted as representative for the entire G1 of a given cell. Cells were treated with 0.4 µM APH for 20 h, 0.4 µM ICRF-193 for 30 min, or 0.0125% DMSO (vol/vol, untreated) for 20 h before imaging. Asterisks indicate significant differences from the untreated (P < 0.05) and error bars represent 95% confidence intervals. The number of cells analyzed is indicated (n). (B) Representative time-lapse image sequence of a DMSO-treated cell. Arrowheads mark a TopBP1 focus that turns into a 53BP1 NB in G1. (C) Pie chart of the anaphase/telophase TopBP1 structures that lead to 53BP1 NBs in G1. TopBP1 foci that colocalized with 53BP1 NBs were tracked as far back as possible from G1 into anaphase/telophase. The number of foci analyzed is indicated (n). (D) Pie chart showing the distribution on anaphase chromatin of the TopBP1 foci leading to 53BP1 NBs in G1. The number of foci analyzed is indicated (n). The schematic depicts the scoring of foci into the two categories: midzone or centrosome facing. Chromosome masses are indicated in blue.
Figure 5.
Figure 5.
TopBP1 colocalizes with DNA synthesis in mitosis. (A) Schematic representation of the experimental setup used in B, showing the duration of drug and EdU treatments relative to cell cycle phase and time points for fixation. (B) Representative images of fixed DT40 cells RTP164 (TopBP1YFP-AID/YFP-AID/YFP-AID/osTIR) treated with 0.4 µM APH for 20 h and pulse labeled with 20 µM EdU for 20 min. White arrowheads indicate TopBP1 foci colocalizing with EdU. (C) Quantification of EdU and TopBP1 foci in prometaphase and metaphase cells. Before imaging, cells were treated with 0.4 µM APH for 20 h, 0.0125% DMSO (vol/vol, untreated) for 20 h, or 0.4 µM APH for 20 h followed by 4 mM araC for 30 min. Before fixation, cells were pulse labeled with 20 µM EdU for 20 min. TopBP1 and EdU foci were quantified in prometaphase and metaphase identified based on chromatin condensation and alignment. Asterisks indicate significant differences from the untreated and the caret indicates significant differences from the APH-treated (P < 0.05). Error bars represent 95% confidence intervals. The number of cells analyzed is indicated (n).
Figure 6.
Figure 6.
Depletion of TopBP1 reduces EdU incorporation in mitotic cells. (A) Quantification of TopBP1 depletion kinetics. Live cell imaging of the DT40 cell line RTP164 (TopBP1YFP-AID/YFP-AID/YFP-AID/osTIR) and DT40 WT after addition of 500 µM IAA or 0.2% EtOH (vol/vol, untreated). The YFP intensity of cells was measured in Volocity and the average background was subtracted from all images. (B) Immunoblots of DT40 extracts to detect TopBP1-YFP-AID (top) or CHK1-pS345 (middle) in samples withdrawn at the indicated time points after exposure to 100 nM CPT and/or 500 µM IAA. CPT was added 15 min before harvest. Ponceau staining is shown as a control for equal loading (bottom). (C) Quantification of duration of mitosis in a DT40 cell. RTP217 (TopBP1YFP-AID/YFP-AID/YFP-AID/53BP1TFP/WT/osTIR/hH2B-mCherry) and RTP292 (hH2B-mCherry) were imaged by time-lapse microscopy with an imaging frequency of 1 min for 60 min after addition of 500 µM IAA or 0.2% EtOH (vol/vol, untreated) 30 min before NEBD. With hH2B-mCherry as a chromatin marker, time from NEBD to late metaphase, and from early anaphase to chromatin decondensation in G1 was recorded for each cell. (D) Quantification of EdU foci after TopBP1 depletion. DT40 cells RTP164 (TopBP1YFP-AID/YFP-AID/YFP-AID/osTIR), RTP317 (TopBP1YFP-AID/YFP-AID/YFP-AID/osTIR/human GFP-TopBP1), or RTP368 (TopBP1YFP-AID/YFP-AID/YFP-AID/osTIR/human GFP-TopBP1-ΔNLS) were treated with 0.4 µM APH for 20 h. Next, the cells were treated with either 0.2% EtOH (vol/vol), 500 µM IAA, 4 mM araC, or 2 µM ATRi for 30 min and simultaneously pulse labeled with 20 µM EdU for the last 20 min before fixation and staining. EdU foci in prometaphase and metaphase cells were quantified. Asterisks indicate significant differences from the untreated (P < 0.05) and carets indicate significant differences between IAA-treated RTP164 and RTP317 or RTP368 (P < 0.05). (E) Representative live cell images of RTP368 at different cell cycle stages. (F) Immunoblot of DT40 extracts to detect CHK1-pS345. Where indicated, 100 nM CPT was added 15 min before harvest. 2 µM ATRi was added either concomitantly (0 min pretreatment) or 5 min before CPT as indicated. A cross-reacting band (asterisk) is shown as a loading control for the immunoblot. (G) Quantification of APH-induced or TopBP1 depletion–induced gaps and breaks on metaphase macrochromosomes. Metaphase spreads with the DT40 cell line RTP164 (TopBP1YFP-AID/YFP-AID/YFP-AID/osTIR) treated for 16 h with 0.5 µM APH or 0.0125% DMSO (vol/vol, untreated) before a pulse with either 0.2% EtOH (vol/vol) or 500 µM IAA for 30 min and subsequent immunofluorescence staining against TopBP1-YFP-AID. Images were captured and all macrochromosomes were analyzed for gaps or breaks. Asterisks indicate significant differences from the untreated (P < 0.05). For graphs in this figure, error bars represent 95% confidence intervals in A, D, and F and standard deviation in C. The minimum number of cells analyzed is indicated (n).
Figure 7.
Figure 7.
Depletion of TopBP1 in mitosis induces 53BP1 NBs in the next G1. (A) Schematic representation of the experimental setup, showing the duration of time-lapse microscopy and drug treatments relative to cell cycle phase. (B) Quantification of 53BP1 NBs in G1. Time-lapse microscopy of DT40 cells RTP217 (TopBP1YFP-AID/YFP-AID/YFP-AID/53BP1TFP/WT/osTIR/hH2B-mCherry) with an imaging frequency of 2 min for 30 min total. Cells were treated, alone or in combination, with 0.2% EtOH (vol/vol, untreated), 500 µM IAA, 2 µM ATRi, or 4 mM araC for 30 min or 0.3 µM APH for 20 h. Cells were monitored from anaphase to early G1, defined as the first 10 min after chromatin decondensation. The maximum number of structures visible at one time point was noted as representative for the entire G1 of a given cell. (C) Quantification of the fluorescence intensity of 53BP1 NBs in early G1. Images from the experiment in B were quantified in Volocity software. Strong NB denotes high-intensity structures and weak NB denotes low-intensity structures. (D) Representative images of a normal and a binucleated cell after treatment with 0.2% EtOH for 20 h. (E) Quantification of binucleated cells after TopBP1 depletion. The DT40 cell line RTP164 (TopBP1YFP-AID/YFP-AID/YFP-AID/osTIR) was treated with 500 µM IAA or 0.2% EtOH (vol/vol, untreated) for 20 h and fixed. For all graphs in this figure, asterisks indicate significant differences from the untreated (P < 0.05) and error bars represent 95% confidence intervals. The number of cells analyzed is indicated (n).
Figure 8.
Figure 8.
TopBP1 colocalizes with SLX4 in mitosis. (A) Representative images of TopBP1 in prometaphase cells with either Topo IIα, Topo IIβ, or SLX4. Localization of TopBP1 and Topo IIα, Topo IIβ, or SLX4 was examined from prometaphase to telophase in 40, 47, and 57 time-lapse videos, respectively. Images were selected from time-lapse microscopy experiments with the following cell lines: RTP315 (TopBP1YFP-AID/YFP-AID/YFP-AID/Topo IIαTFP/WT/osTIR), RTP328 (TopBP1mCherry/WT/Topo IIβGFP/WT), or RTP302 (TopBP1mCherry/WT/SLX4-GFP). RTP315, RTP328, and RTP302 were subjected to time-lapse microscopy with an imaging frequency of 2 min for 30 min. Arrowheads indicate a TopBP1 focus colocalizing with SLX4. (B) Quantification of SLX4 and TopBP1 structures in the cell lines RTP302 and RTP305 (TopBP1mCherry/WT/SLX4-UBZΔ-GFP), using the experimental setup as shown in Fig. 3 A. Cells were incubated with or without 4 mM araC for 30 min before the start of the time-lapse experiments, and monitored from prometaphase to telophase. The maximum number of structures visible at one time point was noted as representative for preanaphase or anaphase of a given cell. (C) Quantification of SLX4 foci in live cell images of the DT40 cell line RTP302 and RTP349 (SLX4-GFP/FANCD2−/−). SLX4 structures in mitotic cells were quantified. (D) Representative images of a PICH-coated UFB bound by SLX4 and a SLX4-bound UFB-l. Images were captured with the following cell line: RTP335 (PICHmCherry/mCherry/SLX4-GFP). White arrowheads indicate a UFB bound by SLX4. Green arrowheads indicate an SLX4 UFB-l. (E) Quantification of SLX4 foci in live cell images of the DT40 cell line RTP319 (TopBP1YFP-AID/YFP-AID/YFP-AID/SLX4-GFP/osTIR). Images were captured 30 min after addition of 500 µM IAA. SLX4 structures in mitotic cells were quantified. For all graphs in this figure, asterisks indicate significant differences from the untreated (P < 0.05) and error bars represent 95% confidence intervals. The number of cells analyzed is indicated (n).
Figure 9.
Figure 9.
Model for TopBP1 localization and function at mitosis. (top) Overview of TopBP1 structures through mitosis based on our collective quantitative and qualitative data. Bar thicknesses are scaled to reflect the number of foci at a given time point where data were available. Hatched areas mark colocalization with TopBP1. (bottom) Hypothetical model for the functional role of TopBP1 in mitosis. In prometaphase, the sister chromatids remain interlinked by recombination intermediates (A) or unreplicated regions (B). Post-replicative gaps may also persist (C). TopBP1 (red ovals) may be recruited to these structures to facilitate their processing both by facilitating DNA synthesis to fill in unreplicated regions/post-replicative gaps as well as mediating resolution of Holliday junctions by SLX4. Resolution of Holliday junctions prevents formation of chromatin bridges, which may lead to mitotic catastrophe. If repair is not completed before anaphase, TopBP1 persists on DNA as chromatin-associated foci or TopBP1-bound UFBs (green/red thread). Both such structures can turn into 53BP1 NBs (blue ovals) in G1. TopBP1 is also observed on UFB-ls devoid of PICH (red thread). However, TopBP1 UFB-ls never transition into 53BP1 NBs. Likewise, PICH-covered UFBs devoid of TopBP1 (green thread) do not transition into 53BP1 NBs.

References

    1. Arakawa H., Lodygin D., and Buerstedde J.M.. 2001. Mutant loxP vectors for selectable marker recycle and conditional knock-outs. BMC Biotechnol. 1:7 10.1186/1472-6750-1-7 - DOI - PMC - PubMed
    1. Bai L., Michael W.M., and Yan S.. 2014. Importin β-dependent nuclear import of TopBP1 in ATR-Chk1 checkpoint in Xenopus egg extracts. Cell. Signal. 26:857–867. 10.1016/j.cellsig.2014.01.006 - DOI - PMC - PubMed
    1. Bartkova J., Horejsí Z., Koed K., Krämer A., Tort F., Zieger K., Guldberg P., Sehested M., Nesland J.M., Lukas C., et al. . 2005. DNA damage response as a candidate anti-cancer barrier in early human tumorigenesis. Nature. 434:864–870. 10.1038/nature03482 - DOI - PubMed
    1. Baumann C., Körner R., Hofmann K., and Nigg E.A.. 2007. PICH, a centromere-associated SNF2 family ATPase, is regulated by Plk1 and required for the spindle checkpoint. Cell. 128:101–114. 10.1016/j.cell.2006.11.041 - DOI - PubMed
    1. Bergoglio V., Boyer A.S., Walsh E., Naim V., Legube G., Lee M.Y., Rey L., Rosselli F., Cazaux C., Eckert K.A., and Hoffmann J.S.. 2013. DNA synthesis by Pol η promotes fragile site stability by preventing under-replicated DNA in mitosis. J. Cell Biol. 201:395–408. 10.1083/jcb.201207066 - DOI - PMC - PubMed

Publication types