. 2015 Jul 27:6:383.
doi: 10.3389/fimmu.2015.00383. eCollection 2015.

eIF2α Confers Cellular Tolerance to S. aureus α-Toxin

Affiliations

eIF2α Confers Cellular Tolerance to S. aureus α-Toxin

Gisela von Hoven et al. Front Immunol. .

Abstract

We report on the role of conserved stress-response pathways for cellular tolerance to a pore forming toxin. First, we observed that small molecular weight inhibitors including of eIF2α-phosphatase, jun-N-terminal kinase (JNK), and PI3-kinase sensitized normal mouse embryonal fibroblasts (MEFs) to the small pore forming S. aureus α-toxin. Sensitization depended on expression of mADAM10, the murine ortholog of a proposed high-affinity receptor for α-toxin in human cells. Similarly, eIF2α (S51A/S51A) MEFs, which harbor an Ala knock-in mutation at the regulated Ser51 phosphorylation site of eukaryotic translation initiation factor 2α, were hyper-sensitive to α-toxin. Inhibition of translation with cycloheximide did not mimic the tolerogenic effect of eIF2α-phosphorylation. Notably, eIF2α-dependent tolerance of MEFs was toxin-selective, as wild-type MEFs and eIF2α (S51A/S51A) MEFs exhibited virtually equal sensitivity to Vibrio cholerae cytolysin. Binding of S. aureus α-toxin to eIF2α (S51A/S51A) MEFs and toxicity in these cells were enhanced as compared to wild-type cells. This led to the unexpected finding that the mutant cells carried more ADAM10. Because basal phosphorylation of eIF2α in MEFs required amino acid deprivation-activated eIF2α-kinase 4/GCN2, the data reveal that basal activity of this kinase mediates tolerance of MEFs to α-toxin. Further, they suggest that modulation of ADAM10 is involved. During infection, bacterial growth may cause nutrient shortage in tissues, which might activate this response. Tolerance to α-toxin was robust in macrophages and did not depend on GCN2. However, JNKs appeared to play a role, suggesting differential cell type and toxin selectivity of tolerogenic stress responses. Understanding their function or failure will be important to comprehend anti-bacterial immune responses.

Keywords: EIF2AK4; MAPK; S. aureus α-toxin; cellular tolerance; pore forming toxins.


Figures
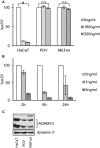
Figure 1
Figure 1
Wild-type MEFs are tolerant to α-toxin. (A) HaCaT cells (human keratinocytes), PDV cells (murine keratinocytes), or MEFs wt cells (mouse embryonal fibroblasts) were treated or not with α-toxin. Cellular ATP levels were determined after 2 h; data are percent of untreated controls; mean values ±SE; n ≥ 4; asterisk denotes p ≤ 0.05. (B) MEFs wt cells were treated with indicated doses of pVCC and cellular ATP levels were determined after 2, 6, or 24 h; shown are percent of untreated controls; mean values ±SE; n = 3. (C) Cell lysates of wt, PDV, and HaCaT were analyzed by Western blot for ADAM10 and dynamin II (loading control).
Figure 2
Figure 2
Inhibitors of various pathways sensitize MEFs to α-toxin. (A) wt cells were treated as indicated either with single inhibitors or combinations of two inhibitors listed below and treated with 10 μg/ml α-toxin. Cellular ATP levels were determined after 2 h; data are percent of untreated controls; shown are mean values for single inhibitors ±SE with n ≥ 6, or mean values of n ≥ 2 for combinations of inhibitors, SE was <30% throughout. Inhibitor concentrations: Salubrinal (40 μM), Dynasore (80 μM), Ly29400L (100 μM), SB203580 (20 μM), Cerulenin (20 μM), Cytochalasin D (20 μM), and JNK3XIISR3576 (10 μM). (B) MEFs wt were treated with indicated doses of JNK3XIISR3576 and incubated with 10 μg/ml α-toxin. Cellular ATP levels were determined after 2 h; data are percent of controls treated with similar concentrations of JNK3XIISR3576 but not treated with α-toxin; mean values ±SE; n ≥ 3. (C) MEFs wt or MEFs ADAM10−/− (mouse embryonal fibroblasts) were pretreated with 40 μM Salubrinal and 80 μM Dynasore or solvent alone for 30 min and treated or not with indicated doses of α-toxin. ATP levels were determined after 2 h; shown are percent of untreated controls; mean values ±SE; n = 3; two asterisks denote p-values ≤0.001.
Figure 3
Figure 3
Dysregulation of eIF2α-phosphorylation increases sensitivity for α-toxin. (A) MEFs eIF2αS51A/S51A, MEFs GCN2−/−, MEFs Ppp1r15b−/−, or MEFs EeF2K−/− were treated or not with 10 μg/ml α-toxin. ATP levels were determined after 2 h; shown are percent of untreated controls; mean values ±SE; n ≥ 4. Black bars show data with MEFs cell variants as indicated; white bars corresponding control cells; two asterisks denote p-values ≤0.001. (B) MEFs wt or eIF2αS51A/S51A were treated, or not with indicated doses of α-toxin. Cellular ATP levels were determined after 2 h; data are percent of untreated control; mean values ±SE; n = 5; asterisk: p = 0.026. (C) MEFs wt or MEFs eIF2αS51A/S51A treated or not with indicated doses of pVCC. Cellular ATP levels were determined after 2 h; data are percent of untreated control; mean values ±SE; n = 3. (D) MEFs wt or MEFs eIF2αS51A/S51A were cultured in standard media or in presence of β-ME and additional non-essential amino acids and treated with 10 μg/ml α-toxin for 48 h, stained with Propidium iodide and subsequently frequency of Sub-G1-DNA was determined; data show percent of untreated controls; mean values ±SE; n = 3; asterisk denotes p ≤ 0,05.
Figure 4
Figure 4
α-toxin causes translational arrest in MEFs eIF2αS51A/S51A. Cycloheximide does not sensitize wild-type MEFs (A) MEFs wt, MEFs eIF2αS51A/S51A, MEFs GCN2−/−, or MEFs Ppp1r15b−/− were treated or not with 10 μg/ml α-toxin for 2 h. Cell lysates were analyzed by Western blot for P-eIF2α, eIF2α, P-p70S6 kinase, p70S6 kinase P-p38, and p-38. One of three similar blots is shown; lower panel summarizes densitometric data for (P)-eIF2α, mean ± SE; n = 3 (B) MEFs wt or MEFs eIF2αS51A/S51A cells were treated or not with indicated concentrations of α-toxin and incubated for 1 h at 37°C. Treatment with CHX served as positive control for translational arrest. Subsequently, the cells were incubated for 1 h at 37°C with 10 μg/ml puromycin, which incorporates during ongoing synthesis into nascent proteins. Eventually, cells were analyzed by Western blot for puromycin. (C) MEFs wt or MEFs eIF2αS51A/S51A cells were treated or not with 10 μg/ml α-toxin and incubated with or without CHX at 37°C. Cellular ATP levels were determined after 2 h; data are percent of untreated controls; mean values ±SE; n = 5.
Figure 5
Figure 5
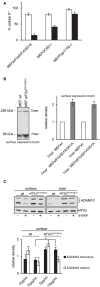
MEFs eIF2αS51A/S51A over-express ADAM10 and bind higher amounts of α-toxin. (A) MEFs eIF2αS51A/S51A, MEFs GCN2−/−, MEFs Ppp1r15b−/−, or corresponding control cells were treated or not with 10 μg/ml α-toxin. Potassium levels were determined after 2 h, shown are percent of untreated controls; mean values ±SE; n ≥ 4. Black bars show data of MEFs cell variants as indicated; white bars corresponding control cells. (B) Right: MEFs wt or MEFs eIF2αS51A/S51A cells were incubated with radio-labeled α-toxin 2 and 8 μg/ml α-toxin at 37°C for 15 min. Subsequently, cells were surface biotinylated, lysates were obtained and subjected to sequential neutravidin-pulldown (NP) and immunoprecipitation (IP) followed by PAGE/fluography, as described in Kloft et al. (13). Left: band intensities were measured by densitometry using ImageJ software. Shown are mean values ±SE; n = 4. Variations of loading with toxin and plating of cells were <1 and <10%, respectively. (C) MEFs wt or MEFs eIF2αS51A/S51A were treated or not with 10 μg/ml α-toxin for 2 h. Subsequently, cells were surface biotinylated or not and lysed. Lysates were subjected to NP; both lysates and precipitation were analyzed by Western blot for ADAM10 and eIF2α (loading control); upper panel: one of four similar blots; lower panel: bar chart summarizing data (mean ± SE; n = 4).
Figure 6
Figure 6
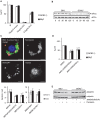
GCN2 does not render BMDMs tolerant to α-toxin. (A) BMDMs isolated from GCN2−/− mice or control mice (B6/J) were treated or not with indicated doses of α-toxin, VCC, or SLO. Cellular ATP levels were determined after 2 h. White bars show BMDMs from GCN2−/− mice and black bars show BMDMs from control mice; mean values ±SE, n ≥ 3 (B) BMDMs of GCN2−/− mice or control mice were incubated with 10 μg/ml α-toxin for indicated times. Cell lysates were analyzed by Western blot for P-eIF2α and eIF2α. (C) MEFs variants (right graph) or BMDMs of GCN2−/− and control mice (left graph) were incubated with fluorescein/biotin labeled S. aureus hla(−) or hla(+) strains (MOI 1:30) for 1 h, washed and incubated for an additional hour at 37°C. After fixation, extracellular bacteria were stained with streptavidin-coupled Alexa 647. Upper: exemplary picture of solely fluorescein-stained S. aureus, representing intracellular bacteria, and extracellular S. aureus that were accessible for Alexa 647-Streptavidin. Lower: graphs show counts of solely fluorescein-stained (intracellular) bacteria per cell; mean values ±SE; BMDMs n = 2; MEFs n = 3. (D) BMDMs of GCN2−/− mice or control mice were incubated with combinations of JNK3XIISR3576 (10 μM), Dynasore (80 μM), JNK3 XIISR3576 (10 μM), and Ly29400L (100 μM) or solvent alone and treated with 10 μg/ml α-toxin. Cellular ATP levels were determined after 2 h (percentage of controls). (Mean values ±SE; n = 3). (E) BMDMs of GCN2−/− and control mice were treated with the combination of Dynasore (80 μM) and JNK3XIISR3576 (10 μM), Dynasore (80 μM) alone, JNK3XIISR3576 (10 μM) alone, or solvent alone (DMSO) for 2.5 h. Cell lysates were analyzed by Western blot for ADAM10 and α-tubulin (loading control).
Figure 7
Figure 7
Model of eIF2α-dependent cellular tolerance to α-toxin. Disruption of membrane integrity by insertion of membrane pores causes various forms of stresses in target cells (e.g., loss of potassium, starvation), which trigger an array of conserved responses, including phosphorylation of MAPK and of eIF2α. Not only may these pathways feed back to alleviate stress but also eIF2α may modulate formation of S. aureus α-toxin membrane pores (this work; highlighted in red in the scheme), or persistence of lesions (13), root causes of α-toxin-dependent stress. Notably, basal activity of GCN2 maintains low levels of ADAM10, resulting in bated binding of α-toxin. Thus, basal nutrient stress in cells could serve as a preemptive stimulus of cellular tolerance to S. aureus α-toxin. This link, which might have evolved from mutual adaptation of S. aureus and humans, is selective, as suggested by the fact that Vibrio cholerae cytolysin breaks cell autonomous defense.

References

    1. Bhakdi S, Tranum-Jensen J. Membrane damage by pore-forming bacterial cytolysins. Microb Pathog (1986) 1:5–14.10.1016/0882-4010(86)90027-6 - DOI - PubMed
    1. Iacovache I, Van Der Goot FG, Pernot L. Pore formation: an ancient yet complex form of attack. Biochim Biophys Acta (2008) 1778:1611–23.10.1016/j.bbamem.2008.01.026 - DOI - PubMed
    1. Los FC, Randis TM, Aroian RV, Ratner AJ. Role of pore-forming toxins in bacterial infectious diseases. Microbiol Mol Biol Rev (2013) 77:173–207.10.1128/MMBR.00052-12 - DOI - PMC - PubMed
    1. Bischofberger M, Iacovache I, Van Der Goot FG. Pathogenic pore-forming proteins: function and host response. Cell Host Microbe (2012) 12:266–75.10.1016/j.chom.2012.08.005 - DOI - PubMed
    1. Thelestam M, Mollby R. Survival of cultured-cells after functional and structural disorganization of plasma-membrane by bacterial hemolysins and phospholipases. Toxicon (1983) 21:805–15.10.1016/0041-0101(83)90069-7 - DOI - PubMed