. 2016 Mar;10(3):665-77.
doi: 10.1038/ismej.2015.143. Epub 2015 Aug 18.

Insights in the ecology and evolutionary history of the Miscellaneous Crenarchaeotic Group lineage

Affiliations

Insights in the ecology and evolutionary history of the Miscellaneous Crenarchaeotic Group lineage

Mireia Fillol et al. ISME J. 2016 Mar.

Abstract

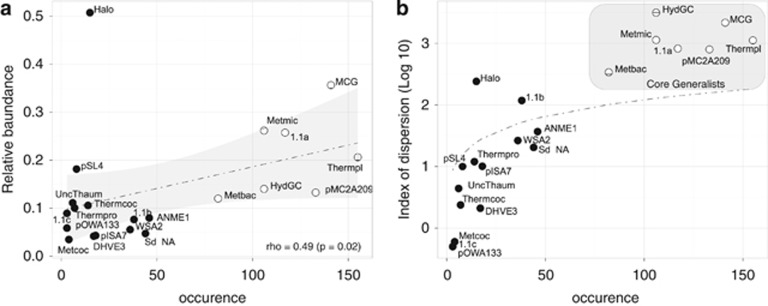
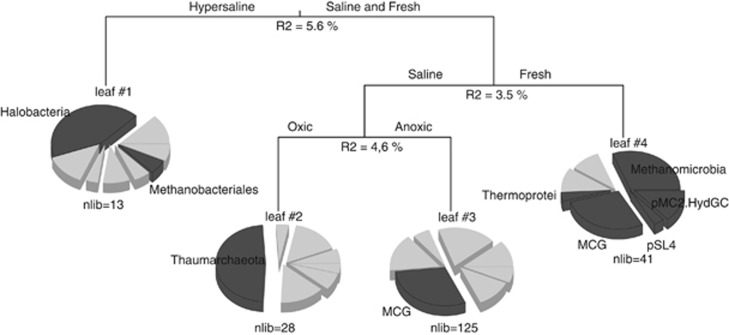
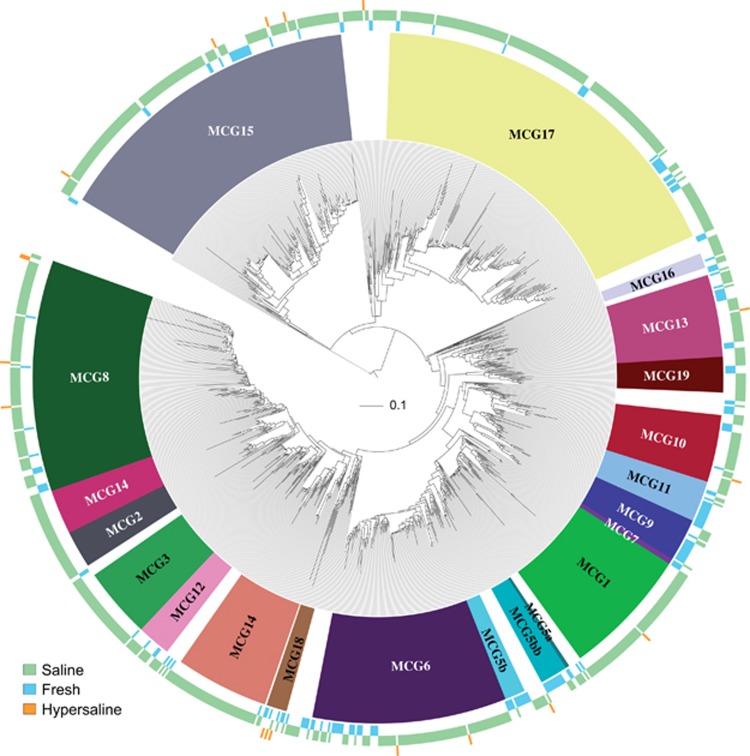
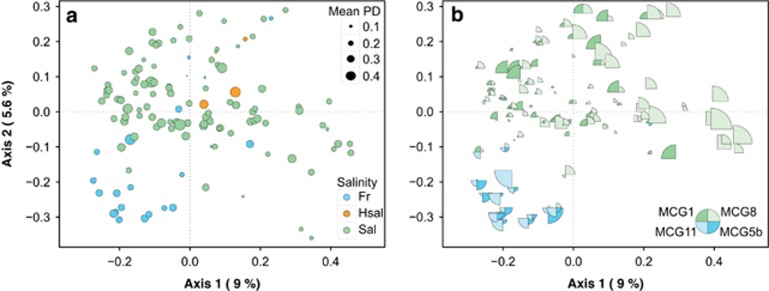
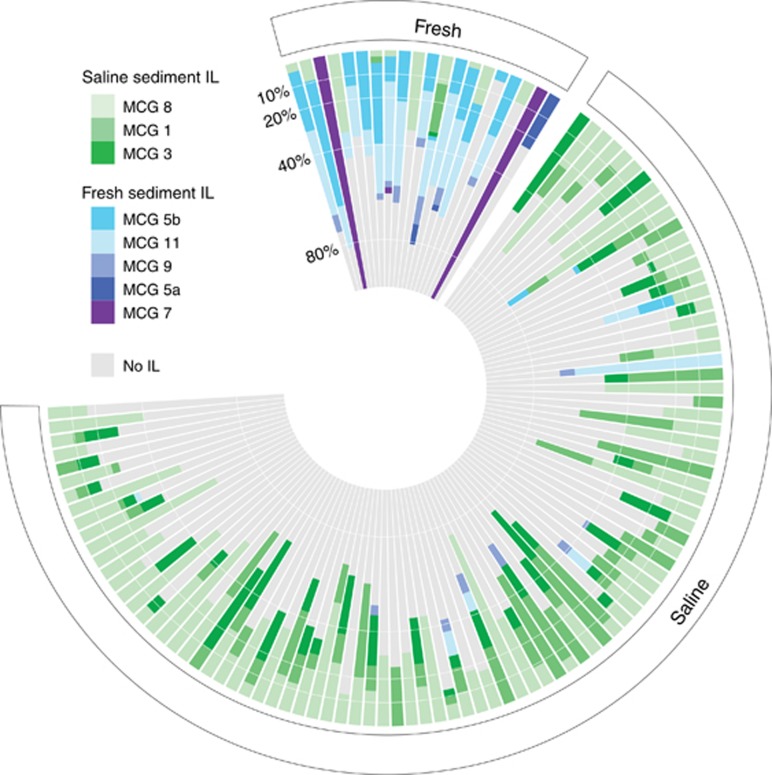
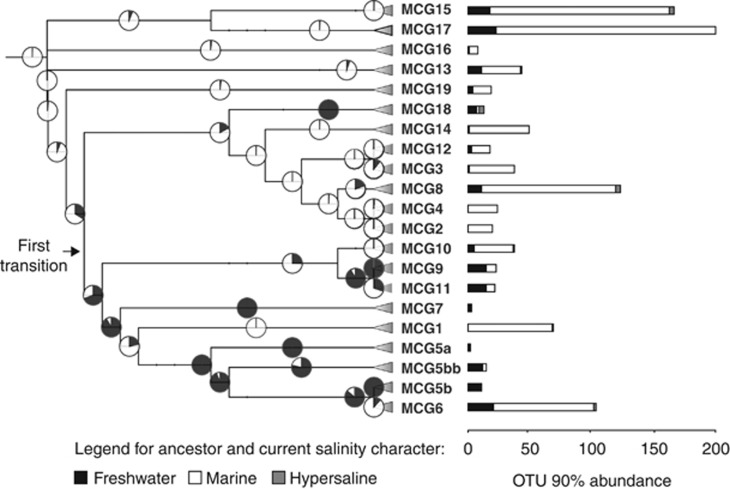
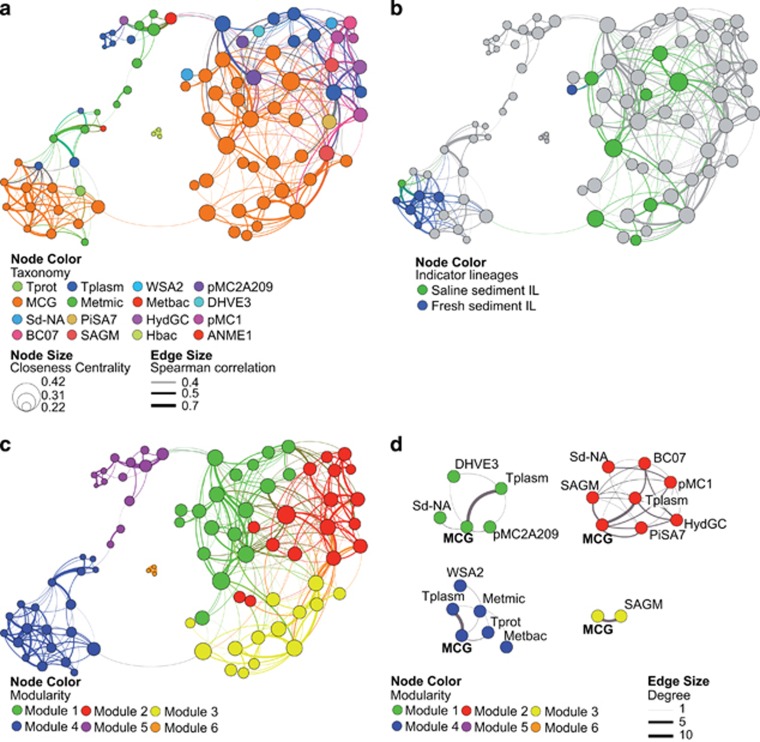
Members of the archaeal Miscellaneous Crenarchaeotic Group (MCG) are among the most successful microorganisms on the planet. During its evolutionary diversification, this very diverse group has managed to cross the saline-freshwater boundary, one of the most important evolutionary barriers structuring microbial communities. However, the current understanding on the ecological significance of MCG in freshwater habitats is scarce and the evolutionary relationships between freshwater and saline MCG remains poorly known. Here, we carried out molecular phylogenies using publicly available 16S rRNA gene sequences from various geographic locations to investigate the distribution of MCG in freshwater and saline sediments and to evaluate the implications of saline-freshwater transitions during the diversification events. Our approach provided a robust ecological framework in which MCG archaea appeared as a core generalist group in the sediment realm. However, the analysis of the complex intragroup phylogeny of the 21 subgroups currently forming the MCG lineage revealed that distinct evolutionary MCG subgroups have arisen in marine and freshwater sediments suggesting the occurrence of adaptive evolution specific to each habitat. The ancestral state reconstruction analysis indicated that this segregation was mainly due to the occurrence of a few saline-freshwater transition events during the MCG diversification. In addition, a network analysis showed that both saline and freshwater MCG recurrently co-occur with archaea of the class Thermoplasmata in sediment ecosystems, suggesting a potentially relevant trophic connection between the two clades.


Figures

Figure 1
Figure 1
Species abundance distribution (SAD) pattern of archaeal classes in the clone libraries analyzed. (a) Occurrence of archaeal lineages (number of studies in which a given lineage was found) plotted against its average abundance across these studies. A significant positive distribution–abundance relationship is observed. Core lineages (in white) were defined as those appearing in >75 studies and satellite lineages (in black) occurred in less than 50 studies. (b) Occurrence of each archaeal lineage plotted against its dispersion index. The line depicts the 2.5% confidence limit of the χ2 distribution: lineages falling bellow this line follow a Poisson distribution and are randomly dispersed in space. ANME, anaerobic methanotroph; DHVE3, Deep Hydrothermal Vent Euryarchaeota-3; Halo, Halobacteria; MCG, Miscellaneous Crenarchaeotic Group; Metbac, Methanobacteria; Metmic, Methanomicrobia; Metcoc, Methanococci; SAGMEG, South African Gold Mine Euryarchaeotic Group; Thermcoc, Thermococci; Thermprot, Thermoprotei; Thermpl, Thermoplasmata; UncThaum, Uncultured Thaumarchaeota; 1.1a, Thaumarchaeota 1.1a; 1.1.b, Thaumarchaeota 1.1b; 1.1.c, Thaumarchaeota 1.1c.
Figure 2
Figure 2
Multivariate Regression Tree (MRT) relating the abundance of each archaeal lineage to environmental variables. The model explained 13.7% of the total variance of the taxonomic composition of archaeal communities. Pies under each leaf represent the mean of normalized archaeal lineage abundance for each lineage significantly correlated with environmental parameters. Dark grey sections identify significant indicator lineages according to the IndVal index calculated on each leaf (P<0.01). nlib=number of clone libraries.
Figure 3
Figure 3
Maximum likelihood phylogenetic tree of the Miscellaneous Crenarchaeotic Group using available 16S rRNA gene sequences from GenBank NCBI-nr database dereplicated at 90%. Subgroup nomenclature from MCG-1 to MCG-17 follows those described Kubo et al. (2012). New subgroups identified in the current study are labeled as MCG-5bb, MCG-18 and MCG-19. Uncolored leaves identify sequences not assigned to any subgroup (that is, unclassified). Outer colored circles indicate sequence origin, as follows: freshwater (blue), saline (green) and hypersaline (orange). Tree was drawn using the web-based interactive tree of life.
Figure 4
Figure 4
(a) Principal coordinate analysis (PCoA) plot obtained using a weighted UniFrac distance matrix calculated on 140 clone libraries containing >10 representative MCG sequences (97% cutoff). Libraries are colored according to salinity (see legend). Bubble size indicates the mean phylogenetic diversity (PD) index of 1000 randomized subsamples of each study. (b) Same as in a, but showing the relative abundance of MCG-IL (size of sectors) with the highest IndVal values in each study (MCG-1 and MCG-8 in green for marine sediments; MCG-5b and MCG-11 in blue for freshwater sediments).
Figure 5
Figure 5
Polarplot showing the relative abundance of MCG-IL in freshwater and marine sediments.
Figure 6
Figure 6
Ancestral state reconstruction (ASR) of salinity range for MCG. Pie charts on the nodes show the relative likelyhoods of the three states: freshwater (black), marine (white) and hypersaline (grey). Bar charts at the right indicate the current salinity state for MCG OTUs (90% cutoff).
Figure 7
Figure 7
(a) Co-occurrence OTU network based on correlation analysis. Each node denotes an archaeal OTU 90%. Node size is proportional to the closeness centrality (that is, the average shortest path of this node to any other node) and node color denotes taxonomic classification (see Figure 2 for abbreviations). Edge lines between nodes represent significant co-occurrences relationships. Edge size indicates the strength of Spearman correlation among nodes. (b) Same network as in a, but nodes are colored according to MCG-Indicator Lineages, as follows: green: indicator MCG lineages for saline sediments (MCG-1, MCG-3 and MCG-8); blue: indicator MCG lineages for freshwater sediments (MCG-5a, MCG-5b, MCG-7, MCG-9 and MCG-11). (c) Same network as in a, but nodes are colored by modules. (d) Sub-network modules clustering all OTUs of the same lineage colored by modularity. Edge size indicates the number of connections (degree). Only the sub-networks where MCG are present are displayed.

References

    1. Auguet JC, Barberan A, Casamayor EO. (2010). Global ecological patterns in uncultured Archaea. ISME J 4: 182–190. - PubMed
    1. Auguet JC, Triado-Margarit X, Nomokonova N, Camarero L, Casamayor EO. (2012). Vertical segregation and phylogenetic characterization of ammonia-oxidizing Archaea in a deep oligotrophic lake. ISME J 6: 1786–1797. - PMC - PubMed
    1. Barberan A, Bates ST, Casamayor EO, Fierer N. (2012). Using network analysis to explore co-occurrence patterns in soil microbial communities. ISME J 6: 343–351. - PMC - PubMed
    1. Barberan A, Casamayor EO. (2010). Global phylogenetic community structure and beta-diversity patterns of surface bacterioplankton metacommunities. Aquat Microb Ecol 59: 1–10.
    1. Bastian M, Heymann S, Jacomy M. (2009) International AAAI Conference on Weblogs and Social Media. San José: : California, USA.

Publication types