Review
. 2015 Sep;267(1):30-55.
doi: 10.1111/imr.12327.

Coevolution of T-cell receptors with MHC and non-MHC ligands

Affiliations
Review

Coevolution of T-cell receptors with MHC and non-MHC ligands

Caitlin D Castro et al. Immunol Rev. 2015 Sep.

Abstract

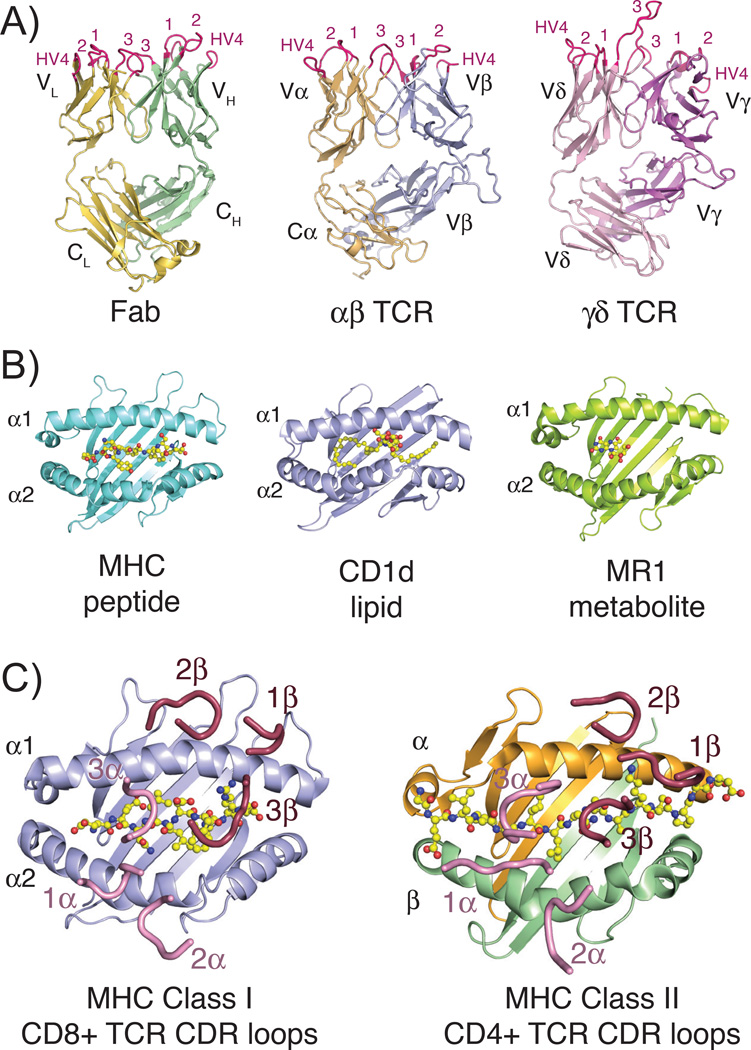
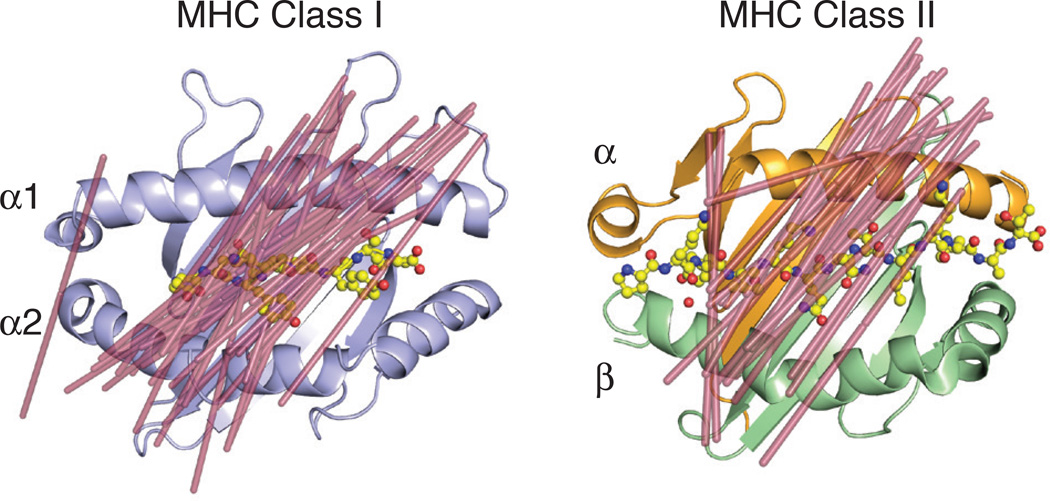
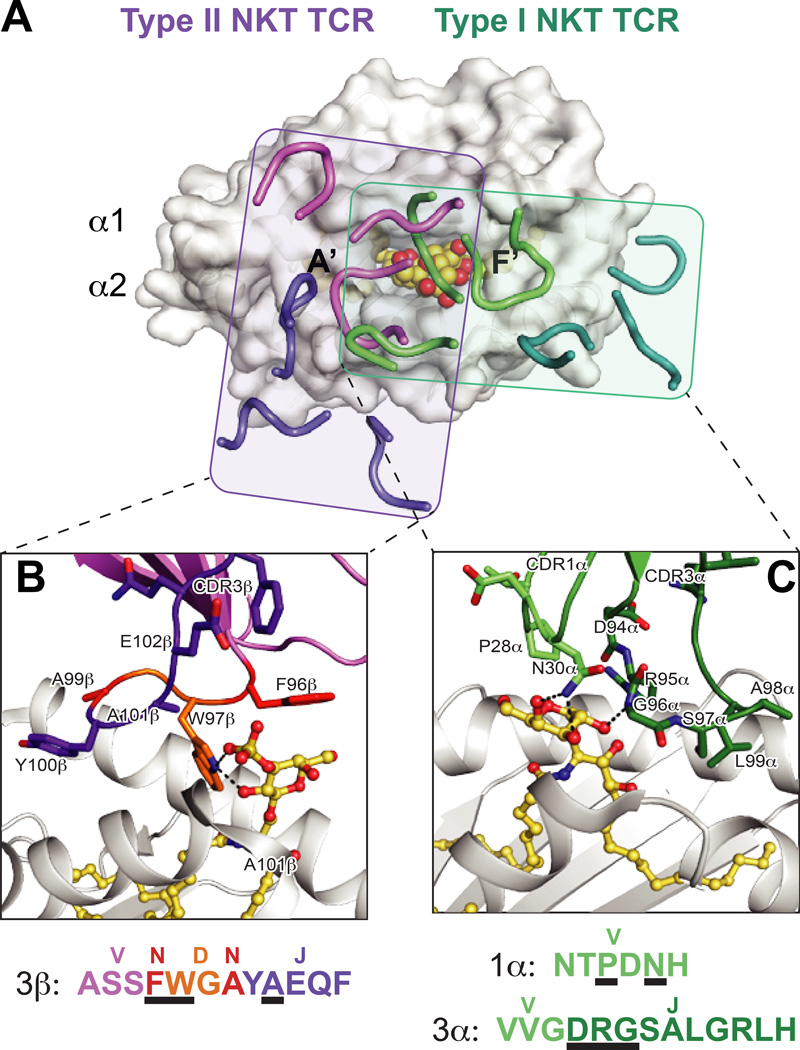
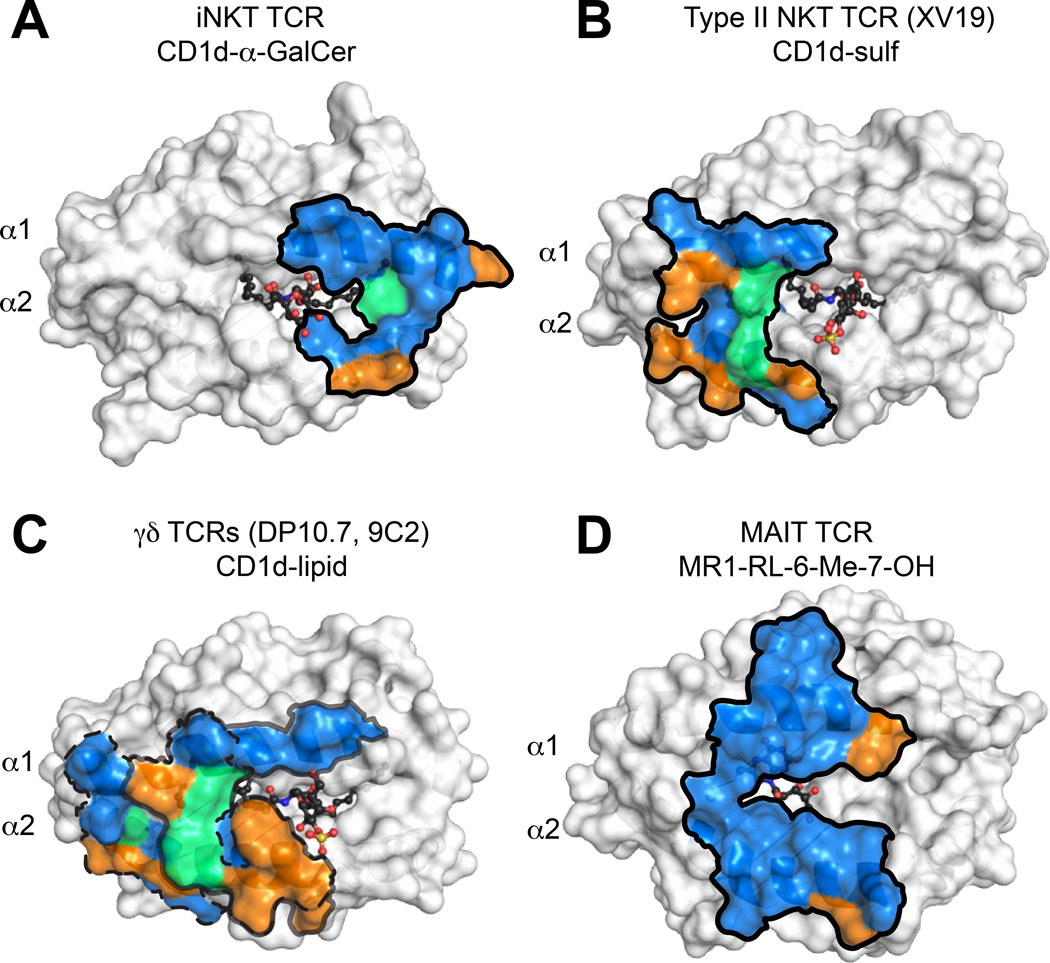
The structure and amino acid diversity of the T-cell receptor (TCR), similar in nature to that of Fab portions of antibodies, would suggest that these proteins have a nearly infinite capacity to recognize antigen. Yet all currently defined native T cells expressing an α and β chain in their TCR can only sense antigen when presented in the context of a major histocompatibility complex (MHC) molecule. This MHC molecule can be one of many that exist in vertebrates, presenting small peptide fragments, lipid molecules, or small molecule metabolites. Here we review the pattern of TCR recognition of MHC molecules throughout a broad sampling of species and T-cell lineages and also touch upon T cells that do not appear to require MHC presentation for their surveillance function. We review the diversity of MHC molecules and information on the corresponding T-cell lineages identified in divergent species. We also discuss TCRs with structural domains unlike that of conventional TCRs of mouse and human. By presenting this broad view of TCR sequence, structure, domain organization, and function, we seek to explore how this receptor has evolved across time and been selected for alternative antigen-recognition capabilities in divergent lineages.

Keywords: MHC; MHC-like class I; TCR recognition; evolution; non-classical class I; structure.


Conflict of interest statement

The authors have no conflicts of interest to declare.

Figures

Fig. 1
Fig. 1. Structures of TCR, Fab, and MHC molecules and the classical docking paradigm
(A) Three-dimensional structures of the three classical rearranged receptors in jawed vertebrates: Fab, αβ TCR and γδ TCR (PDB IDs: 1MLC, 2CKB and 1YPZ). Domains are labeled according to their chain designations and CDR loops are colored in hot pink and labeled accordingly. (B) Representative three-dimensional structures of the three antigen-presenting MHC molecules: classical class I MHC with peptide, CD1d with lipid and MR1 with small molecule metabolite (PDB IDs: 2CKB, 1ZT4 and 4LCC). Ligands are shown in stick representations and colored yellow, red and blue indicating carbon, oxygen and nitrogen atoms, respectively. (C) Complex crystal structures of a CD8+ αβ TCR with MHC class I molecule (PDB ID: 3DXA) and CD4+ αβ TCR with MHC class II molecule (PDB ID: 4E41), with just CDR loops shown as they are positioned in the complex structure. Peptide ligands are shown as described above for 1B. In both complexes, CDR loops of the α chain are colored pink, of the β chain are colored raspberry and each are numbered accordingly. All three-dimensional structure figures were made with the program Pymol (Schrödinger).
Fig. 2
Fig. 2. MHC class I and class II restricted TCR docking orientations
Shown are the docking orientations of αβ TCRs on their MHC class I (left, PDB ID: 2CKB) or class II (right, PDB ID: 1FYT) ligands. Lines were drawn (shown in raspberry) from the two external conserved cysteines in the Variable Ig domains (C22 of α chain and C23 of β chain) to demonstrate orientation of the TCR on the MHC surface. The following PDB IDs were used for the complex structures for the class I model: 1FO0, 1KJ2, 3RGV, 2CKB, 2OI9, 3PQY, 2OL3, 1AO7, 1BD2, 1LP9, 1OGA, 2BNQ, 3GSN, 3HG1, 3O4L, 3QDJ, 3QDM, 3UTS, 3VXM, 3VXR, 3VXU, 4G8G, 2NX5, 3MV7, 2AK4, 4JRY, 3DXA, 3KPS, 2YPL, 1MI5, 3FFC, 3SJV, 4MJI, 2ESV; and for the class II model: 3PL6, 4OZF, 4OZI, 4GG6, 4E41, 2IAN, 1FYT, 4H1L, 2WBJ, 1YMM, 1ZGL, 3O6F, 4P4K, 3C5Z, 3C60, 3C6L, 3RDT, 3MBE, 2PXY, 1U3H, 3QIB, 1D9K.
Fig. 3
Fig. 3. Differential docking modes and lipid antigen contacts of Type I and Type II NKT TCRs
(A) Footprints of the Type I (iNKT) and Type II NKT TCRs on CD1d. The complex structures of the murine iNKT and Type II NKT TCR structures are aligned by CD1d. Shown is the surface of murine CD1d-αGalCer (PDB ID: 3HE7) with the CDR loops of the murine Vβ7 iNKT TCR (PDB ID: 3HE7) in green (α chain) and teal (β chain), and type II NKT TCR (PDB ID: 4EI5) in purple (α chain) and pink (β chain). The rough borders of the TCR/CD1d interfaces are shown as shaded boxes colored teal (Type I) and purple (Type II). (B) Detail of the mouse Type II NKT TCR-CD1d–sulfatide interface. Residues that contact the sulfatide antigen are shown and colored according to origin of encoding nucleotides (pink = V, purple = J, orange = D, red = non-templated). CD1d is shown in grey cartoon, sulfatide is in yellow ball-and-sticks. Hydrogen bonds are shown in black dashed lines. Lower panel details the amino acids of the CDR3β loop, colored according to origin as above, with black underlines denoting with residues contact sulfatide. The major sulfatide contacts are through either non-templated or D-encoded TCR residues. (C) Detail of the mouse Vβ7 iNKT TCR –CD1d-αGalCer interface. Residues that contact the αGalCer antigen are shown and colored according to origin of encoding nucleotides (light green = V, dark green = J). . CD1d is shown in grey cartoon, αGalCer is in yellow ball-and-sticks. Hydrogen bonds are shown in black dashed lines. Lower panel details the amino acids of the CDR1α and CDR3α loops, colored according to origin as above, with black underlines denoting with residues contact αGalCer. All contacts with the lipid antigen and germline encoded.
Fig. 4
Fig. 4. Evolutionary conservation of TCR footprints on antigen presenting molecules
Shown are the surfaces of CD1d or MR1 in white, with residues that contact the TCR colored blue, green or orange. Blue = residues identical in mice and humans, green = residues with similar biochemical properties in mice and humans, orange = no conservation. Dark outlines define total contact borders. (A) Human CD1d-αGalCer with residues contacted by the human iNKT TCR colored as above. (B) Mouse CD1d–sulfatide with residues contacted by the mouse XV19 TCR colored as above. (C) Footprints of the human DP10.7 and 9C2 γ TCR on human CD1d–lipid surface (sulfatide shown). The border of the DP10.7 TCR footprint on CD1d is shown in grey; border of 9C2 TCR footprint on CD1d is shown in dashed line. (D) Human MR1-RL-6-Me-7-OH with residues contacted by the human MAIT TCR colored as above.
Fig. 5
Fig. 5. Differential interaction modes of human γδ TCRs with CD1d–lipid complexes
(A) Footprints of the DP10.7 (PDB ID: 4mng) and 9C2 TCRs (PDB: 4lhu) upon CD1d–lipid complexes. The two complex structures were aligned via CD1d to show the different orientation of the CDR loops upon the CD1d surface. CD1d is shown as a white surface. The 9C2 TCR CDR loops are shown in light green (γ) or dark green (δ), and the corresponding lipid recognized by this TCR, αGalCer, is shown in aquamarine sticks. The DP10.7 TCR CDR loops are shown in pink (γ) and purple (δ), and the corresponding lipid contacted, sulfatide, is shown in pink. The rough borders of each of the TCR footprints in depicted by a shaded box for the 9C2 (box in green) and DP10.7 TCR (purple). For both TCRs, loops that do not contact CD1d–lipid are shown as transparent. (B) Detail of the 9C2 TCR-αGalCer interface. The CDR3γ loop is shown in green, and residues that contact αGalCer are labeled and shown as sticks. Below, the CDR3γ amino acid sequence is depicted, with residues that contact αGalCer underlined in black. (C) Detail of the DP10.7 TCR sulfatide interface. The CDR3δ loop is shown in purple, and residues that contact αGalCer are labeled and shown as sticks. Below, the CDR3δ amino acid sequence is depicted, with residues that contact αGalCer underlined in black. For (B) and (C), hydrogen bonds are shown as dash lined, and salt-bridge interactions are highlighted by showing the charge of the involved residues/moieties.
Fig. 6
Fig. 6. Structure of the CD1a–LPC-BKT αβ and implications for lipopeptide recognition
(A) Overall structure of the BK TCR-CD1a–lysophophatidylcholine (LPC) complex (PDB 4×6c). The TCR is shown in purple (α chain) and gold (β chain), CD1a is shown in grey and LPC is shown in yellow ball and sticks. (B) Surface view of the BK6 TCR CDR loops upon the CD1a–LPC surface. The TCR chains are colored as above, and the CD1a surface contacted by the TCR is colored in pink. Notably, the lipid head group is not contacted by the CDR loops, which instead are positioned over the A′ roof of CD1a. The residues R73, R76 and E154, which form this roof via a salt-bridge network, are indicated. (C) Alignment of the BK6-CD1a complex (aligned via CD1a) to the CD1a- didehydroxymycobactin (DDM) complex (PDB ID: 1xz0). Shown is the CD1a–DDM surface with BK6 TCR CDR loops positioned as for the CD1a–LPC structure. The larger head-group of DDM disrupts the CD1a A′ roof formed by R73, R76 and E154, and also repositions additional α helical residues, which would clash with TCR CDR loops. As a result, the contact interface as in the CD1a–LPC complex would be altered, implying that CD1a–specific TCRs specific for larger lipid species would need to undergo CDR loop conformational changes or adopt different binding modes.
Fig. 7
Fig. 7. MR1 ligand presentation and recognition by MAIT TCRs
(A) Surface representation of human MR1 (PDB ID: 4GUP) showing the cavity structure of its antigen binding groove. Two main cavities are apparent, called A′ and F′. The 6-FP ligand identified in the crystal structure, is barely visible, colored in yellow (carbon atoms) and blue (nitrogen atoms). (B) Positioning of the CDR3α and CDR3β loops of a MAIT TCR in the complex structure with MR1 presenting the rRL ligand (PDB ID: 4LCC). The residues in these loops that contact the rRL ligand are shown, Y95 for the CDR3α loop and E99 for CDR3β. Hydrogen bonds established between these residues and the ribityl chain of the rRL ligand are shown as dashed yellow lines. (C) Orientation of the MAIT TCR CDR loops while docked onto the MR1 structure. Similar representation as to Figure 2; line was drawn (shown in raspberry) from the two external conserved cysteines in the Variable Ig domain of the MAIT TCR (C22 of α chain and C23 of β chain) to demonstrate orientation of the TCR on the MR1 surface. CDRα loops are colored in pink; CDRβ loops in green. The rRL ligand is shown as sticks in yellow (carbon atoms) and blue (nitrogen atoms).
Fig. 8
Fig. 8. Comparison of TCR chains present in diverse species
Cartoon diagrams of the variable TCR chains present in a variety of species including mice and humans, monotremes, marsupials, frogs and birds, and cartilaginous fish. Traditional TCRα (green), β (purple), γ (blue), and δ (red) chains are found in all species. TCRδ chains with VH-like TCRVδ domains are shown in yellow, and those expressing true IgVH domains via transrearrangements in pink. Potential binding partners for unusual TCRδ chains are colored grey. Predicted structure of three-domain TCR chains, NAR- TCR and TCRµ (brown) are shown in B, C, and E, with the NAR-TCRV domain depicted yellow due to its similarity with IgNARV domains. CDR1, 2, and 3 loops depicted at the top of each TCRV domain, with larger loops representing longer CDR3s found in some Vδ domains. Predicted disulfide linkages due to extra cysteine residues in monotreme TCRδ CDR3 (B) and between terminal and supporting shark NARTCRV domains (E) are labeled.
Fig. 9
Fig. 9. High variability of Cγ connecting pieces both within and across species
(A) Differences in length and features of the connecting piece/hinge of TCRγ chains in multiple species. Vγ and Cγ domains are shown in blue, with plasma membrane in orange. Examples are roughly organized from shortest to longest connecting pieces, with ranges of amino acid lengths and exon usage displayed beneath each gene name. Presence of cysteine resides marked with C. (*) Indicates allelic difference in human Cγ2 of either 2 or 3 exons. (B) Cartoon showing hypothetical regions of interaction between the TCRγ connecting piece and CD3.

References

    1. Garcia KC, Adams EJ. How the T cell receptor sees antigen--a structural view. Cell. 2005;122:333–336. - PubMed
    1. Rossjohn J, Gras S, Miles JJ, Turner SJ, Godfrey DI, McCluskey J. T cell antigen receptor recognition of antigen-presenting molecules. Annu Rev Immunol. 2015;33:169–200. - PubMed
    1. Marrack P, Scott-Browne JP, Dai S, Gapin L, Kappler JW. Evolutionarily conserved amino acids that control TCR-MHC interaction. Annu Rev Immunol. 2008;26:171–203. - PMC - PubMed
    1. Garcia KC, Adams JJ, Feng D, Ely LK. The molecular basis of TCR germline bias for MHC is surprisingly simple. Nat Immunol. 2009;10:143–147. - PMC - PubMed
    1. Scott-Browne JP, White J, Kappler JW, Gapin L, Marrack P. Germline-encoded amino acids in the alphabeta T-cell receptor control thymic selection. Nature. 2009;458:1043–1046. - PMC - PubMed

Publication types

MeSH terms