. 2016 Jan 19;7(3):2889-909.
doi: 10.18632/oncotarget.3898.

Oncogene- and drug resistance-associated alternative exon usage in acute myeloid leukemia (AML)

Affiliations

Oncogene- and drug resistance-associated alternative exon usage in acute myeloid leukemia (AML)

Aminetou Mint Mohamed et al. Oncotarget. .

Abstract

In addition to spliceosome gene mutations, oncogene expression and drug resistance in AML might influence exon expression. We performed exon-array analysis and exon-specific PCR (ESPCR) to identify specific landscapes of exon expression that are associated with DEK and WT1 oncogene expression and the resistance of AML cells to AraC, doxorubicin or azacitidine. Data were obtained for these five conditions through exon-array analysis of 17 cell lines and 24 patient samples and were extended through qESPCR of samples from 152 additional AML cases. More than 70% of AEUs identified by exon-array were technically validated through ESPCR. In vitro, 1,130 to 5,868 exon events distinguished the 5 conditions from their respective controls while in vivo 6,560 and 9,378 events distinguished chemosensitive and chemoresistant AML, respectively, from normal bone marrow. Whatever the cause of this effect, 30 to 80% of mis-spliced mRNAs involved genes unmodified at the whole transcriptional level. These AEUs unmasked new functional pathways that are distinct from those generated by transcriptional deregulation. These results also identified new putative pathways that could help increase the understanding of the effects mediated by DEK or WT1, which may allow the targeting of these pathways to prevent resistance of AML cells to chemotherapeutic agents.

Keywords: DEK; WT1; acute myeloid leukemia; alternative splicing; multidrug resistance.


Conflict of interest statement

CONFLICTS OF INTEREST

The authors declare no competing financial interest.

Figures
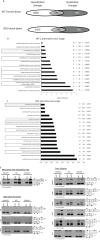
Figure 1
Figure 1. Distribution of alternative exon usages in AML cell lines after WT1 and DEK expression
A. Distribution of quantitative and qualitative gene modifications in cells expressing either high or low levels of WT1 or DEK. Total RNA was analyzed using the exon microarray platform GeneChip HTA2 (Affymetrix). Microarray data were cross-compared between cell lines and only statistically significant modifications (p < 0.05) that were shared by at least 2 of the 3 cell lines (MOLM13, Kasumi-1 and KG1) were selected. For the two cell categories (WT1 high versus WT1 low, and DEK high versus DEK low), Venn diagrams show the distribution of genes modified at the level of whole gene expression (white), alternative exon usage (dark grey) or both (light grey). B-C. Pathway enrichment analysis. For ontology analysis, gene lists were analyzed using DAVID software (KEGG pathways). The complete set of genes featured in the microarrays was used as the reference background. The three numbers on the right represent the number of deregulated mRNAs, the overall number of genes within the pathway and the p value, respectively. Data are presented for genes that were qualitatively modified following WT1 (D) and DEK (E) expression. Black rectangles represent exon-associated pathways shared by WT1- and DEK-expressing cells, while for each cell category the filled gray rectangles indicate pathways generated by both quantitative and quantitative changes in gene expression. D. Validation of microarray-predicted exon events. Exon-specific RT-PCR assays were performed with RNA samples derived from WT1+ and WT1-MOLM13, Kaumi-1 and KG1 cells. Numbers indicate the expected size (bp) of the PCR products. SI (splicing index) and p values are indicated for each exon event. SI ≥ 1.2 was considered a significant change in exon expression and was used for comparisons.
Figure 2
Figure 2. Distribution of alternative exon usages in AML cells that are resistant to anti-cancer drugs
A. Distribution of quantitative and qualitative gene modifications in AraC-, DXR- and AZA-resistant cells. Total RNA was analyzed using the exon microarray platform GeneChip HTA2 (Affymetrix). Microarrays were performed in triplicate for the six cell lines and only statistically significant modifications (p < 0.05) were selected. For the three cell categories (resistant to AraC, DXR and AZA), Venn diagrams show the distribution of genes that were modified at the level of whole gene expression (white), alternative exon usage (dark grey) or both (light grey). B-D. Pathway enrichment analysis (see legend for Figure 1C-1D) of genes that were qualitatively modified in cells that are resistant to AraC (C), DXR (D) and AZA (E) Pathways shared by AraC- and DXR-resistant cells, AraC-, dXr- and AZA-resistant cells, DXR- and AZA-resistant cells and AraC- and AZA-resistant cells are represented by black, red, blue and green rectangles, respectively. For each resistant cell type, filled gray rectangles represent those pathways that were associated with both quantitative and qualitative transcriptional changes.
Figure 3
Figure 3. Distribution of alternative exon usages in fresh AML samples derived from patients with chemosensitive (SG1) and chemoresistant (SG3) disease
A. Distribution of quantitative and qualitative gene modifications in fresh AML diagnosis bone marrow samples derived from patients with chemosensitive (SG1, n = 7) and chemoresistant (SG3, n = 10) disease. Microarray data from each sample group were cross-compared with those of 10 control bone marrow samples (SG2) as detailed in the Methods section (Table 2). For the two sample categories, Venn diagrams show the distribution of genes modified at the whole gene expression level (white), alternative exon usage (dark grey) or both (light grey). B-C. Pathway enrichment analysis (see legend for Figure 1D-1G) of genes that are qualitatively modified in cells from SG1 (C) and SG3 (D) groups. Black rectangles represent exon-associated pathways shared by SG1 and SG3 samples, while for each sample category filled gray rectangles identify pathways generated by both quantitative and quantitative changes in gene expression. D. Pathway analysis of genes found to be qualitatively modified in both AraC-resistant cells and SG1-derived samples. E. Pathway analysis for genes that were qualitatively modified in both AZA-resistant cells and SG1- (top) or SG3- (bottom) derived samples.
Figure 4
Figure 4. Quantitative exon-specific RT-PCR (qESPCR) analysis of TET2 exon 2 expression in vitro and in vivo
A. TET2 exon 2 skipping in K562/AraC cells and B. AML diagnosis cells and control cells. qESPCR shows a decreased level of TET2 exon 2 expression in AraC-resistant K562/AraC cells whereas whole TET2 gene expression, as measured through qRT-PCR analysis of the TET2 exon 10 sequence, is unchanged between the two cell categories. Meanwhile, qESPCR detected significantly lower levels of TET2 exon 2 expression in fresh AML cells (152 samples) compared to control cells (37 samples), while qRT-PCR showed that whole TET2 gene expression was unchanged (right).
Figure 5
Figure 5. WT1-dependent mis-splicing of ABC transporter mRNAs in AML cells in vivo
The figure represents the position of oligonucleotides used for qESPCR, results of qESPCR for the three cell lines and fresh AML samples, as well as the correlation between expression levels of WT1 and ABC transporters ABC-A3 A. and ABC-A2. B. in the 152 fresh AML samples and samples from 37 healthy donors. C. Lack of correlation between WT1 and TET2 exon 2 expression in vitro and in vivo.

References

    1. Roboz GJ. Novel approaches to the treatment of acute myeloid leukemia. Hematology/the Education Program of the American Society of Hematology American Society of Hematology Education Program. 2011;2011:43–50. - PubMed
    1. Itzykson R, Thepot S, Berthon C, Delaunay J, Bouscary D, Cluzeau T, Turlure P, Prebet T, Dartigeas C, Marolleau JP, Recher C, Plantier I, Stamatoullas A, Devidas A, Taksin AL, Guieze R, et al. Azacitidine for the treatment of relapsed and refractory AML in older patients. Leukemia research. 2015;39:124–130. - PubMed
    1. Benderra Z, Faussat AM, Sayada L, Perrot JY, Tang R, Chaoui D, Morjani H, Marzac C, Marie JP, Legrand O. MRP3, BCRP, and P-glycoprotein activities are prognostic factors in adult acute myeloid leukemia. Clinical cancer research. 2005;11:7764–7772. - PubMed
    1. Adamia S, Haibe-Kains B, Pilarski PM, Bar-Natan M, Pevzner S, Avet-Loiseau H, Lode L, Verselis S, Fox EA, Burke J, Galinsky I, Dagogo-Jack I, Wadleigh M, Steensma DP, Motyckova G, Deangelo DJ, et al. A Genome-wide aberrant RNA splicing in patients with acute myeloid leukemia identifies novel potential disease markers and therapeutic targets. Clinical cancer research. 2014;20:1135–45. - PMC - PubMed
    1. Visconte V, Makishima H, Maciejewski JP, Tiu RV. Emerging roles of the spliceosomal machinery in myelodysplastic syndromes and other hematological disorders. Leukemia. 2012;26:2447–2454. - PMC - PubMed

Publication types

MeSH terms