. 2015 Aug 18;10(8):e0135868.
doi: 10.1371/journal.pone.0135868. eCollection 2015.

Microbial Communities Can Be Described by Metabolic Structure: A General Framework and Application to a Seasonally Variable, Depth-Stratified Microbial Community from the Coastal West Antarctic Peninsula

Affiliations

Microbial Communities Can Be Described by Metabolic Structure: A General Framework and Application to a Seasonally Variable, Depth-Stratified Microbial Community from the Coastal West Antarctic Peninsula

Jeff S Bowman et al. PLoS One. .

Abstract

Taxonomic marker gene studies, such as the 16S rRNA gene, have been used to successfully explore microbial diversity in a variety of marine, terrestrial, and host environments. For some of these environments long term sampling programs are beginning to build a historical record of microbial community structure. Although these 16S rRNA gene datasets do not intrinsically provide information on microbial metabolism or ecosystem function, this information can be developed by identifying metabolisms associated with related, phenotyped strains. Here we introduce the concept of metabolic inference; the systematic prediction of metabolism from phylogeny, and describe a complete pipeline for predicting the metabolic pathways likely to be found in a collection of 16S rRNA gene phylotypes. This framework includes a mechanism for assigning confidence to each metabolic inference that is based on a novel method for evaluating genomic plasticity. We applied this framework to 16S rRNA gene libraries from the West Antarctic Peninsula marine environment, including surface and deep summer samples and surface winter samples. Using statistical methods commonly applied to community ecology data we found that metabolic structure differed between summer surface and winter and deep samples, comparable to an analysis of community structure by 16S rRNA gene phylotypes. While taxonomic variance between samples was primarily driven by low abundance taxa, metabolic variance was attributable to both high and low abundance pathways. This suggests that clades with a high degree of functional redundancy can occupy distinct adjacent niches. Overall our findings demonstrate that inferred metabolism can be used in place of taxonomy to describe the structure of microbial communities. Coupling metabolic inference with targeted metagenomics and an improved collection of completed genomes could be a powerful way to analyze microbial communities in a high-throughput manner that provides direct access to metabolic and ecosystem function.


Conflict of interest statement

Competing Interests: The authors have declared that no competing interests exist.

Figures

Fig 1
Fig 1. Relative genomic plasticity of the genomes used for metabolic inference.
Colors correspond to the level of plasticity, which is also given by the y-axis. X-axis is labeled according to terminal node order for the representative 16S rRNA gene from each genome on a phylogenetic tree rooted at the node ancestral to the Archaea and Planctomyces (S1 File). Note that terminal node order on this rooted tree does not correspond to edge numbers on the unrooted tree used for phylogenetic placement (S2 File). Arrows indicate strains or clades with exceptional plasticity, the majority of which are known symbionts. I) Nanoarcheum equitans II) the Mycobacteria III) a butyrate producing bacterium within the Clostridium IV) Candidatus Hodgkinia circadicola V) the Mycoplasma VI) Sulcia muelleri VII) Portiera aleyrodidanum VIII) Buchnera aphidicola, IX) the Oxalobacteraceae.
Fig 2
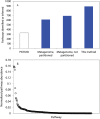
Fig 2. Comparison of metabolic inference and metagenomic analysis.
A) Metabolic pathways identified (metagenomes) or inferred (PICRUSt, this method) with each method. PICRUSt pathways (indicated by white bar) are based on the KEGG ontology, thus the number of pathways inferred is not directly comparable to the other methods which are based on the MetaCyc ontology. B) The abundance of pathways inferred for but not identified in the metagenome.
Fig 3
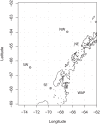
Fig 3. Sample locations in the West Antarctic Peninsula (WAP).
Summertime surface (10 m) and deep (100 m) samples are analyzed from two inshore and two offshore samples, organized along a North to South gradient. Winter surface water samples were analyzed from the northern, inshore station (NE).
Fig 4
Fig 4. Hierarchical clustering of samples by pathway and edge abundance.
Clustering used the Ward algorithm on Bray-Curtis distance. A) Hierarchical clustering by pathway after normalization to the maximum abundance of each pathway. B) Hierarchical clustering by edge abundance after normalization to the total abundance of each sample. C) Linear model (red line) for distance by edge abundance as a function of distance by pathway abundance, R2 = 0.65, df = 75, p ≈ 0. D) Linear model (red line) for distance by OTU abundance as a function of distance by pathway abundance, as predicted using PICRUSt (see text) [4].
Fig 5
Fig 5. Metabolic pathways and edges accounting for the most variance between samples.
A) PCA of normalized metabolic pathway abundance (see text). Arrows are vectors for the top twenty pathways ordered by their magnitude in PC1 and PC2. B) Heatmap of abundance for the top twenty pathways ordered by their magnitude in PC1 and PC2. Hierarchical clustering on the y-axis uses the defaults of the heatmap command in R; Euclidean distance and the complete linkage clustering method. C) PCA of normalized edge abundance (see text). Arrows are vectors of the top twenty edges ordered as for A. D) Heatmap of abundance for the top twenty edges ordered as for B. Hierarchical clustering on the y-axis is as for B. Values on the color bar are raw (not normalized) values.
Fig 6
Fig 6. Metabolic pathways differentially present between summer surface samples and winter and deep samples.
Color gives the p-value for a Mann-Whitney test between sample groups. X-axis gives the anomaly, calculated as the difference in sample group means divided by the sum of the sample group means.
Fig 7
Fig 7. Pathway abundance as a function of the number of edges pathway appears in for a given sample.
Inset is a histogram for abundance at the edge richness of 1 (i.e. the abundance of pathways with the lowest redundancy). Abundance and edge richness are linearly correlated (red line; R2 = 0.78, df = 11,623, p ≈ 0).

References

    1. DeLong EF, Preston CM, Mincer T, Rich V, Hallam SJ, Frigaard N-U, et al. Community genomics among stratified microbial assemblages in the ocean’s interior. Science. 2006;311: 496–503. 10.1126/science.1120250 - DOI - PubMed
    1. Bowman JS, Rasmussen S, Blom N, Deming JW, Rysgaard S, Sicheritz-ponten T. Microbial community structure of Arctic multiyear sea ice and surface seawater by 454 sequencing of the 16S RNA gene. ISMEJ. 2012;6: 11–20. 10.1038/ismej.2011.76 - DOI - PMC - PubMed
    1. Caro-Quintero A, Konstantinidis KT. Bacterial species may exist, metagenomics reveal. Environ Microbiol. 2012;14: 347–55. 10.1111/j.1462-2920.2011.02668.x - DOI - PubMed
    1. Langille MGI, Zaneveld J, Caporaso JG, McDonald D, Knights D, Reyes J a, et al. Predictive functional profiling of microbial communities using 16S rRNA marker gene sequences. Nat Biotechnol. Nature Publishing Group; 2013;31: 814–21. 10.1038/nbt.2676 - DOI - PMC - PubMed
    1. Martens K, Segers H. Taxonomy and systematics in biodiversity research. Hydrobiologia. 2005;542: 27–31. 10.1007/s10750-005-0892-z - DOI

Publication types

Substances