. 2016 Jan;10(1):24-39.
doi: 10.1016/j.molonc.2015.07.004. Epub 2015 Aug 7.

4-protein signature predicting tamoxifen treatment outcome in recurrent breast cancer

Affiliations

4-protein signature predicting tamoxifen treatment outcome in recurrent breast cancer

Tommaso De Marchi et al. Mol Oncol. 2016 Jan.

Abstract

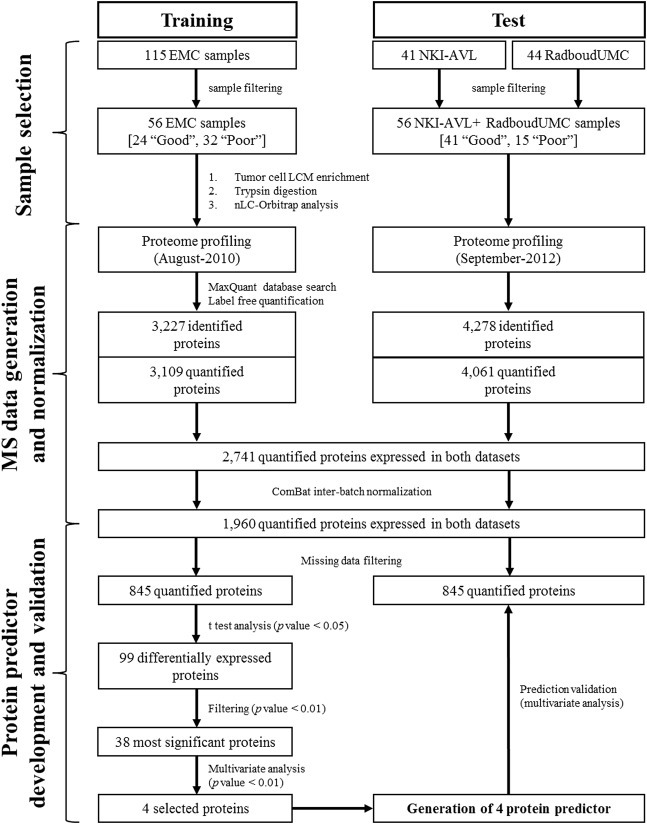
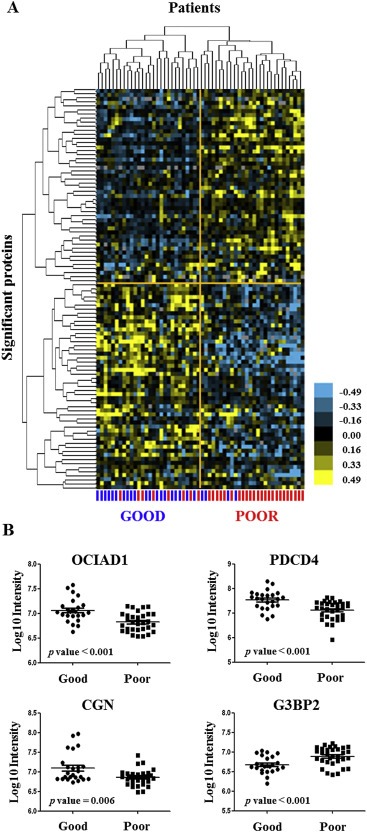
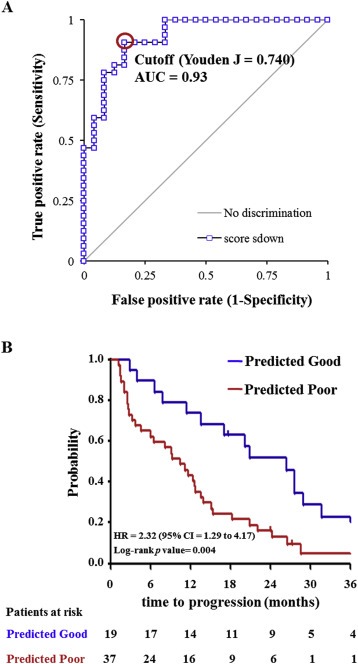
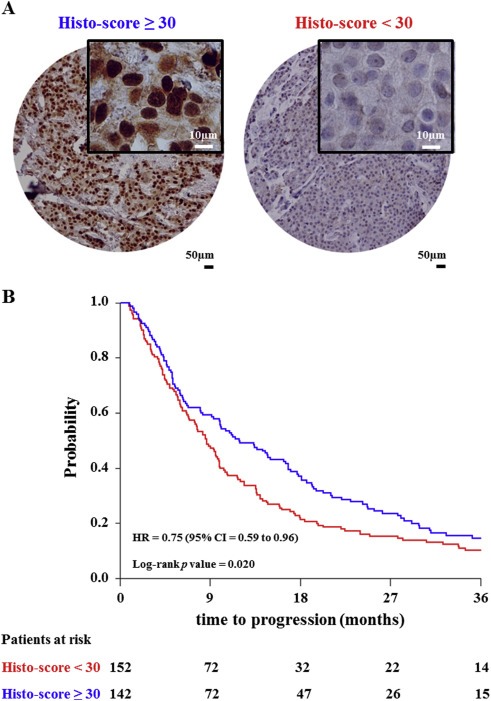
Estrogen receptor (ER) positive tumors represent the majority of breast malignancies, and are effectively treated with hormonal therapies, such as tamoxifen. However, in the recurrent disease resistance to tamoxifen therapy is common and a major cause of death. In recent years, in-depth proteome analyses have enabled identification of clinically useful biomarkers, particularly, when heterogeneity in complex tumor tissue was reduced using laser capture microdissection (LCM). In the current study, we performed high resolution proteomic analysis on two cohorts of ER positive breast tumors derived from patients who either manifested good or poor outcome to tamoxifen treatment upon recurrence. A total of 112 fresh frozen tumors were collected from multiple medical centers and divided into two sets: an in-house training and a multi-center test set. Epithelial tumor cells were enriched with LCM and analyzed by nano-LC Orbitrap mass spectrometry (MS), which yielded >3000 and >4000 quantified proteins in the training and test sets, respectively. Raw data are available via ProteomeXchange with identifiers PXD000484 and PXD000485. Statistical analysis showed differential abundance of 99 proteins, of which a subset of 4 proteins was selected through a multivariate step-down to develop a predictor for tamoxifen treatment outcome. The 4-protein signature significantly predicted poor outcome patients in the test set, independent of predictive histopathological characteristics (hazard ratio [HR] = 2.17; 95% confidence interval [CI] = 1.15 to 4.17; multivariate Cox regression p value = 0.017). Immunohistochemical (IHC) staining of PDCD4, one of the signature proteins, on an independent set of formalin-fixed paraffin-embedded tumor tissues provided and independent technical validation (HR = 0.72; 95% CI = 0.57 to 0.92; multivariate Cox regression p value = 0.009). We hereby report the first validated protein predictor for tamoxifen treatment outcome in recurrent ER-positive breast cancer. IHC further showed that PDCD4 is an independent marker.

Keywords: Biomarker; Breast cancer; Mass spectrometry; Proteomics; Tamoxifen resistance.


Figures

Figure 1
Figure 1
Data analysis flow‐chart and development of predictor for tamoxifen treatment outcome. Patients were divided into two independent cohorts and separately measured by LC‐MS. Proteomic data from training and test sets were analyzed separately in MaxQuant. Identified proteins were filtered for reversed sequences and for Posterior Error Probability score (PEP < 0.05), intensities of commonly expressed proteins were normalized using ComBat algorithm to minimize batch effects, and filtered for missing data (10 minimum observations for global proteomic analysis and allowing 30% and 0% missing data in training and test set respectively for predictor generation). Student t test (p value < 0.05) was then used to assess differences in protein expression levels between good and poor outcome patients. A multivariate regression model was used to obtain an optimal list of 4 proteins to be tested as a predictor of tamoxifen treatment outcome: CGN, G3BP2, PDCD4 and OCIAD1. The 4‐protein signature was confirmed in an external test set. Acronyms: EMC = Erasmus MC, University Medical Center; NKI‐AVL=Netherlands Cancer Institute‐ Antoni van Leeuwenhoek hospital; RadboudUMC = Radboud University Medical Center.
Figure 2
Figure 2
Protein abundance levels in 112 ER positive breast cancer samples. The waterfall plot shows mean protein abundance distribution of 1.960 commonly expressed proteins. The mean abundance of each quantified protein was calculated and plotted. The 30 least (blue) and most (red) abundant proteins are boxed in panel (A) and enlarged in panel (B) and (C), respectively.
Figure 3
Figure 3
Protein compartmentalization and abundance correlation analysis. Panel shows quantified protein abundance range per subcellular compartment in the LCM enriched 112 ER positive tumors (A) and in WTL control replicates (B). Number of proteins per compartment and percentages are displayed above the dot plot.
Figure 4
Figure 4
Hierarchical clustering and differential protein abundance of 4‐protein predictor. Samples in the training set (n = 56) were hierarchically clustered based on 99 differentially abundant proteins (t test p value < 0.05). Log10 intensities of differentially abundant proteins constituting the predictor for tamoxifen treatment outcome are shown in scatter dot plots. Eight poor and four good outcome patients were misclassified (A). Three out of four proteins, CGN (Uniprot accession number: Q9P2M7; p value = 0.006), OCIAD1 (Uniprot accession number: Q9NX40; p value < 0.001) and PDCD4 (Uniprot accession number: Q53EL6; p value < 0.001), had higher abundance in patients with good outcome, whereas G3BP2 (Uniprot accession number Q9UN86; p value < 0.001) was found more highly expressed in the poor outcome patient group (B).
Figure 5
Figure 5
ROC curve of the training set and Kaplan–Meier curves for TTP as a function of predicted outcome in patients in the test set. Patient outcome scores from the training set were calculated based on abundance levels of the 4 predictor proteins and protein weights (i.e. Student t value). The ROC curve was generated and Youden maximum (J = 0.740) was chosen as the best discriminatory cutoff (A). Patient scores were subsequently calculated for patients in the test set, survival curves were generated for the predicted groups and differences were assessed with the Log‐rank test (B). Acronym: AUC: area under the curve; HR: hazard ratio; CI: confidence interval.
Figure 6
Figure 6
PDCD4 immunohistochemical staining of tissue micro‐array. Tissue cores showed two different staining patterns that have been evaluated by histo‐score (i.e. Histo‐score < 30 and ≥ 30), representing low and high PDCD4 protein expression (A). Patients were categorized according to histo‐score cutoff and TTP was plotted as a Kaplan–Meier curve. The Log‐rank test was used to test for differences in TTP between the two survival curves (B). Acronym: HR: hazard ratio; CI: confidence interval.

References

    1. Altman, D.G. , McShane, L.M. , Sauerbrei, W. , Taube, S.E. , 2012. Reporting Recommendations for Tumor Marker Prognostic Studies (REMARK): explanation and elaboration. PLoS Med. 9, e1001216 - DOI - PMC - PubMed
    1. Beelen, K. , Zwart, W. , Linn, S.C. , 2012. Can predictive biomarkers in breast cancer guide adjuvant endocrine therapy?. Nat. Rev. Clin. Oncol. 9, 529–541. - DOI - PubMed
    1. Biyanee, A. , Ohnheiser, J. , Singh, P. , Klempnauer, K.-H. , 2014. A novel mechanism for the control of translation of specific mRNAs by tumor suppressor protein Pdcd4: inhibition of translation elongation. Oncogene. 1–9. - DOI - PubMed
    1. Bland, J. , Altman, D. , 1996. Measurement error proportional to the mean. BMJ Br. Med. J. 313, 1996 - PMC - PubMed
    1. Braakman, R.B.H. , Tilanus-Linthorst, M.M. , Liu, N.Q. , Stingl, C. , Dekker, L.J.M. , Luider, T.M. , Martens, J.W.M. , Foekens, J.A. , Umar, A. , 2012. Optimized nLC-MS workflow for laser capture microdissected breast cancer tissue. J. Proteomics. 75, 2844–2854. - DOI - PubMed

Publication types