Variation in hospital caesarean section rates for women with at least one previous caesarean section: a population based cohort study
- PMID: 26285692
- PMCID: PMC4545707
- DOI: 10.1186/s12884-015-0609-x
Variation in hospital caesarean section rates for women with at least one previous caesarean section: a population based cohort study
Abstract
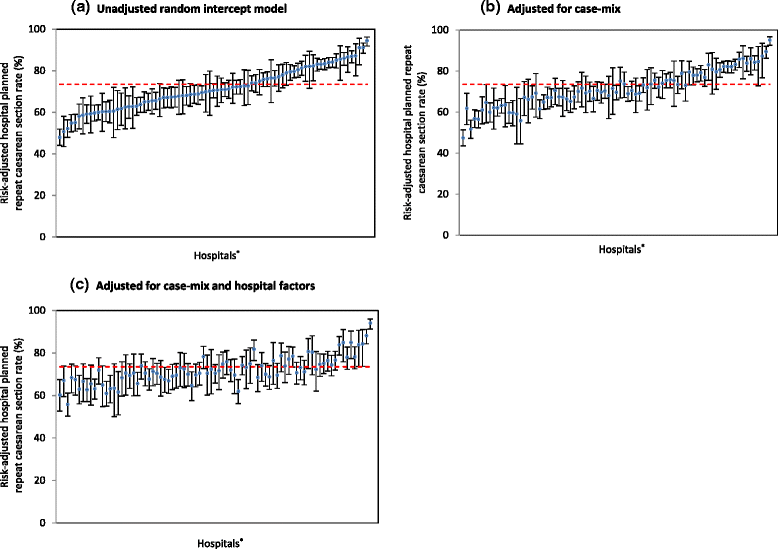
Background: Internationally, repeat caesarean sections make the largest contribution to overall caesarean section rates and inter-hospital variation has been reported. The aim of this study was to determine if casemix and hospital factors explain variation in hospital rates of repeat caesarean sections and whether these rates are associated with maternal and neonatal morbidity.
Methods: This population-based record linkage study utilised data from New South Wales, Australia between 2007 and 2011. The study population included maternities with any previous caesarean section(s) and were singleton, cephalic and ≥ 37 weeks' gestation (Robson Group 5). Multilevel regression models were used to examine variation in hospital rates of 'planned repeat caesarean section' and, among women who planned a vaginal birth, 'intrapartum caesarean section'. We assessed associations between risk-adjusted hospital rates of planned and intrapartum caesarean sections and rates of casemix adjusted maternal and neonatal morbidity, postpartum haemorrhage and Apgar score <7 at five minutes.
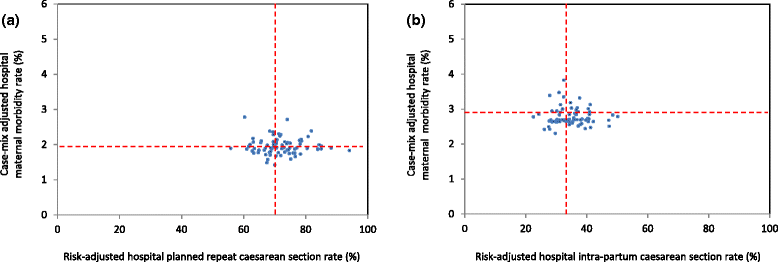
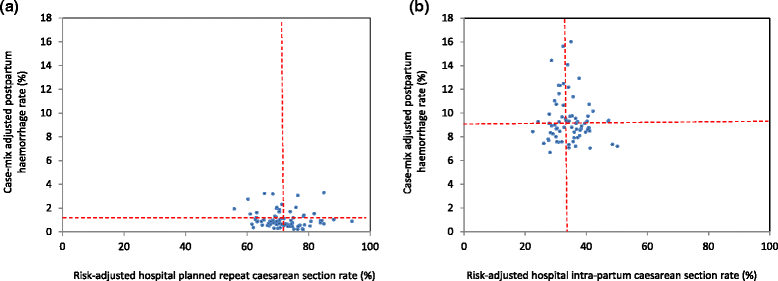
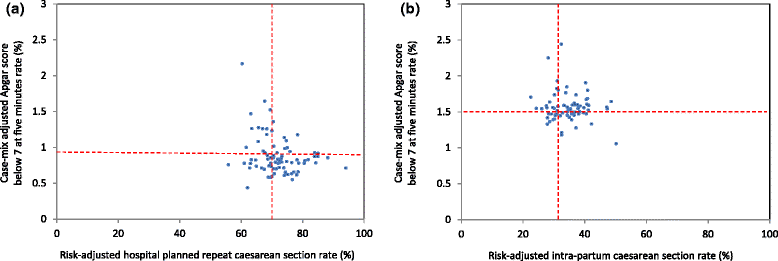
Results: Of 61894 maternities with a previous caesarean section in 81 hospitals, 82.1% resulted in a caesarean section (72.7% planned and 9.4% unplanned intrapartum caesareans) and 17.9% in vaginal birth. Observed hospital rates of planned caesarean sections ranged from 50.7% to 98.4%. Overall 49.0% of between-hospital variation in planned repeat caesarean section rates was explained by patient (17.3%) and hospital factors (31.7%). Increased odds of planned caesarean section were associated with private hospital status and lower hospital propensity for vaginal birth after caesarean. There were no associations between hospital rates of planned repeat caesarean section and adjusted morbidity rates. Among women who intended a vaginal birth, the observed rates of intrapartum caesarean section ranged from 12.9% to 71.9%. In total, 27.5% of between-hospital variation in rates of intrapartum caesarean section was explained by patient (19.5%) and hospital factors (8.0%). The adjusted morbidity rates differed among hospital intrapartum caesarean section rates, but were influenced by a few hospitals with outlying morbidity rates.
Conclusions: Among women with at least one previous caesarean section, less than half of the variation in hospital caesarean section rates was explained by differences in hospital's patient characteristics and practices. Strategies aimed at modifying caesarean section rates for these women should not affect morbidity rates.
Figures


References
-
- AIHW . Perinatal statistics series no 30 Cat no PER 69. Canberra: Australian Institute of Health and Welfare (AIHW); 2014. Australia's mothers and babies 2012.
-
- NHS Information Centre (NHS IC): NHS maternity statistics, England: 2013–14. In: Health and Social Care Information Centre, Hospital Episode Statistics. Leeds: [http://www.hscic.gov.uk/catalogue/PUB16725/nhs-mate-eng-2013-14-summ-rep...] Accessed 19 March 2015; 2015.
-
- Osterman M, Martin J: Changes in cesarean delivery rates by gestational age: United States, 1996–2011. In. Hyattsville, MD: National Center for Health Statistics; 2013. - PubMed
Publication types
MeSH terms
LinkOut - more resources
Full Text Sources
Other Literature Sources

