. 2015 Aug 19:5:12637.
doi: 10.1038/srep12637.

The Phosphorylation Profile of Myosin Binding Protein-C Slow is Dynamically Regulated in Slow-Twitch Muscles in Health and Disease

Affiliations

The Phosphorylation Profile of Myosin Binding Protein-C Slow is Dynamically Regulated in Slow-Twitch Muscles in Health and Disease

Maegen A Ackermann et al. Sci Rep. .

Erratum in

Abstract

Myosin Binding Protein-C slow (sMyBP-C) is expressed in skeletal muscles where it plays structural and regulatory roles. The functions of sMyBP-C are modulated through alternative splicing and phosphorylation. Herein, we examined the phosphorylation profile of sMyBP-C in mouse slow-twitch soleus muscle isolated from fatigued or non-fatigued young (2-4-months old) and old (~14-months old) wild type and mdx mice. Our findings are two-fold. First, we identified the phosphorylation events present in individual sMyBP-C variants at different states. Secondly, we quantified the relative abundance of each phosphorylation event, and of sMyBP-C phospho-species as a function of age and dystrophy, in the presence or absence of fatigue. Our results revealed both constitutive and differential phosphorylation of sMyBP-C. Moreover, we noted a 10-40% and a 25-35% reduction in the phosphorylation levels of select sites in old wild type and young or old mdx soleus muscles, respectively. On the contrary, we observed a 5-10% and a 20-25% increase in the phosphorylation levels of specific sites in young fatigued wild type and mdx soleus muscles, respectively. Overall, our studies showed that the phosphorylation pattern of sMyBP-C is differentially regulated following reversible (i.e. fatigue) and non-reversible (i.e. age and disease) (patho)physiological stressors.


Figures

Figure 1
Figure 1. sMyBP-C is phosphorylated within its NH2-terminus.
Schematic representation of the NH2-terminus of the known human and mouse variants of sMyBP-C with the phosphorylation sites highlighted. The Pro/Ala rich and M- motifs are denoted in dark and light grey, respectively. The first Ig domain (C1) is shown as a white oval. Colored rectangles indicate short stretches of amino acids that are products of alternatively spliced regions.
Figure 2
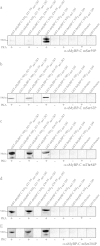
Figure 2. Characterization of the four α-sMyBP-C mSer59P, α-sMyBP-C mSer62P, α-sMyBP-C mThr84P and α-sMyBP-C mSer204P phospho-specific antibodies.
In vitro kinase assays were used to determine the specificity of each phospho-antibody. The NH2-termini of sMyBP-C and the NH2-terminus of fMyBP-C were produced as GST-fusion proteins and treated with PKA and/or PKC depending on the phospho-antibody tested. Untreated and treated recombinant proteins were separated via standard SDS-PAGE and probed with the appropriate phospho-specific antibody to mSer59 (a) mSer62 (b) mThr84 (c) and mSer204 (d–e). Notably, none of the phospho-antibodies recognized the untreated NH2-terminus of the slow isoform or the PKA- or PKC-treated NH2-terminus of the fast isoform or control-GST. Therefore, these antibodies are specific for their respective phosphorylated residues present in the NH2-terminus of sMyBP-C.
Figure 3
Figure 3. Assessment of intra- and inter-dependent phosphorylation events within the NH2-terminus of sMyBP-C.
In vitro kinase assays were used to determine the intra- and inter-dependence of sMyBP-C phosphorylation events within the Pro/Ala rich motif and between the Pro/Ala rich motif and M-motif. Wild type and phospho-ablated mutant recombinant proteins containing the NH2-terminus of sMyBP-C corresponding to m-isoform3 were produced as GST-fusion proteins and incubated with PKA and/or PKC. Treated proteins were separated by standard SDS-PAGE, and probed with the appropriate phospho-specific antibody to mSer59 (a) mSer62 (b) mThr84 (c) and mSer204 (d).
Figure 4
Figure 4. Examination of the phosphorylation profile of sMyBP-C in young and old wild type and mdx soleus muscles in the absence or presence of fatigue.
(a) Western blot analysis of protein lysates separated by standard SDS-PAGE and prepared from six soleus muscle groups, including: 1. young (~2 months) wild type (n = 7), 2. old (~14 months) wild type (n = 4), 3. young (~4 months) wild type subjected to fatigue (n = 3), 4. young (~2 months) mdx (n = 4), 5. old (~14 months) mdx (n = 4), and 6. young (~4 months) mdx subjected to fatigue (n = 3). Samples were probed with a pan-specific antibody recognizing all variants of sMyBP-C, α-pan-sMyBP-C, and α-Hsp90 to ensure equal loading. (a’) Calculation of the percent (%) expression of total sMyBP-C in the different soleus muscle groups, after normalization to the expression levels of Hsp90, relative to the percent (%) expression of sMyBP-C in young wild type tissue, which was set as baseline. Significance was calculated via student’s t-test (p < 0.01). The symbols * and # denote statistical significance compared to young wild type and young mdx tissue, respectively. (c) Separation of the same protein lysates used in panel (a) by phosphate affinity SDS-PAGE followed by immunoprobing with the α-pan-sMyBP-C antibody. Colored dots denote immunoreactive bands of low (red and yellow dots), intermediate (light green, dark green, turquoise and dark blue dots), and high (purple, pink, light pink, orange and white dots) mobility.
Figure 5
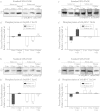
Figure 5. Evaluation of the phosphorylation levels of mSer59, mSer62, mThr84, and mSer204 of sMyBP-C in slow-twitch soleus muscles of young and old wild type and mdx animals in the presence or absence of fatigue.
Western blot analyses were performed using standard SDS-PAGE and lysates prepared from the six soleus muscle groups described in Fig. 4. Samples were probed with antibodies recognizing the four known phospho-sites of sMyBP-C, including α-sMyBP-C mSer59P (a), α-sMyBP-C mSer62P (b) α-sMyBP-C mThr84P (c) and α-sMyBP-C mSer204P (d). The levels of each phosphorylated residue, mSer59 (a’) mSer62 (b’) mThr84 (c’) and mSer204 (d’) in the different soleus muscles were calculated as percent (%) expression relative to those in young wild type tissue, as described in Fig. 4. Significance was calculated via student’s t-test (p < 0.01). The symbols *, #, and @ denote statistical significance compared to young wild type, young mdx, and old wild type tissues, respectively.
Figure 6
Figure 6. Identification of the phosphorylation events present in individual sMyBP-C forms.
Western blot analysis using phosphate affinity SDS-PAGE blots of protein lysates obtained from the six soleus muscle groups described in Fig. 4 were probed with the four sMyBP-C phospho-specific antibodies: α-sMyBP-C mSer59P (a) α-sMyBP-C mSer62P (b) α-sMyBP-C mThr84P (c) and α-sMyBP-C mSer204P (d). Colored dots denote low, intermediate, and high mobility sMyBP-C phospho-species identified with each antibody, and correspond to those shown in Fig. 4.
Figure 7
Figure 7. Relative abundance and phosphorylation profile of individual sMyBP-C forms.
(a) The relative abundance of each immunoreactive band detected with the α-pan-sMyBP-C antibody following separation of protein lysates by phosphate affinity SDS-PAGE (Fig. 4B) was calculated as percent (%) expression of the total protein content within each sample. Significance is as described in Fig. 4A’. (b) The phosphorylation events detected in each sMyBP-C species across the six different soleus muscle groups were determined by comparative evaluation of the phosphate affinity SDS-PAGE immunoblots shown in Fig. 6. It is important to note that colored dots correspond to sMyBP-C immunoreactive bands with specific electrophoretic mobility as determined by phosphate affinity SDS-PAGE, and thus may represent different (i.e. bands denoted with red, yellow, light green, dark green, purple, and pink dots) or the same (i.e. bands denoted with dark blue, light pink, orange, and white dots) sMyBP-C phospho-species across the six soleus muscle groups.

References

    1. Ackermann M. A., Hu L.-Y. R., Bowman A. L., Bloch R. J. & Kontrogianni-Konstantopoulos A. Obscurin interacts with a novel isoform of MyBP-C slow at the periphery of the sarcomeric M-band and regulates thick filament assembly. Molecular biology of the cell 20, 2963–2978, 10.1091/mbc.E08-12-1251 (2009). - DOI - PMC - PubMed
    1. Ackermann M. A. et al. Loss of actomyosin regulation in distal arthrogryposis myopathy due to mutant myosin binding protein-C slow. FASEB J 27, 3217–3228, fj.13-228882 (2013). - PMC - PubMed
    1. De Tombe P. P. Myosin binding protein C in the heart. Circ Res 98, 1234–1236, 98/10/1234 (2006). - PubMed
    1. James J. & Robbins J. Signaling and myosin-binding protein C. J Biol Chem 286, 9913–9919, R110.171801 (2011). - PMC - PubMed
    1. Martyn D. A. Myosin binding protein-C: structural and functional complexity. J Mol Cell Cardiol 37, 813–815, 10.1016/j.yjmcc.2004.07.005 (2004). - DOI - PubMed

Publication types