Quantitative analysis of pathogens in the lower respiratory tract of patients with chronic obstructive pulmonary disease
- PMID: 26286268
- PMCID: PMC4543462
- DOI: 10.1186/s12890-015-0094-z
Quantitative analysis of pathogens in the lower respiratory tract of patients with chronic obstructive pulmonary disease
Abstract
Background: Bacterial infection of the lower respiratory tract is believed to play a major role in the pathogenesis of chronic obstructive pulmonary disease (COPD) and acute exacerbations of COPD (AECOPD). This study investigates the potential relationship between AECOPD and the load of six common bacterial pathogens in the lower respiratory tract using real-time quantitative PCR (RT-qPCR) in COPD patients.
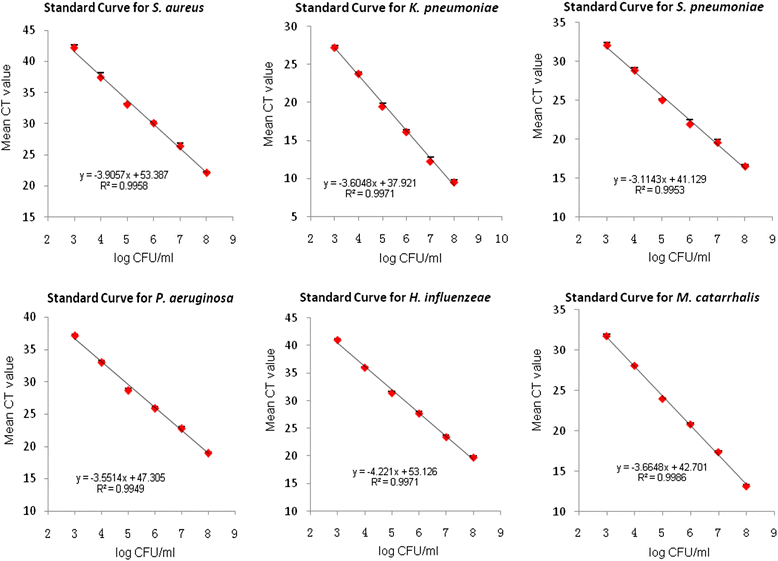
Methods: Protected specimen brush (PSB) and bronchoalveolar lavage fluid (BALF) samples from the lower respiratory tract of 66 COPD patients and 33 healthy subjects were collected by bronchoscopy. The load of Staphylococcus aureus, Klebsiella pneumoniae, Streptococcus pneumoniae, Pseudomonos aeruginosa, Haemophilus influenzeae, and Moraxella catarrhalis were detected by RT-qPCR.
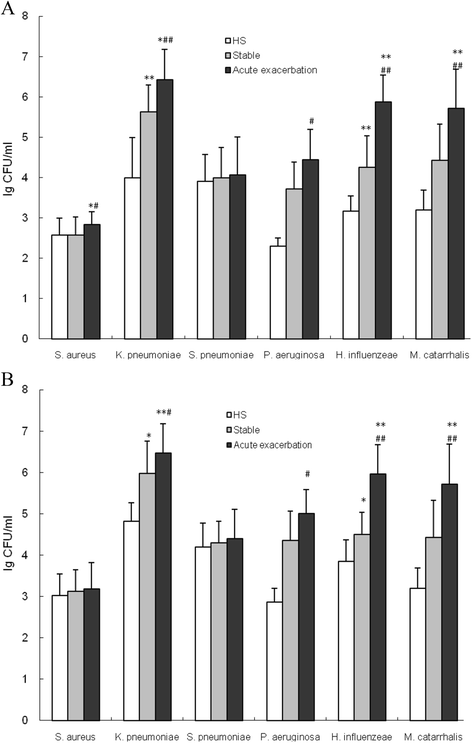
Results: High Klebsiella pneumoniae, Pseudomonos aeruginosa, Haemophilus influenzeae and Moraxella catarrhalis burden were detected by RT-qPCR in both PSB and BALF samples obtained from stable COPD and AECOPD patients compared with healthy subjects. The load of the above four pathogenic strains in PSB and BALF samples obtained from AECOPD patients were significantly higher compared with stable COPD patients. Finally, positive correlations between bacterial loads and inflammatory mediators such as neutrophil count and cytokine levels of IL-1β, IL-6 and IL-8, as well as negative correlations between bacterial loads and the forced expiratory volume in one second (FEV1) % predicted, forced vital capacity (FVC) % predicted, and FEV1/FVC ratio, were detected.
Conclusions: These findings suggest that increased bacterial loads mediated inflammatory response in the lower respiratory tract and were associated with AECOPD. In addition, these results provide guidance for antibiotic therapy of AECOPD patients.
Figures


Similar articles
-
Microbiologic determinants of exacerbation in chronic obstructive pulmonary disease.Arch Intern Med. 2005 Apr 25;165(8):891-7. doi: 10.1001/archinte.165.8.891. Arch Intern Med. 2005. PMID: 15851640
-
Analysis of the bronchoalveolar lavage fluid microbial flora in COPD patients at different lung function during acute exacerbation.Sci Rep. 2025 Apr 16;15(1):13179. doi: 10.1038/s41598-025-96746-5. Sci Rep. 2025. PMID: 40240456 Free PMC article.
-
Association between pathogens detected using quantitative polymerase chain reaction with airway inflammation in COPD at stable state and exacerbations.Chest. 2015 Jan;147(1):46-55. doi: 10.1378/chest.14-0764. Chest. 2015. PMID: 25103335 Free PMC article.
-
Murine model of chronic respiratory inflammation.Adv Exp Med Biol. 2011;780:125-41. doi: 10.1007/978-1-4419-5632-3_11. Adv Exp Med Biol. 2011. PMID: 21842370 Review.
-
[Chronic obstructive pulmonary disease and bronchial colonization/infection].Presse Med. 2001 Oct 27;30(31 Pt 2):11-5. Presse Med. 2001. PMID: 11721485 Review. French.
Cited by
-
Early detection of bacterial pneumonia by characteristic induced odor signatures.BMC Infect Dis. 2024 Dec 27;24(1):1467. doi: 10.1186/s12879-024-10371-7. BMC Infect Dis. 2024. PMID: 39731069 Free PMC article.
-
Inoculum effect of β-lactam antibiotics.J Antimicrob Chemother. 2019 Oct 1;74(10):2825-2843. doi: 10.1093/jac/dkz226. J Antimicrob Chemother. 2019. PMID: 31170287 Free PMC article. Review.
-
Effects of Atmospheric Fine Particulate Matter and Its Carrier Microbes on Pulmonary Microecology in Patients with COPD.Int J Chron Obstruct Pulmon Dis. 2021 Jul 12;16:2049-2063. doi: 10.2147/COPD.S314265. eCollection 2021. Int J Chron Obstruct Pulmon Dis. 2021. PMID: 34285479 Free PMC article.
-
Drivers of year-to-year variation in exacerbation frequency of COPD: analysis of the AERIS cohort.ERJ Open Res. 2019 Feb 25;5(1):00248-2018. doi: 10.1183/23120541.00248-2018. eCollection 2019 Feb. ERJ Open Res. 2019. PMID: 30815467 Free PMC article.
-
NLRP3 Inflammasome Involves in the Acute Exacerbation of Patients with Chronic Obstructive Pulmonary Disease.Inflammation. 2018 Aug;41(4):1321-1333. doi: 10.1007/s10753-018-0780-0. Inflammation. 2018. PMID: 29656319
References
Publication types
MeSH terms
Substances
LinkOut - more resources
Full Text Sources
Other Literature Sources
Medical
Molecular Biology Databases

