. 2015 Oct;26(9-10):511-20.
doi: 10.1007/s00335-015-9595-6. Epub 2015 Aug 19.

Collaborative Cross and Diversity Outbred data resources in the Mouse Phenome Database

Affiliations

Collaborative Cross and Diversity Outbred data resources in the Mouse Phenome Database

Molly A Bogue et al. Mamm Genome. 2015 Oct.

Abstract

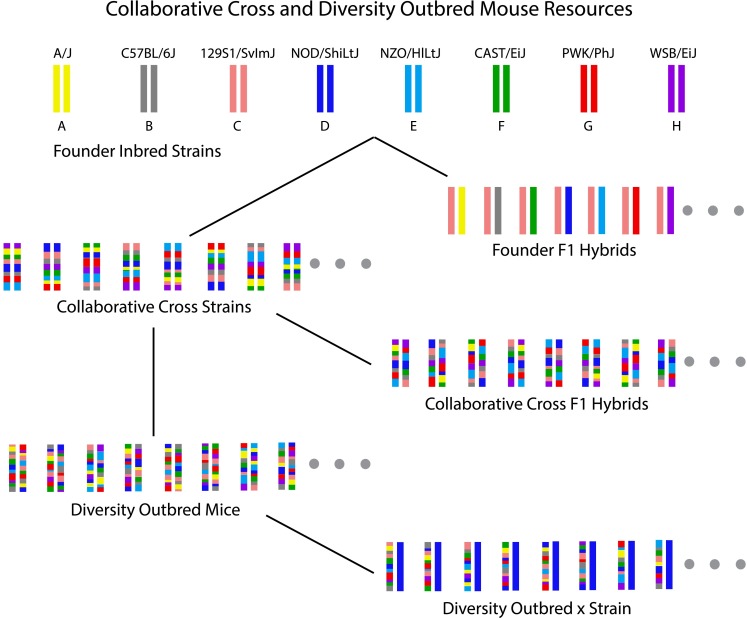
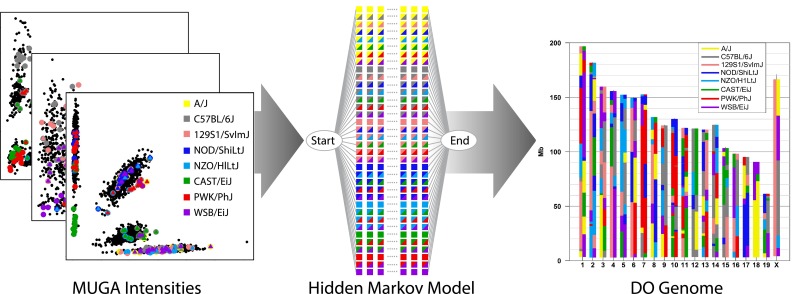
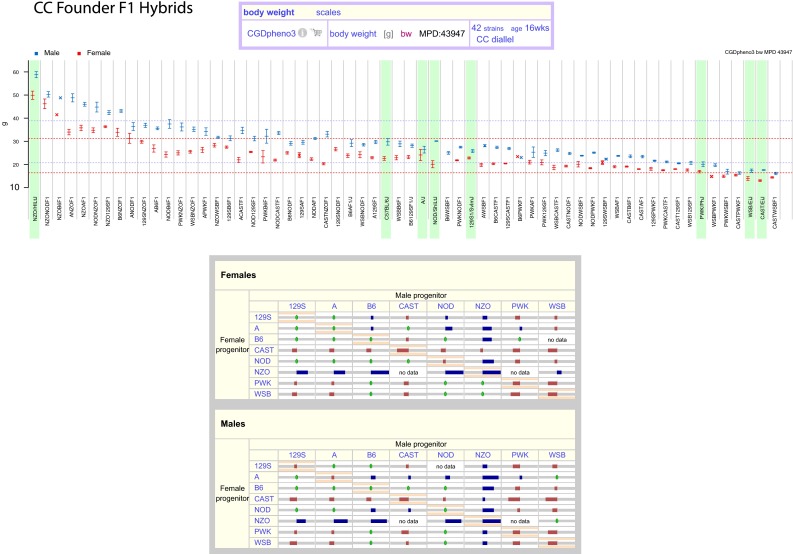
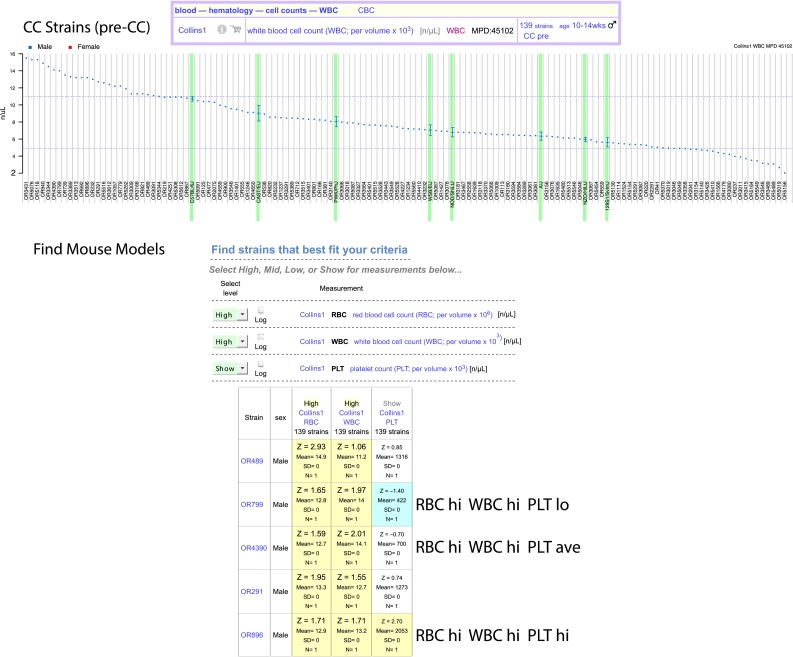
The Mouse Phenome Database was originally conceived as a platform for the integration of phenotype data collected on a defined collection of 40 inbred mouse strains--the "phenome panel." This model provided an impetus for community data sharing, and integration was readily achieved through the reproducible genotypes of the phenome panel strains. Advances in the development of mouse populations lead to an expanded role of the Mouse Phenome Database to encompass new strain panels and inbred strain crosses. The recent introduction of the Collaborative Cross and Diversity Outbred mice, which share an extensive pool of genetic variation from eight founder inbred strains, presents new opportunities and challenges for community data resources. A wide variety of molecular and clinical phenotypes are being collected across genotypes, tissues, ages, environmental exposures, interventions, and treatments. The Mouse Phenome Database provides a framework for retrieval, integration, analysis, and display of these data, enabling them to be evaluated in the context of existing data from standard inbred strains. Primary data in the Mouse Phenome Database are supported by extensive metadata on protocols and procedures. These are centrally curated to ensure accuracy and reproducibility and to provide data in consistent formats. The Mouse Phenome Database represents an established and growing community data resource for mouse phenotype data and encourages submissions from new mouse resources, enabling investigators to integrate existing data into their studies of the phenotypic consequences of genetic variation.


Figures

Fig. 1
Fig. 1
Collaborative Cross (CC) and Diversity Outbred (DO) mouse resources. The eight founder strains are depicted at the top as color-coded chromosomes. Color-coding for these strains has been agreed upon by the research community and standardized. Founder F1 hybrid offspring are produced from crossing two founder strains and are thus reproducible. Theoretically, there are 102 possible F1 hybrids (including reciprocal crosses). CC strains are inbred (homozygous at most loci) and reproducible. CC F1 hybrids are offspring produced from crossing two CC strains and are thus reproducible. There are many possibilities for CC F1 hybrids. DO mice were derived from CC strains through strict breeding protocols to maintain heterogeneous stocks and are thus not reproducible. Theoretically, there is an unlimited supply of DO mice. They are typically tested as a population of over 100 unique mice. “DO × strain” mice are produced from a DO mouse crossed to an inbred strain. Because DO mice are not reproducible, “DO × strain” mice are likewise not reproducible
Fig. 2
Fig. 2
DO genotyping. High-density genotyping platform—mouse universal genotyping arrays (MUGA)—have been developed to assay the genetic diversity of CC and DO mice. The raw intensity data (left) from genotyping arrays provide the additional information that is not available from the binary SNP genotyping calls. Specialized Hidden Markov Model software (center) has been developed to recover the parental haplotype block structure of individual mice (right). This example is for a DO mouse
Fig. 3
Fig. 3
CC Founder F1 Hybrids. Data for the eight CC founder strains (green highlight) and F1 hybrids can be viewed in multiple ways. The upper panel shows a measurement plot with strain on the x-axis and body weight on the y-axis. Males are in blue and females in red (mean ± SEM). The overall mean (by sex) and ± one standard deviation are indicated by dotted lines. There are plotting options available for this tool, including output format (here we used eps). The lower panel illustrates a z-score matrix of the outcome of pairwise matings for body weight. Female offspring are shown in the top matrix and male offspring in the lower matrix. Within each matrix, the female progenitor strain is shown in the first column and the male progenitor strain is shown in the first row. Matings between individual inbred strains (on the diagonal) were conducted at the same time F1 hybrids were generated. In this case, blue indicates high-end outliers (Z > 1.0), red indicates low-end outliers (Z < −1.0), and green indicates average (within ± 1 standard deviation). “No data” indicate instances where offspring could not be generated. This body weight data is from MPD project CGDpheno3 (Svenson et al. 2012b)
Fig. 4
Fig. 4
CC Strains. Data for CC strains can be viewed in a measurement plot as shown in the upper panel for white blood cell count (WBC), where strains are along the x-axis and WBC is on the y-axis. In this example, only males were tested (blue). There are options for plotting these results as well as output options (here we chose eps). The lower panel illustrates the criteria-fit tool. In this example, we wanted to identify CC strains with high red blood cell count (RBC) and high WBC, but with a wide range of values for platelet count (PLT). We first selected our measurements of interest (this step not shown) and applied the tool. Then we selected “High,” “Mid,” “Low,” or “Show” for each measurement according to our criteria. Results (truncated) are shown in a screenshot where high-end outliers are in yellow and low-end outliers are in blue. These blood cell parameters are from MPD project Collins1 (Collins ; Kelada et al. 2012)
Fig. 5
Fig. 5
Diversity Outbred (DO). Individual measurements from DO populations can be viewed as a histogram as shown in the left panel. Females (red) are above and males (blue) below. The founder strains (green) are indicated above the histogram (mean ± SEM). There are plotting options available for this tool as well as output options (here we used eps). The right panel shows a screenshot of a correlations matrix for all pairwise measurements. Red values indicate positive correlations, blue indicated negative. The more intense the color, the stronger the correlation. Users can view detailed scatterplots (inset) by clicking on cells of the matrix. Correlation coefficients and p values are provided just below the scatterplot. Plot options are available for this tool. Data are from MPD project Chesler4 (Logan et al. 2013a, b)
Fig. 6
Fig. 6
CC founder strain—gene expression viewer at do.jax.org. Users are able to input their gene of interest (in this case, Mvd) and generate a plot of the results across all founder strains (left panel) through programmatic access to the underlying data. Users can also query the database to find the top 100 correlations between their gene of interest and other gene expression profiles. In this case, the top gene found was Lss (middle panel). A scatterplot is available to view the gene expression relationship, with Pearson correlation coefficient provided (right panel)

References

    1. Ananda G, Takemon Y, Hinerfeld D, Korstanje R. Whole-genome sequence of the C57L/J mouse inbred strain. G3 (Bethesda) 2014;4:1689–1692. doi: 10.1534/g3.114.012997. - DOI - PMC - PubMed
    1. Bennett BJ, Farber CR, Orozco L, Kang HM, Ghazalpour A, Siemers N, Neubauer M, Neuhaus I, Yordanova R, Guan B, Truong A, Yang WP, He A, Kayne P, Gargalovic P, Kirchgessner T, Pan C, Castellani LW, Kostem E, Furlotte N, Drake TA, Eskin E, Lusis AJ. A high-resolution association mapping panel for the dissection of complex traits in mice. Genome Res. 2010;20:281–290. doi: 10.1101/gr.099234.109. - DOI - PMC - PubMed
    1. Boguski MS. Comparative genomics: the mouse that roared. Nature. 2002;420:515–516. doi: 10.1038/420515a. - DOI - PubMed
    1. Brown SD, Moore MW. The international mouse phenotyping consortium: past and future perspectives on mouse phenotyping. Mamm Genome. 2012;23:632–640. doi: 10.1007/s00335-012-9427-x. - DOI - PMC - PubMed
    1. Bubier JA, Jay JJ, Baker CL, Bergeson SE, Ohno H, Metten P, Crabbe JC, Chesler EJ. Identification of a QTL in Mus musculus for alcohol preference, withdrawal, and Ap3m2 expression using integrative functional genomics and precision genetics. Genetics. 2014;197:1377–1393. doi: 10.1534/genetics.114.166165. - DOI - PMC - PubMed

Publication types

LinkOut - more resources