. 2015 Sep 1;112(35):E4949-58.
doi: 10.1073/pnas.1513426112. Epub 2015 Aug 18.

Propagation of prions causing synucleinopathies in cultured cells

Affiliations

Propagation of prions causing synucleinopathies in cultured cells

Amanda L Woerman et al. Proc Natl Acad Sci U S A. .

Abstract

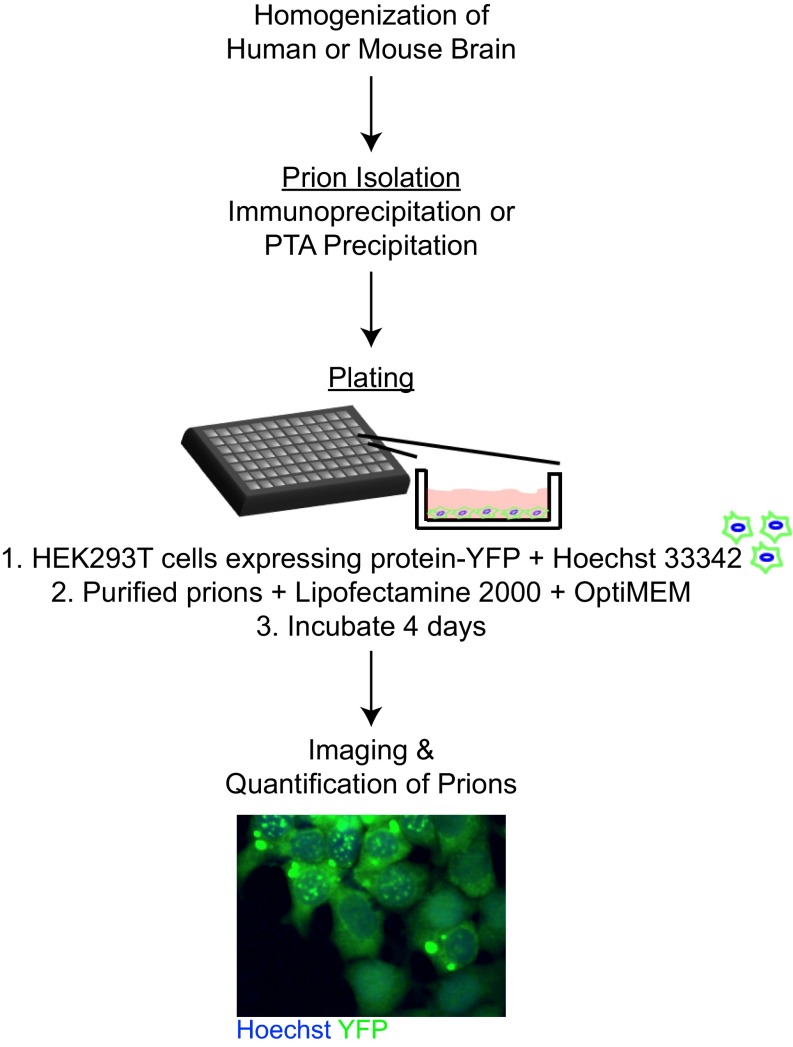
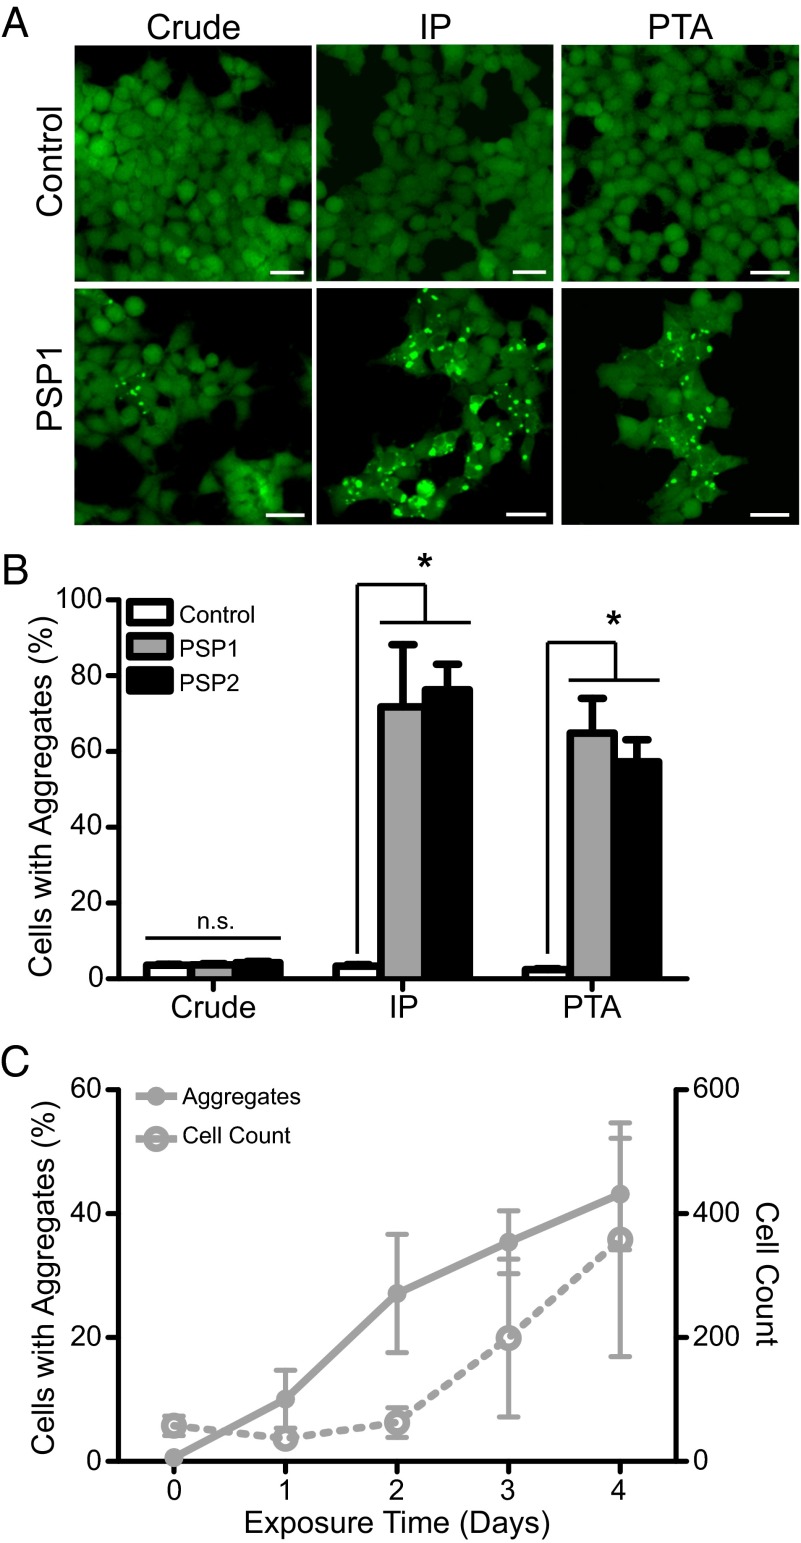
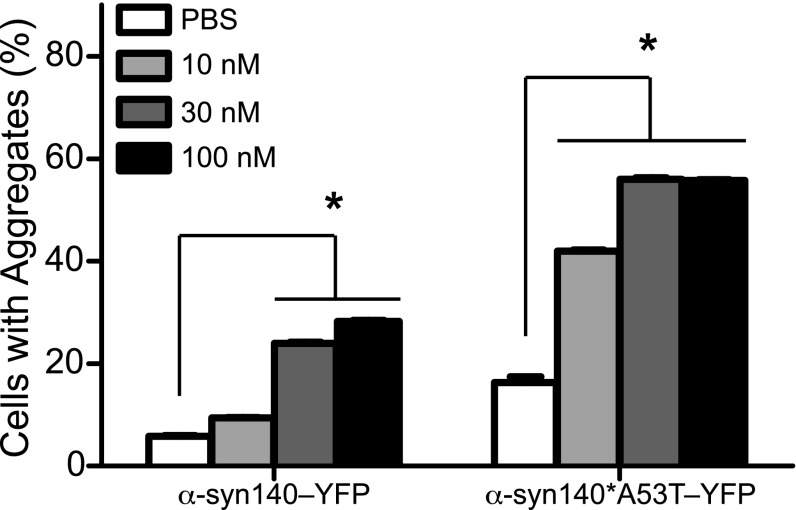
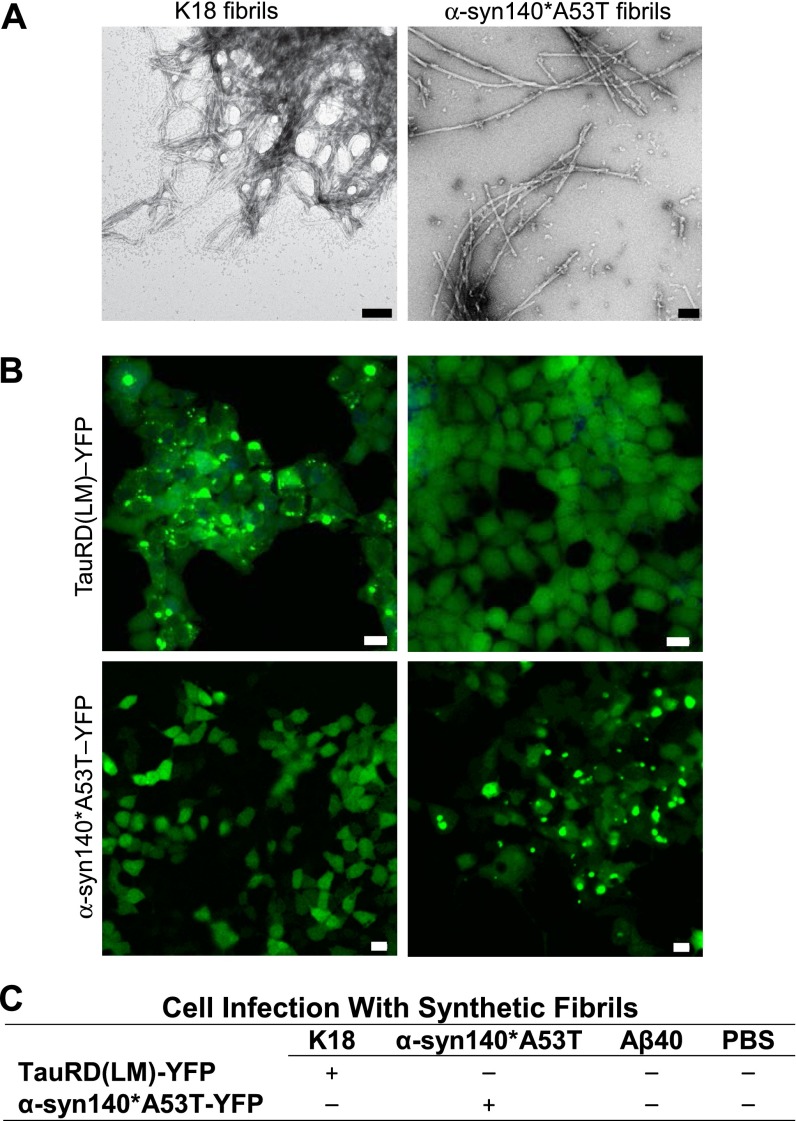
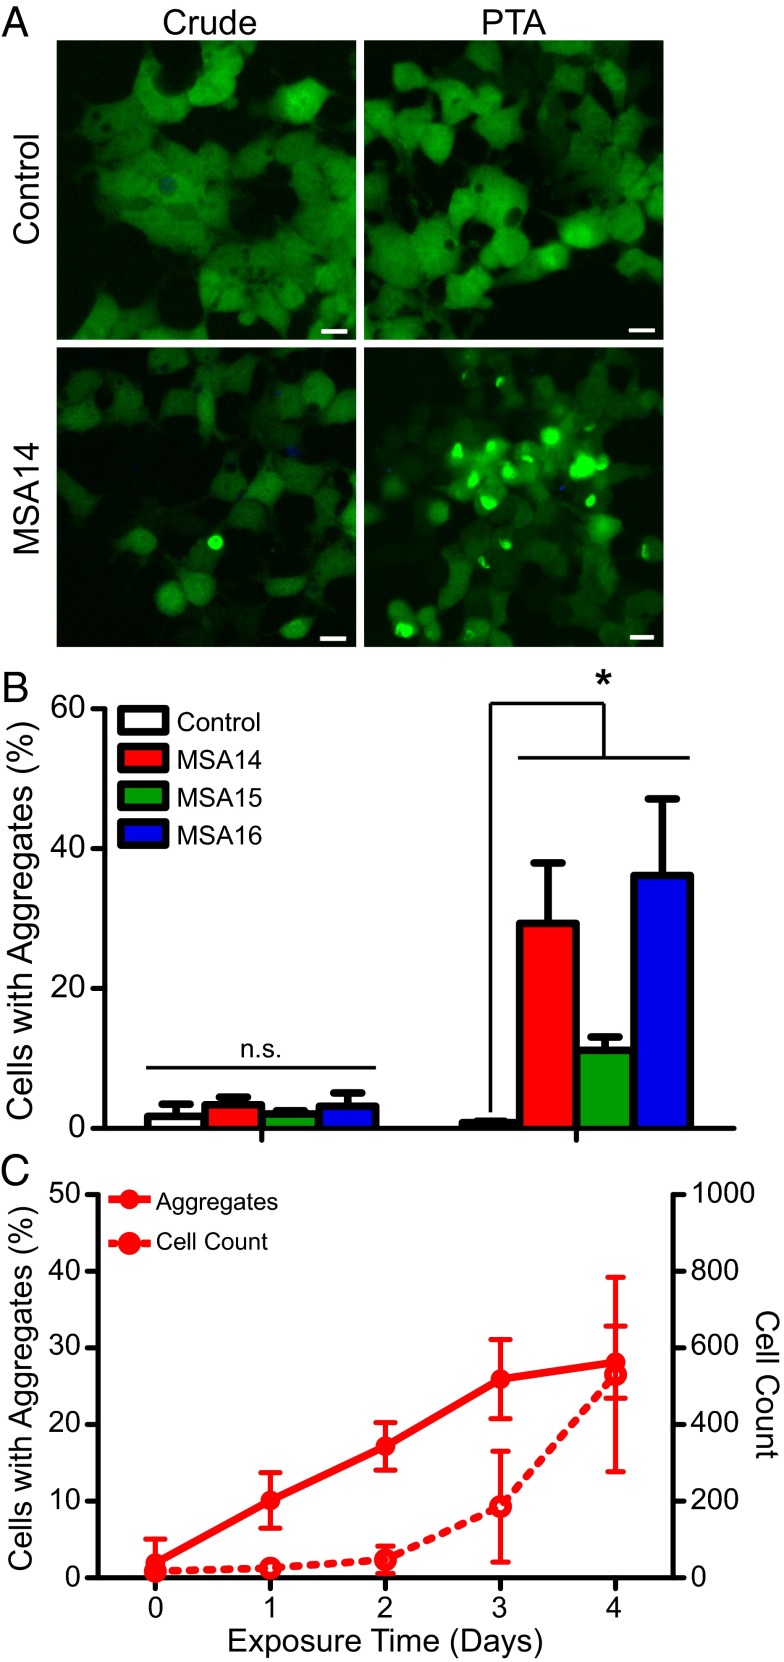
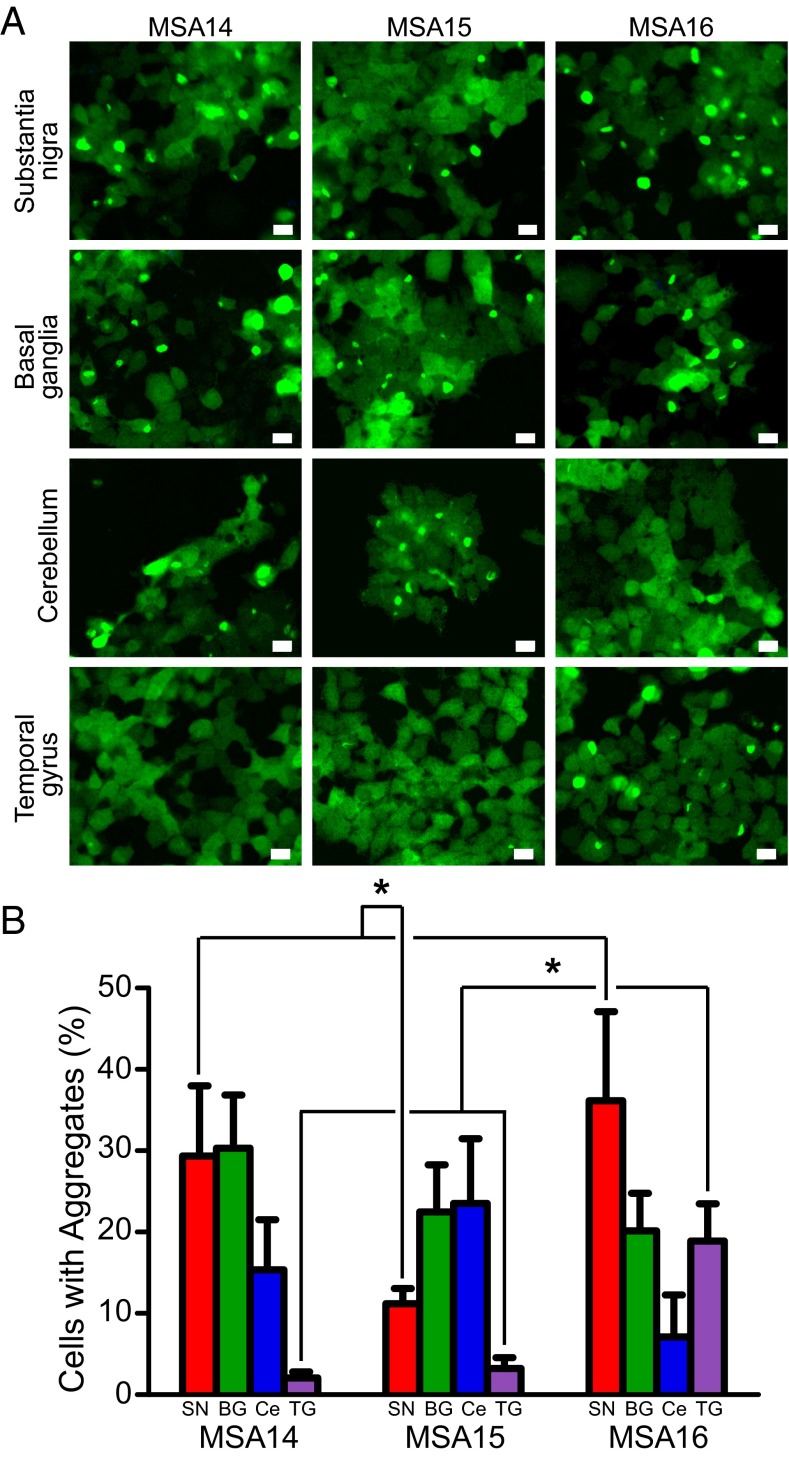
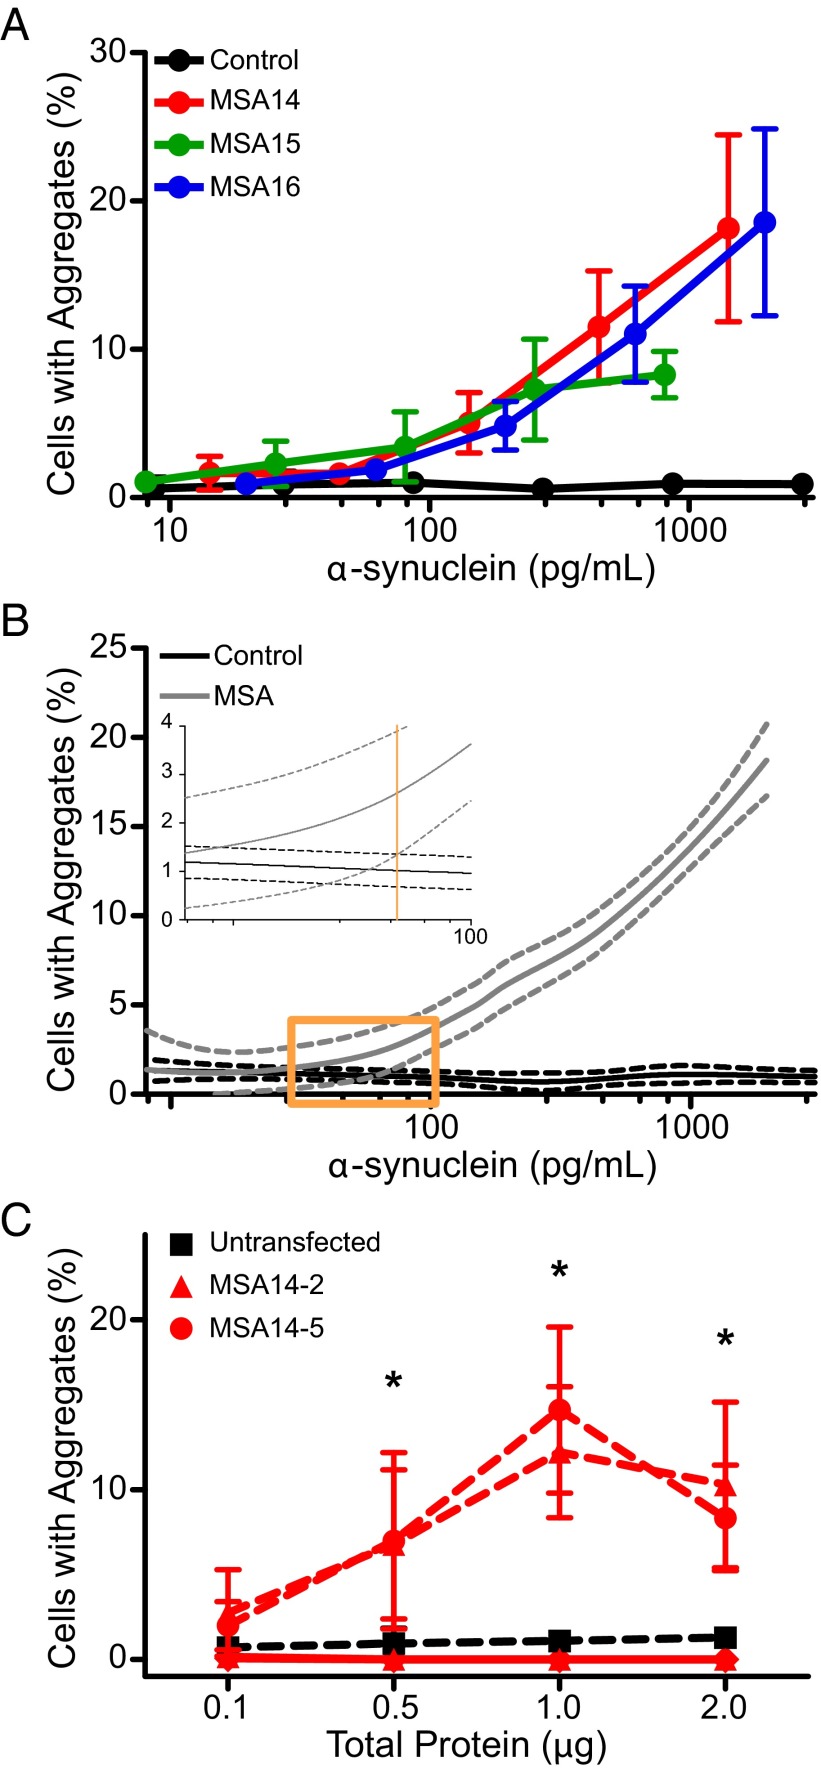
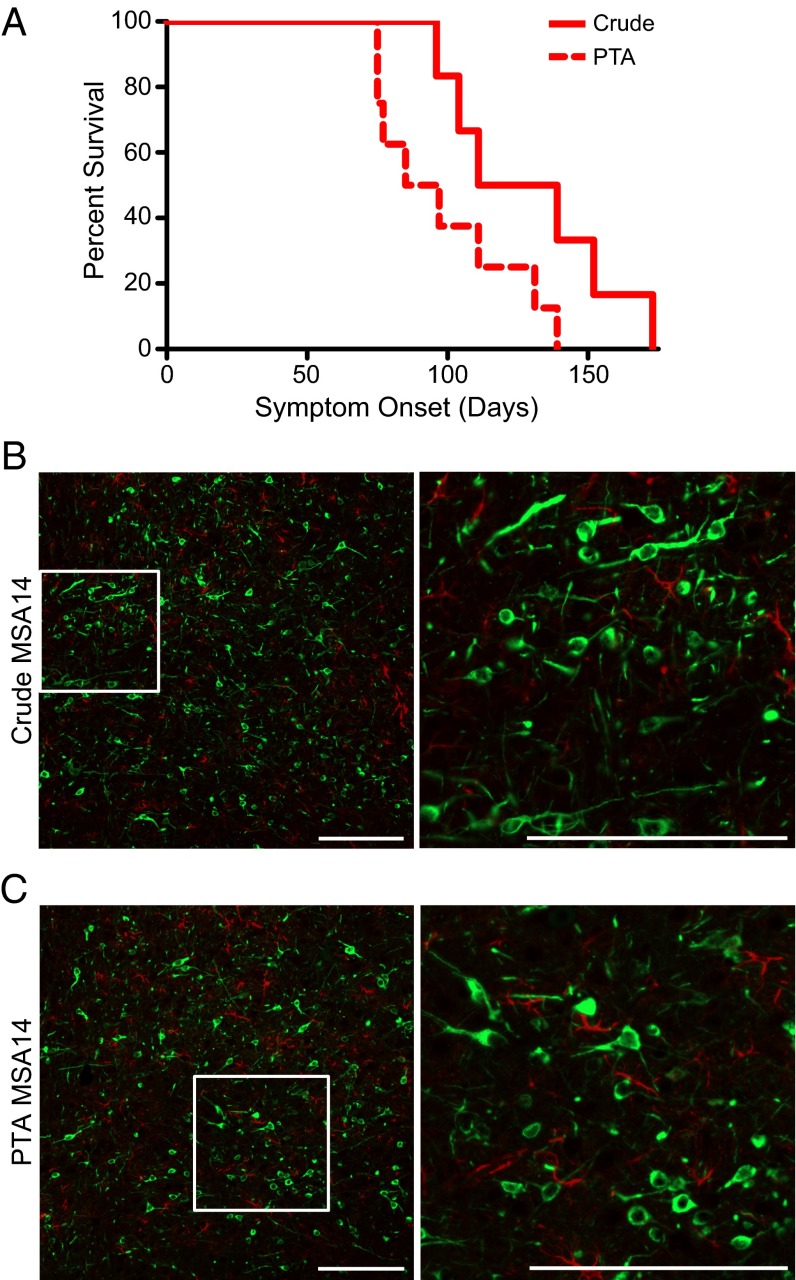
Increasingly, evidence argues that many neurodegenerative diseases, including progressive supranuclear palsy (PSP), are caused by prions, which are alternatively folded proteins undergoing self-propagation. In earlier studies, PSP prions were detected by infecting human embryonic kidney (HEK) cells expressing a tau fragment [TauRD(LM)] fused to yellow fluorescent protein (YFP). Here, we report on an improved bioassay using selective precipitation of tau prions from human PSP brain homogenates before infection of the HEK cells. Tau prions were measured by counting the number of cells with TauRD(LM)-YFP aggregates using confocal fluorescence microscopy. In parallel studies, we fused α-synuclein to YFP to bioassay α-synuclein prions in the brains of patients who died of multiple system atrophy (MSA). Previously, MSA prion detection required ∼120 d for transmission into transgenic mice, whereas our cultured cell assay needed only 4 d. Variation in MSA prion levels in four different brain regions from three patients provided evidence for three different MSA prion strains. Attempts to demonstrate α-synuclein prions in brain homogenates from Parkinson's disease patients were unsuccessful, identifying an important biological difference between the two synucleinopathies. Partial purification of tau and α-synuclein prions facilitated measuring the levels of these protein pathogens in human brains. Our studies should facilitate investigations of the pathogenesis of both tau and α-synuclein prion disorders as well as help decipher the basic biology of those prions that attack the CNS.

Keywords: Parkinson’s disease; multiple system atrophy; neurodegeneration; strains; α-synuclein.


Conflict of interest statement

The authors declare no conflict of interest.

Figures

Fig. S1.
Fig. S1.
Schematic of cell assay workflow. Human or mouse brains were homogenized, and prions were isolated using either immunoprecipitation or sodium PTA precipitation. The HEK293T cells expressing the YFP-containing fusion proteins were plated with Hoechst 33342 in a 384-well plate. The samples were then incubated with Lipofectamine 2000 for 1.5 h; OptiMEM was added immediately preceding plating. The plate was incubated for 4 d before imaging and quantifying the percentage of cells containing aggregates.
Fig. 1.
Fig. 1.
In vitro detection of tau prions. A rapid, cell-based assay for tau prions is enhanced by precipitating the prion aggregates from human patient samples. (A) Representative images of HEK293 cells expressing TauRD(LM)–YFP. Cells were exposed to 1 µg per well of crude brain homogenate (Left) from a control patient as well as a PSP patient. (Right) Cell infection with PSP following sodium PTA precipitation of prion aggregates; the control sample had no effect. Immunoprecipitation (IP) of tau aggregates using the Tau-12 antibody (Middle) was equally effective at isolating tau prions. YFP shown in green. (Scale bars, 100 μm.) (B) Quantification of cell infection using a control patient sample along with two PSP patient samples. Precipitating prions from the patient samples before incubating with the cells yielded a significant increase in infectivity. Data shown as mean ± SEM as determined from four images per well in four or six wells; *P < 0.0001. (C) Quantification of tau aggregate formation in TauRD(LM)–YFP cells every 24 h during incubation with PTA-precipitated prions from patient PSP1. Percentage of cells with aggregates and total cell count shown as mean ± SD. Values measured from the same region of six wells.
Fig. 2.
Fig. 2.
Response of cell lines to infection with synthetic α-synuclein prions. Two α-synuclein–YFP cell lines were developed and tested for responsiveness to synthetic α-synuclein prions. Quantification of the response of the two α-synuclein–YFP cell lines to increasing concentrations of synthetic α-syn140*A53T fibrils. Data shown as mean ± SEM as determined from four images per well in six wells; *P < 0.05.
Fig. S2.
Fig. S2.
Specificity of in vitro tau and α-synuclein cell lines. The tau and α-synuclein cell lines display homotypic seeding. (A) Representative electron micrographs with uranyl acetate negative staining showing synthetic tau K18 (Left) and α-syn140*A53T fibrils (Right). (Scale bars, 100 nm.) (B) Representative images of TauRD(LM)–YFP and α-syn140*A53T–YFP cells following incubation with either tau K18 fibrils (Left) or α-syn140*A53T fibrils (Right). YFP shown in green. (Scale bars, 50 μm.) (C) Summary table of cell line infectivity using three fibrillized synthetic prions and PBS.
Fig. 3.
Fig. 3.
In vitro detection of α-synuclein prions. A cell-based assay for α-synuclein can detect prions from MSA patient samples. (A) Representative images of HEK293T cells expressing α-syn140*A53T–YFP. Cells were exposed to 1 µg per well of crude brain homogenate (Left) from a control patient as well as an MSA patient. (Right) Cell infection with MSA following sodium PTA precipitation of prion aggregates; the control sample had no effect. YFP shown in green. (Scale bars, 100 μm.) (B) Quantification of cell infection using a control patient sample along with three MSA patient samples. Precipitating prions from the patient samples before incubating with the cells yielded a significant increase in infectivity. Data shown as mean ± SD as determined from one image per well from six wells; *P < 0.05. (C) Quantification of α-synuclein aggregate formation in α-syn140*A53T–YFP cells every 24 h during incubation with PTA-precipitated prions from patient MSA14. Percentage of cells with aggregates (solid line) and total cell count (dashed line) shown as mean ± SD. Values measured from the same region of six wells.
Fig. S3.
Fig. S3.
Synucleinopathy patient sample genotyping at amino acid 53 of α-synuclein. Fifteen synucleinopathy and one control patient sample were genotyped at amino acid 53 of α-synuclein using the restriction fragment length polymorphism approach. (A) PCR was used to amplify isolated DNA from the patient samples using the forward and reverse primers, indicated by the arrows. (B) The amplified PCR products from one control (C2), eight MSA, three DLB, three PDD, and three PD patient samples were compared with DNA derived from a patient carrying the A53T mutation (A53T) and a control patient with WT α-synuclein (WT), both expressed in mice. All PCR products of the SNCA gene (exon 4) ran at the predicted length of 216 bp. (C) Restriction digest of the PCR products with Tsp45 I, which cleaves DNA if the A53T mutation is present (shown in red in A), was performed. Only the A53T DNA showed the predicted double bands at 128 and 88 bp.
Fig. 4.
Fig. 4.
MSA prion distribution in the brain varies by patient. MSA patients display varied α-synuclein prion distribution throughout multiple brain regions. (A) Representative images of α-syn140*A53T–YFP cells infected with sodium PTA-precipitated brain homogenate from the substantia nigra, basal ganglia, cerebellum, and temporal gyrus of three MSA patients. YFP shown in green. (Scale bars, 50 μm.) (B) Quantification of cell infections from four brain regions (substantia nigra in red, basal ganglia in green, cerebellum in blue, and temporal gyrus in purple) isolated from three MSA patients shown as mean ± SD. Infectivity of each brain region was compared between all three patients. The substantia nigra from patients MSA14 and MSA16 were significantly more infective than substantia nigra from patient MSA15 (P < 0.0001), whereas the temporal gyrus from patient MSA16 was significantly more infective than the temporal gyrus from patients MSA14 and MSA15 (P < 0.0001). Values measured from one image taken from each of six wells. BG, basal ganglia; Ce, cerebellum; SN, substantia nigra; and TG, temporal gyrus. *P < 0.0001.
Fig. 5.
Fig. 5.
Characterization of MSA prions by serial dilution and passaging in vitro. The α-syn140*A53T–YFP cells were used to characterize MSA prions in vitro. (A) Infectivity curves were generated for four samples (three MSA patient samples and one control patient sample) by plotting the percentage of cells containing aggregates as a function of the total α-synuclein concentration following sodium PTA precipitation, which was determined using half-log dilutions. The curves for all three MSA samples were consistent and distinct from the control sample. Data shown as mean ± SD from one image collected from each of six wells. (B) Combining all of the data points for the MSA samples (gray), a nonparametric curve was fit to the data (solid line) and the 95% CI was determined (dashed lines). We determined that the MSA samples became significantly different from the control (black) when the two CIs no longer overlapped at 70 pg/mL (orange line, Inset). (C) Quantification of infectivity of two α-syn140*A53T–YFP clonal cell lines that stably expressed MSA-induced aggregates (MSA14-2, red triangles, and MSA14-5, red circles) compared with lysate from untransfected HEK293T cells (black squares). Both lysates were tested in the α-syn140*A53T–YFP cell line (dashed red lines) and a nontransgenic HEK293T cell line (solid red lines). Data shown as mean ± SD from one image collected from each of six wells; *P < 0.05.
Fig. 6.
Fig. 6.
Sodium PTA precipitates prion aggregates from human patient samples. PTA-precipitated MSA14 brain homogenate induced neurological disease in TgM83+/− following intrathalamic inoculation. (A) Kaplan–Meier plot showing the onset of symptoms in two groups of TgM83+/− mice. Mice inoculated with 1% (wt/vol) crude brain homogenate from patient MSA14 (solid red line) developed symptoms with an onset of 130 ± 12 dpi (mean ± SEM). Mice inoculated with PTA-precipitated brain homogenate from MSA14 (dotted red line) developed symptoms in 99 ± 9 dpi. (B and C) Neuropathology from the reticular formation of TgM83+/− mice inoculated with crude brain homogenate (B) or PTA-precipitated brain homogenate (C) from patient MSA14 both contain phosphorylated α-synuclein aggregates (EP1536Y, shown in green). Glial fibrillary acidic protein (GFAP) in red. (Scale bars, 200 μm.)

References

    1. Parkinson J. An Essay on the Shaking Palsy. Sherwood, Neely, and Jones; London: 1817.
    1. Forster E, Lewy FH. Paralysis agitans. In: Lewandowsky M, editor. Pathologische Anatomie. Handbuch der Neurologie. Springer; Berlin: 1912. pp. 920–933.
    1. Polymeropoulos MH, et al. Mutation in the α-synuclein gene identified in families with Parkinson’s disease. Science. 1997;276(5321):2045–2047. - PubMed
    1. Singleton AB, et al. α-Synuclein locus triplication causes Parkinson’s disease. Science. 2003;302(5646):841. - PubMed
    1. Chartier-Harlin MC, et al. Alpha-synuclein locus duplication as a cause of familial Parkinson’s disease. Lancet. 2004;364(9440):1167–1169. - PubMed

Publication types