. 2015 Sep 1;112(35):11090-5.
doi: 10.1073/pnas.1508259112. Epub 2015 Aug 18.

NH4(+) triggers the release of astrocytic lactate via mitochondrial pyruvate shunting

Affiliations

NH4(+) triggers the release of astrocytic lactate via mitochondrial pyruvate shunting

Rodrigo Lerchundi et al. Proc Natl Acad Sci U S A. .

Abstract

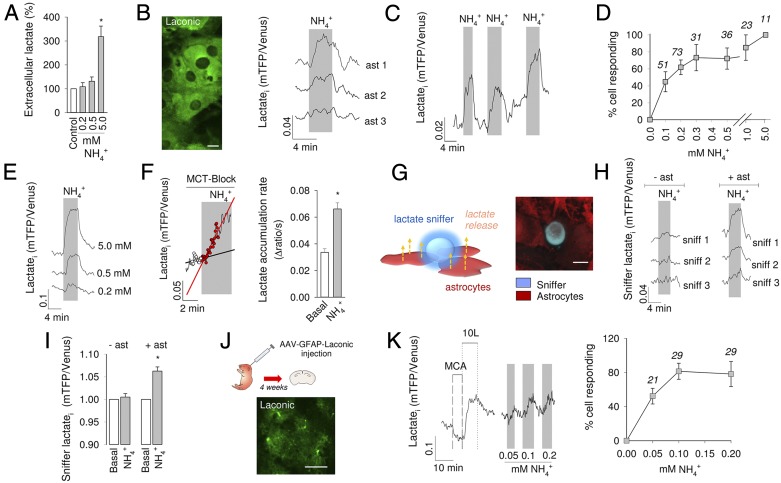
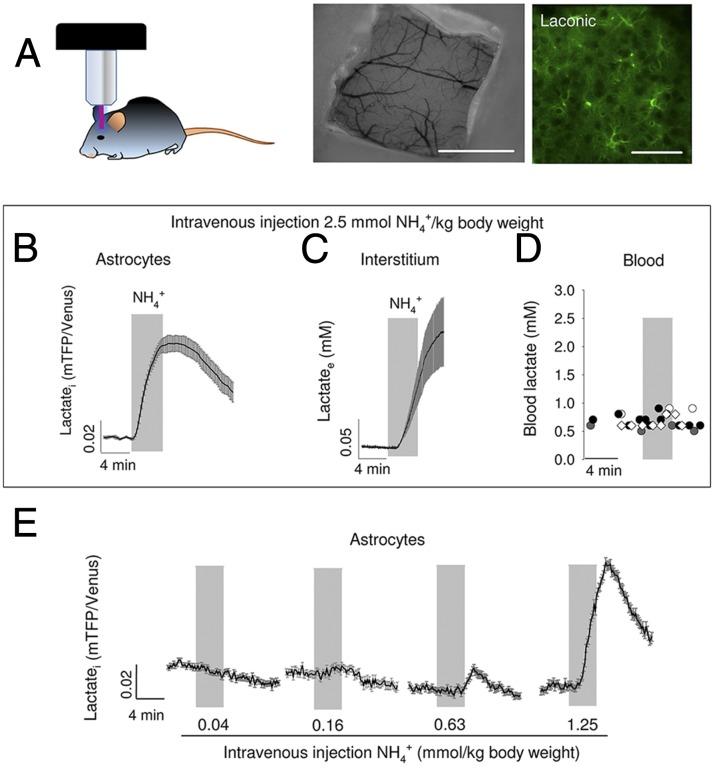
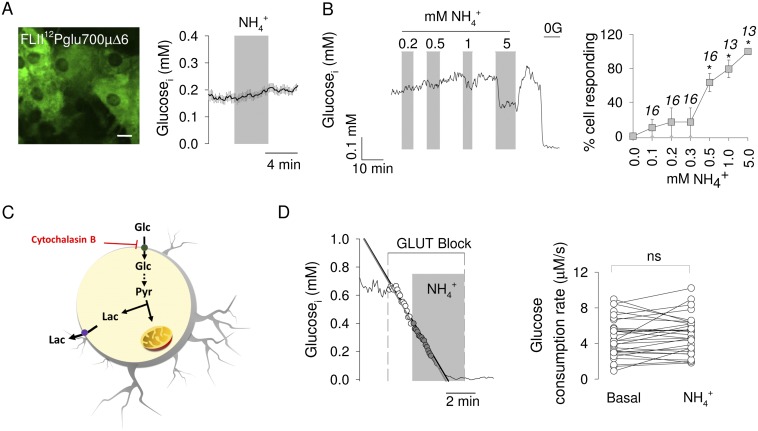
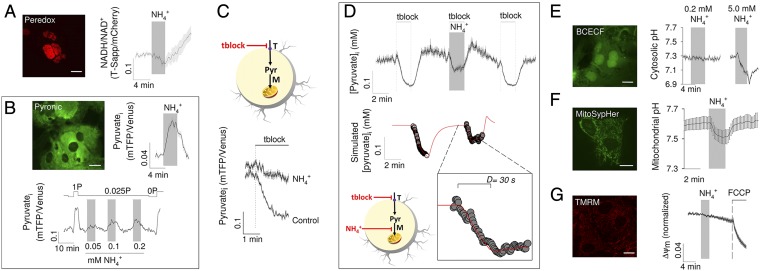
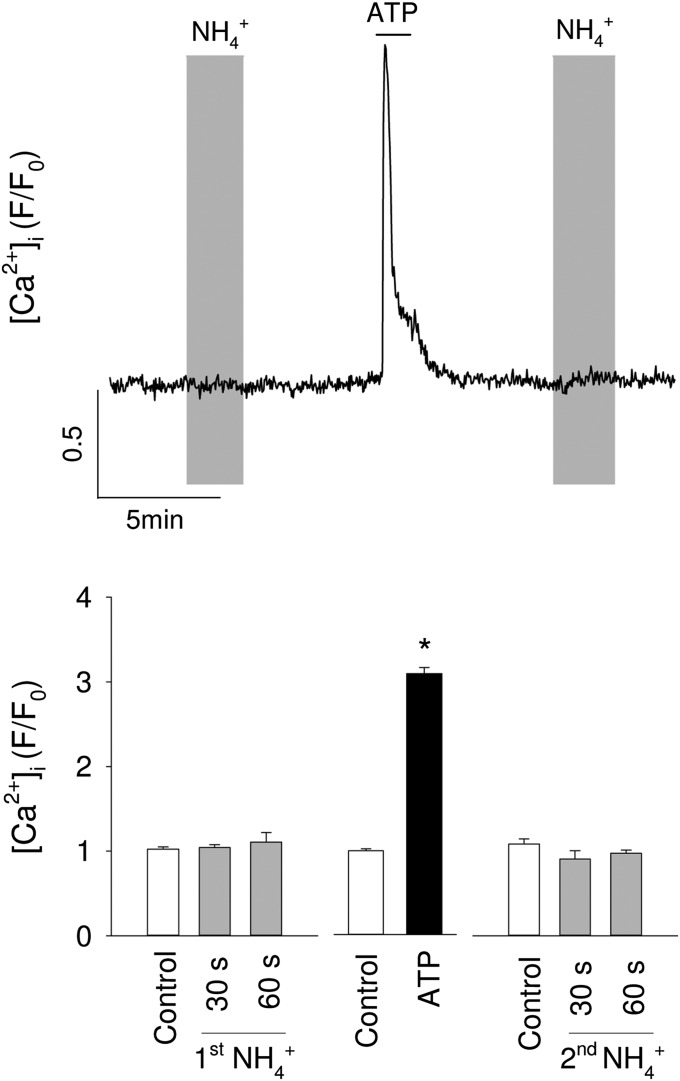
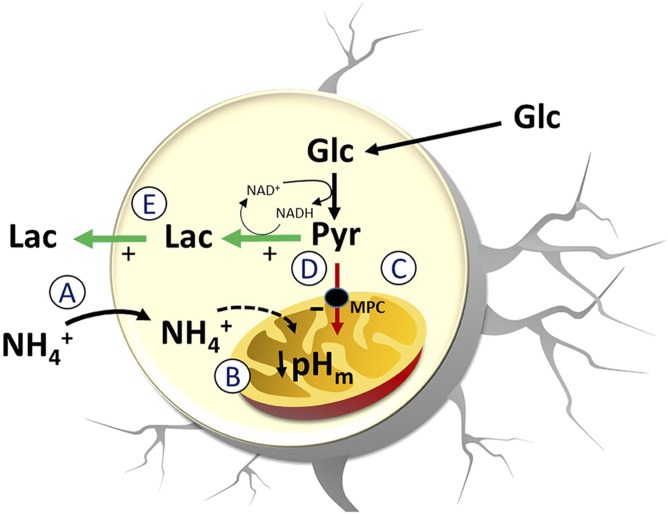
Neural activity is accompanied by a transient mismatch between local glucose and oxygen metabolism, a phenomenon of physiological and pathophysiological importance termed aerobic glycolysis. Previous studies have proposed glutamate and K(+) as the neuronal signals that trigger aerobic glycolysis in astrocytes. Here we used a panel of genetically encoded FRET sensors in vitro and in vivo to investigate the participation of NH4(+), a by-product of catabolism that is also released by active neurons. Astrocytes in mixed cortical cultures responded to physiological levels of NH4(+) with an acute rise in cytosolic lactate followed by lactate release into the extracellular space, as detected by a lactate-sniffer. An acute increase in astrocytic lactate was also observed in acute hippocampal slices exposed to NH4(+) and in the somatosensory cortex of anesthetized mice in response to i.v. NH4(+). Unexpectedly, NH4(+) had no effect on astrocytic glucose consumption. Parallel measurements showed simultaneous cytosolic pyruvate accumulation and NADH depletion, suggesting the involvement of mitochondria. An inhibitor-stop technique confirmed a strong inhibition of mitochondrial pyruvate uptake that can be explained by mitochondrial matrix acidification. These results show that physiological NH4(+) diverts the flux of pyruvate from mitochondria to lactate production and release. Considering that NH4(+) is produced stoichiometrically with glutamate during excitatory neurotransmission, we propose that NH4(+) behaves as an intercellular signal and that pyruvate shunting contributes to aerobic lactate production by astrocytes.

Keywords: FLII12Pglu700μΔ6; laconic; mitoSypHer; peredox; pyronic.


Conflict of interest statement

The authors declare no conflict of interest.

Figures

Fig. 1.
Fig. 1.
NH4+ stimulates the production and release of lactate by astrocytes in vitro. (A) Extracellular lactate measurement with an enzymatic kit in pure astrocytic cultures. Cells were exposed for 1 min to 0.2, 0.5, or 5 mM NH4+. (B) (Left) Laconic expressed in the cytosol of astrocytes in culture. (Scale bar, 10 μm.) (Right) Effect of NH4+ on intracellular lactate is shown for 3 representative cells as the change of the mTFP/Venus ratio. (C) An astrocyte was exposed three times to 0.2 mM NH4+. (D) Dose dependence of the effect expressed as percentage of cells responding to NH4+ with an increase in lactate. Responding cells were distinguished from nonresponding cells by computing the average of five data points collected just before NH4+ exposure and the average of five data points at 3 min of exposure. The difference between the two values was considered significant if P < 0.05 (Mann-Whitney u test). The number of monitored cells is given. (E) Response of a single astrocyte to subsequent exposures to 0.2, 0.5, and 5 mM NH4+. (F) Astrocytes in glucose alone as energy substrate were first exposed to the MCT inhibitor AR-C155858 (1 μM) and 2 min later to 0.2 mM NH4+. Lines represent the rate of lactate accumulation before and during exposure to NH4+. Bars show averages. (G) (Left) Schematic representation of lactate sniffers above astrocytes. (Right) 3D confocal microscopy reconstruction of HEK 293 lactate sniffers (blue) and astrocytes loaded with Calcein orange (red). (H) Representative responses of sniffer cells exposed to 0.2 mM NH4+ in the absence and presence of astrocytes. (I) Bars show average changes in sniffer signal. (J) Protoplasmic astrocytes expressing Laconic in an acute hippocampal slice prepared 4 wk after AAV injection at P1. (Scale bar, 50 μm.) (K) (Left) Two-point calibration of Laconic with 50 mM monochloroacetate (MCA) and 10 mM lactate (10L), and response of a protoplasmic astrocyte to slice exposure to 0.05, 0.1, and 0.2 mM NH4+. (Right) Dose dependence of the effect expressed as percentage of cells responding to 0.2 mM NH4+ with an increase in lactate. Responding cells were identified as detailed in D. The number of monitored cells is given. *P < 0.05.
Fig. 2.
Fig. 2.
NH4+ increases astrocytic lactate in vivo. (A) Schematic representation of an in vivo experiment. (Left) Anesthetized mouse previously injected with AAV9-GFAP-Laconic is positioned in the two-photon microscope setup for measurement of astrocytic lactate. (Center) Cranial window exposing the somatosensory cortex. (Scale bar, 1 mm.) (Right) Protoplasmic astrocytes expressing Laconic in the somatosensory cortex, layer II/III. (Scale bar, 50 μm.) A bolus of NH4+ (2.5 mmol/kg body weight) was injected i.v. while monitoring astrocytic lactate with Laconic (B), extracellular lactate with an inserted biosensor (C), or blood lactate with an enzymatic assay (D). Symbols in D represent data from four separate experiments. (E) Response of astrocytic lactate to sequential i.v. injections of increasing doses of NH4+.
Fig. S1.
Fig. S1.
Physiological NH4+ does not stimulate glucose consumption by astrocytes. (A) Cultured astrocytes expressing the glucose nanosensor FLII12Pglu700µ∆6. (Scale bar, 10 μm.) The graph shows the effect of 0.2 mM NH4+ on cytosolic glucose. (B) (Left) Response of a single astrocyte to subsequent exposures to 0.2, 0.5, 1, and 5 mM NH4+. Glucose was removed (0G) at the end of the experiment for calibration purposes. (Right) Average effects expressed as percentage of cells responding to NH4+ with a decrease in cytosolic glucose. (C) Schematic representation of the method that estimates glucose consumption by inhibiting the glucose transporter GLUT1 with cytochalasin B. (D) (Left) Measurement of glucose consumption in a single astrocyte with 20 μM cytochalasin B before and during exposure to 0.2 mM NH4+. (Right) Glucose consumption rates estimated in several similar experiments. *P < 0.05.
Fig. 3.
Fig. 3.
Mitochondrial inhibition induced by NH4+. (A) Cultured astrocytes expressing the NADH/NAD+ nanosensor Peredox in the nucleus. (Scale bar, 10 μm.) The graph shows the effect of 0.2 mM NH4+ on the NADH/NAD+ ratio. (B) Cultured astrocytes expressing the pyruvate nanosensor Pyronic. (Scale bar, 10 μm.) The graph in the middle shows the effect of 0.2 mM NH4+ on astrocytic pyruvate. (Right) Response of a single astrocyte to subsequent exposures to 0.05, 0.1, and 0.2 mM NH4+. Pyruvate in the superfusate (P) was set at 0.025 mM during the stimulations or 0 and 1 mM for calibration purposes. (C) (Upper) Schematic representation of the method that estimates mitochondrial pyruvate consumption by inhibiting surface pyruvate transport (T) with 100 nM AR-C155858 and 1 mM probenecid (tblock). (Lower) Mitochondrial pyruvate consumption in cells that had been exposed for 3 min to 0.2 mM NH4+ and their controls. (D) (Upper) Surface pyruvate transport was blocked in the absence and presence of 0.2 mM NH4+. (Lower) Numerical model represented in the schematic was fitted (red line) to the pyruvate data (symbols) as described in the SI Text. (Inset) Delay in the onset of the NH4+ effect. (E) Effects of 0.2 and 5.0 mM NH4+ on astrocytic pH, estimated with BCECF. (F) Effect of 0.2 NH4+ on mitochondrial pH, estimated with mitoSypHer. (G) Effects of 0.2 NH4+ and 1 μM FCCP on mitochondrial membrane potential estimated with TMRM. (Scale bars, 10 µm.)
Fig. S2.
Fig. S2.
No apparent effect of NH4+ on cytosolic [Ca2+] in astrocytes. Mixed brain cell cultures loaded with Fluo4 were sequentially exposed to 0.2 mM NH4+, to 50 μM ATP, and again to 0.2 mM NH4+. (Upper) Normalized data from a single astrocyte. (Lower) Data from 33 astrocytes in three separate experiments, showing average values of five data points recorded just before addition (control), after 30 and 60 s of NH4+ exposure and at the peak of the ATP response. *P < 0.05.
Fig. 4.
Fig. 4.
Astrocytic lactate release in response to NH4+. The release of lactate by astrocytes exposed to NH4+ is explained by the following sequence of events. (A) NH4+ uptake by astrocytes through K+ channels and transporters. (B) NH4+ entry into mitochondria leading to acidification of the mitochondrial matrix. (C) Inhibition of the H+-coupled MPC. (D) Accumulation of pyruvate in the cytosol causing lactate accumulation and NADH depletion. (E) Increased lactate release.

References

    1. Fox PT, Raichle ME, Mintun MA, Dence C. Nonoxidative glucose consumption during focal physiologic neural activity. Science. 1988;241(4864):462–464. - PubMed
    1. Raichle ME, Mintun MA. Brain work and brain imaging. Annu Rev Neurosci. 2006;29:449–476. - PubMed
    1. Mintun MA, Vlassenko AG, Rundle MM, Raichle ME. Increased lactate/pyruvate ratio augments blood flow in physiologically activated human brain. Proc Natl Acad Sci USA. 2004;101(2):659–664. - PMC - PubMed
    1. Wyss MT, Jolivet R, Buck A, Magistretti PJ, Weber B. In vivo evidence for lactate as a neuronal energy source. J Neurosci. 2011;31(20):7477–7485. - PMC - PubMed
    1. Suzuki A, et al. Astrocyte-neuron lactate transport is required for long-term memory formation. Cell. 2011;144(5):810–823. - PMC - PubMed

Publication types

LinkOut - more resources