. 2015 Sep 1;112(35):11024-9.
doi: 10.1073/pnas.1503315112. Epub 2015 Aug 18.

IL-22 regulates lymphoid chemokine production and assembly of tertiary lymphoid organs

Affiliations

IL-22 regulates lymphoid chemokine production and assembly of tertiary lymphoid organs

Francesca Barone et al. Proc Natl Acad Sci U S A. .

Abstract

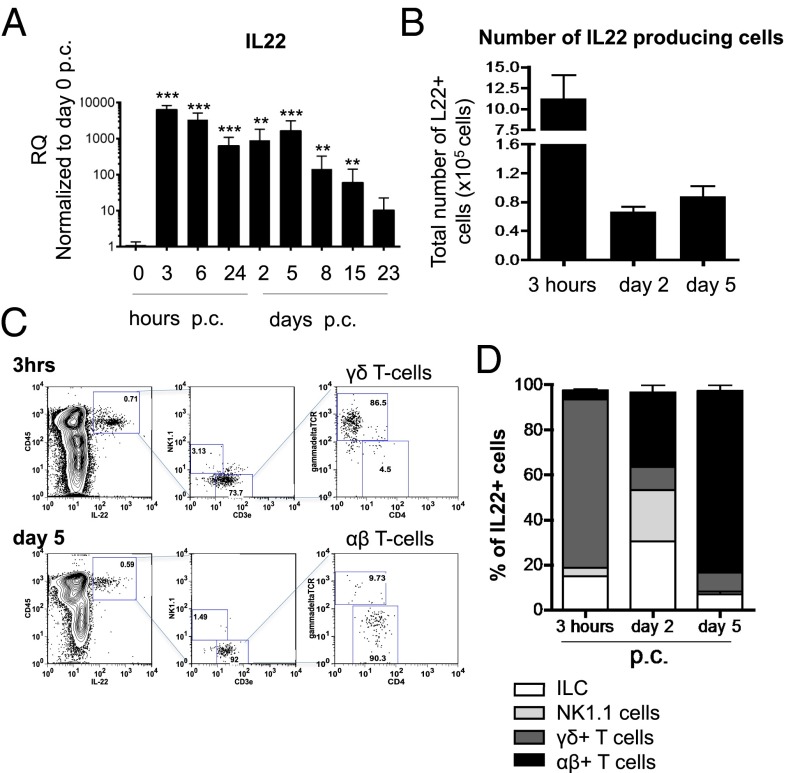
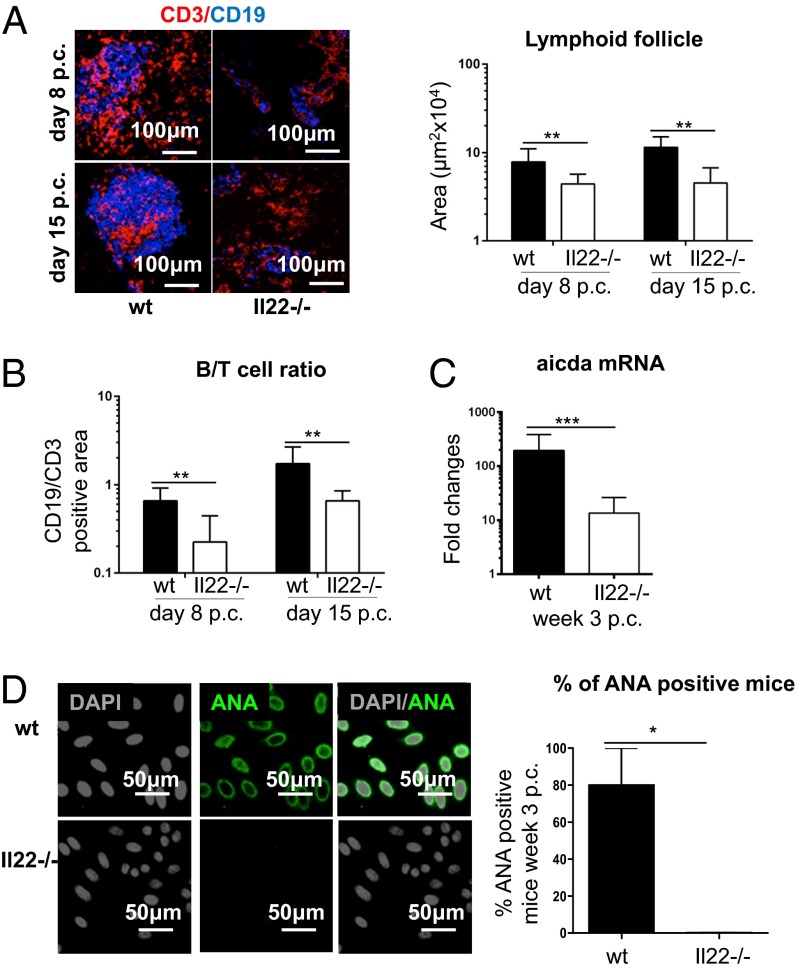
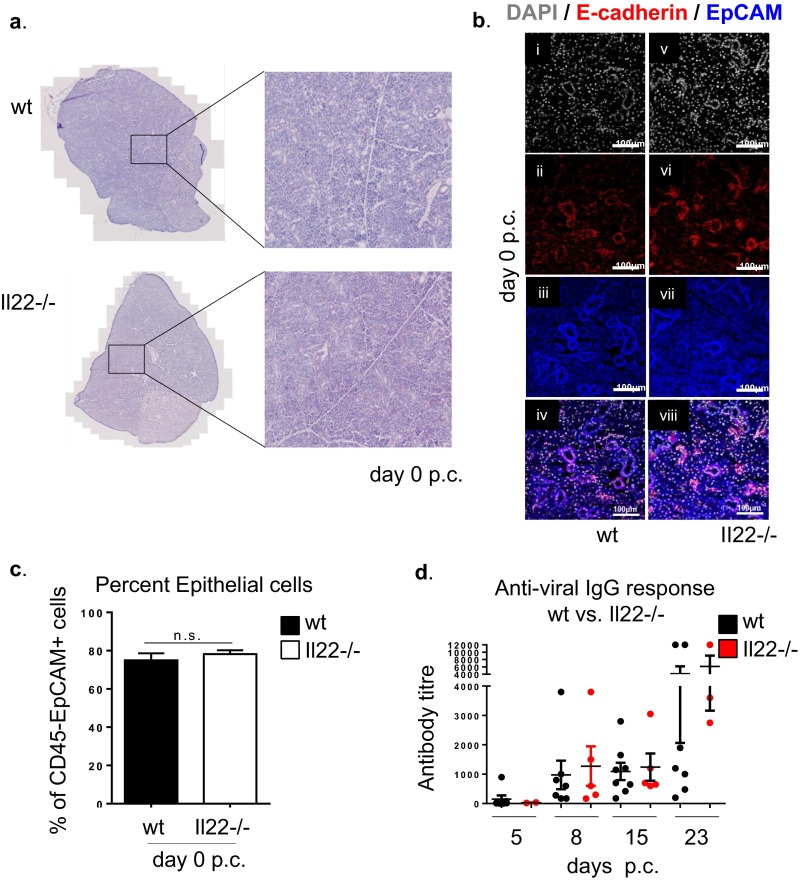
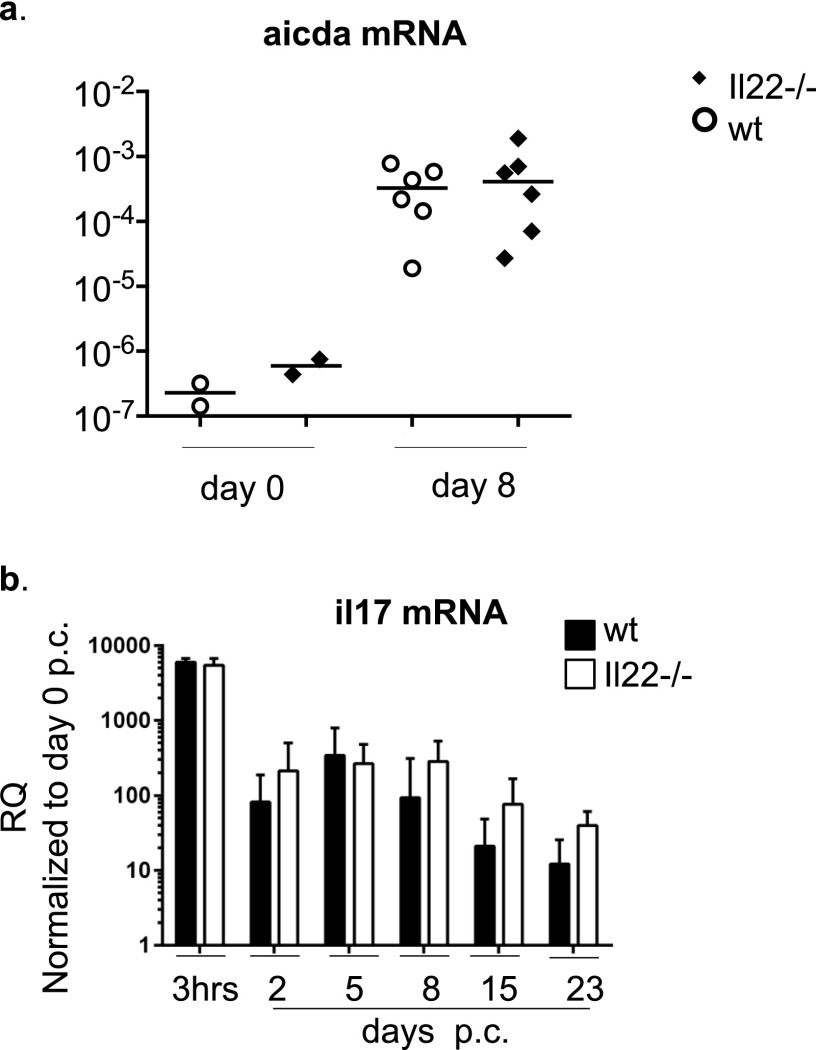
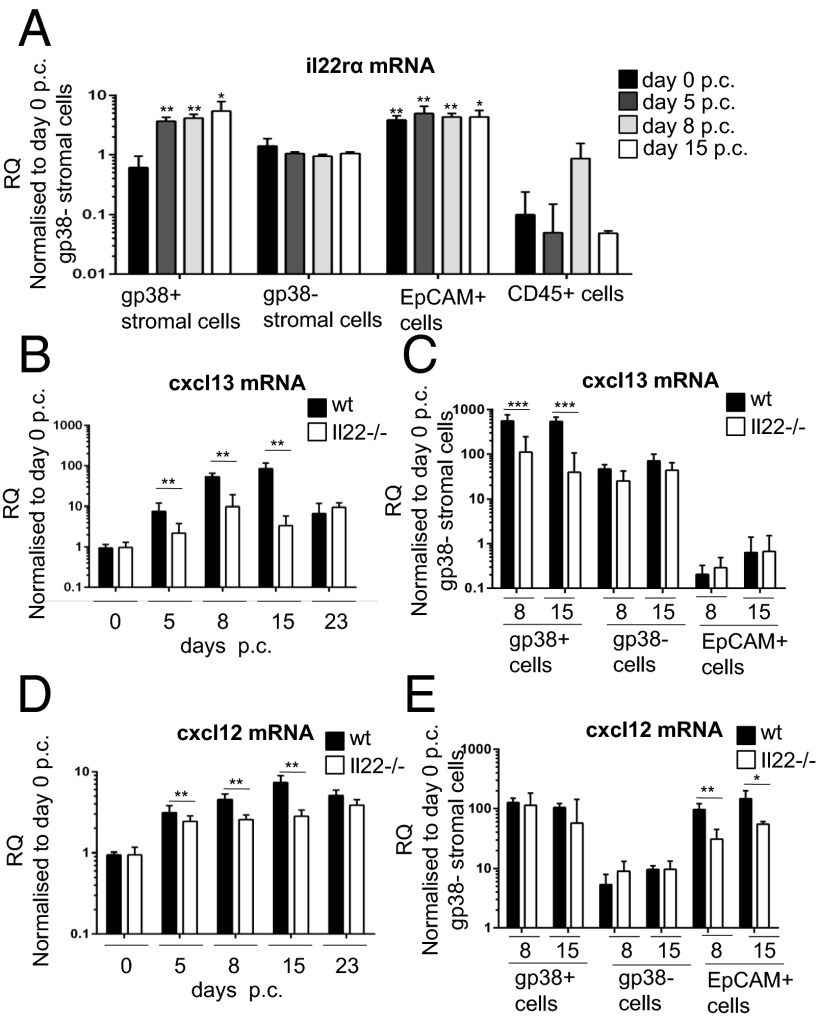
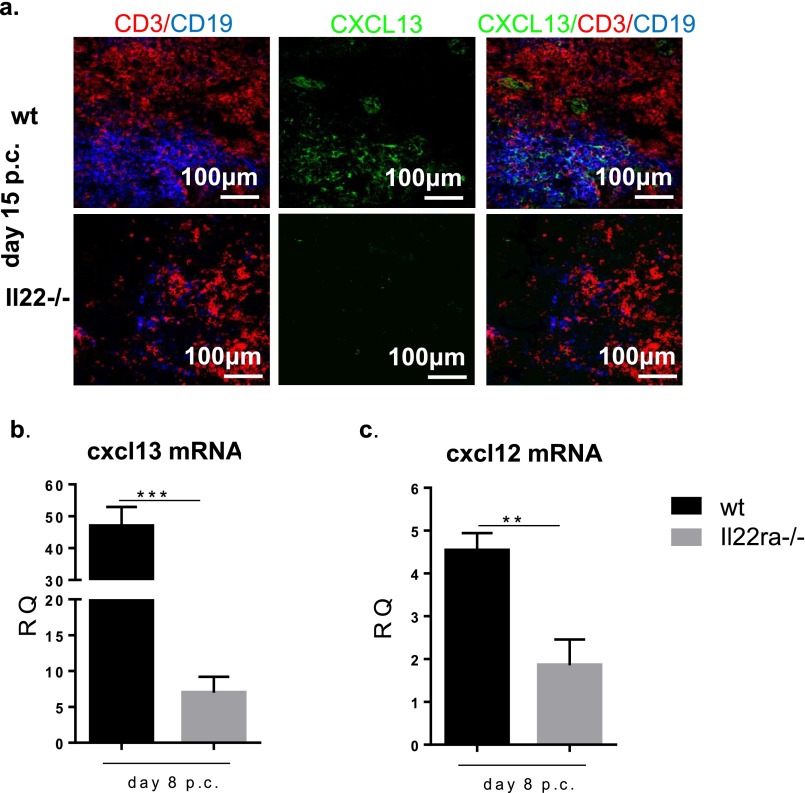
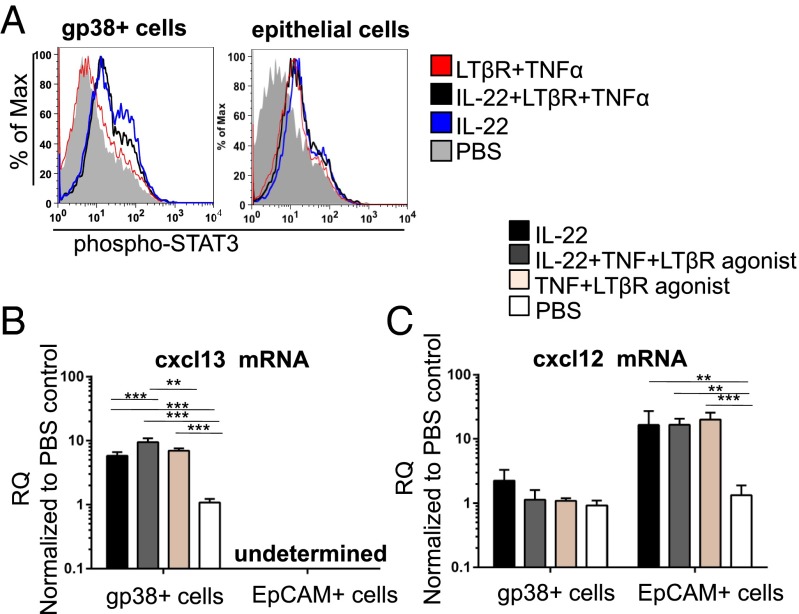
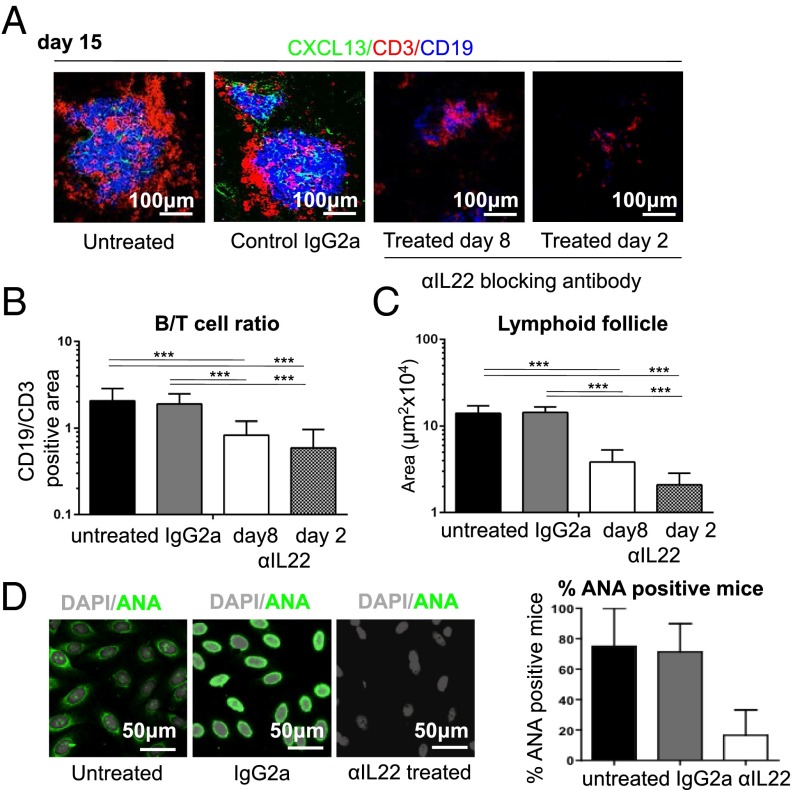
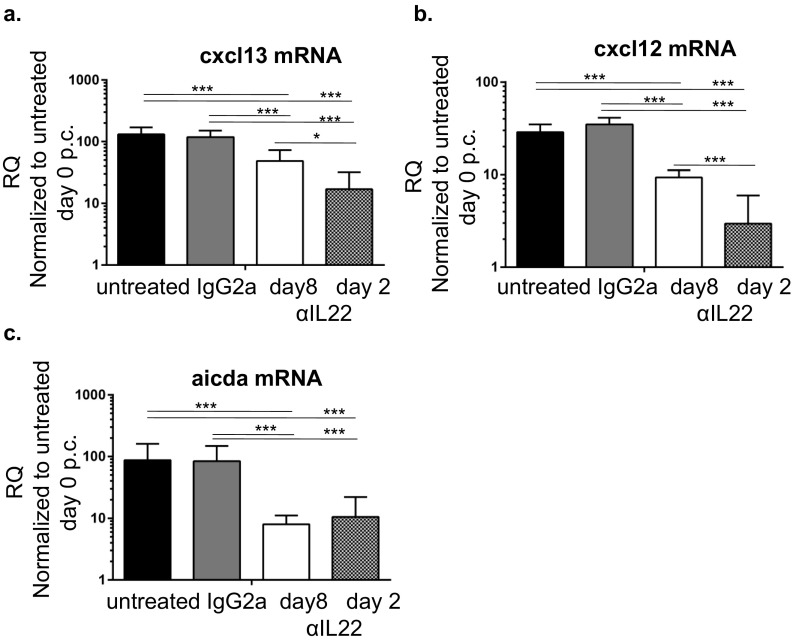
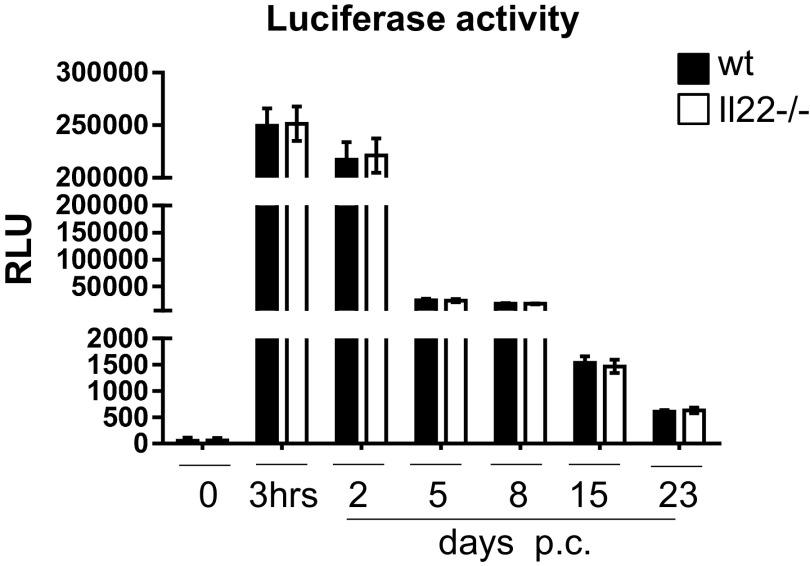
The series of events leading to tertiary lymphoid organ (TLO) formation in mucosal organs following tissue damage remain unclear. Using a virus-induced model of autoantibody formation in the salivary glands of adult mice, we demonstrate that IL-22 provides a mechanistic link between mucosal infection, B-cell recruitment, and humoral autoimmunity. IL-22 receptor engagement is necessary and sufficient to promote differential expression of chemokine (C-X-C motif) ligand 12 and chemokine (C-X-C motif) ligand 13 in epithelial and fibroblastic stromal cells that, in turn, is pivotal for B-cell recruitment and organization of the TLOs. Accordingly, genetic and therapeutic blockade of IL-22 impairs and reverses TLO formation and autoantibody production. Our work highlights a critical role for IL-22 in TLO-induced pathology and provides a rationale for the use of IL-22-blocking agents in B-cell-mediated autoimmune conditions.

Keywords: IL-22; Sjogren's syndrome; autoimmunity; chemokines; tertiary lymphoid organs.


Conflict of interest statement

The authors declare no conflict of interest.

Figures

Fig. 1.
Fig. 1.
Source of IL-22 in TLO formation. (A) Quantitative RT-PCR analysis of mRNA transcript for Il22 in WT mice on day 0, at 3, 6, and 24 h p.c., and on days 2, 5, 8, 15, and 23 p.c., normalized to β-actin. Relative expression (RQ) was calibrated to 0 p.c. salivary glands. **P < 0.01; ***P < 0.001 versus day 0. Results represent two or three experiments with four glands analyzed per group. (B) Absolute number of IL-22+ cells in the CD45+ population from salivary glands at 3 h p.c. and on days 2 and 5 p.c. (C) Representative dot plots identifying IL-22–producing cells in γδ+ T cells (CD3e+gdTCR+NK1.1CD4) at 3 h p.c. and in αβ+ T cells (CD3e+gdTCRNK1.1CD4+) on day 5 p.c. Data present the mean ± SD of two different experiments with three salivary glands per experiment. (D) Distribution of IL-22+ cells in the CD45+ population at 3 h p.c. and on days 2 and 5 p.c. Data present the mean ± SD from two different experiments with three salivary glands per experiment.
Fig. S1.
Fig. S1.
Graph summarizing the MFI of IL-22 in the CD45+ leukocyte population at 3 h p.c. and days 2 and 5 p.c. Data present the mean ± SD of two different experiments with three salivary glands per experiment. *P < 0.05; GEE analysis followed by Sidak’s significance test.
Fig. 2.
Fig. 2.
Lack of IL-22 results in defective TLO formation and decreased autoantibody production. (A, Left) Salivary gland staining for CD3 (red) and CD19 (blue) in WT and Il22−/− mice at days 8 and 15 p.c. (Right) Lymphoid aggregate area calculated at days 8 and 15 p.c. for WT (black bars) and Il22−/− (white bars) mice. Data present the mean ± SD from two different experiments with two or three mice (four or six salivary glands) per group; **P < 0.01. (B) Ratio between the CD19+ and CD3+ area at days 8 and 15 p.c. in WT (black bars) and Il22−/− (white bars) mice. Data present the mean ± SD from two different experiments (four or six salivary glands); **P < 0.01. (C) mRNA transcripts of the aicda gene (normalized to β-actin), in week 3 p.c. salivary glands from WT and Il22−/− mice. RQ values are relative to day 0 p.c. aicda mRNA; data represent the mean ± SD of three independent experiments with four to six salivary glands analyzed in each experiment. ***P < 0.001. (D, Left) Autoantibody detection on Hep2 cells from WT and Il22−/− mice at week 3 p.c. (nuclear staining in gray, autoantibody reactivity in green) (serum dilution 1:80). ANA, antinuclear antibody. (Right) Detection of autoantibody reactivity (percentage of mice positive for autoantibody at 1:80 dilution or more) in WT and Il22−/− mice at day 23 p.c. Data present the mean ± SD of two experiments with five cannulated mice; *P < 0.05; unpaired t test.
Fig. S2.
Fig. S2.
(A) Representative microphotographs of H&E staining of salivary gland sections from WT and Il22−/− mice at day 0 p.c. (B) Salivary gland sections of WT (iiv) and Il22−/− (vviii) mice at day 0 p.c. were examined by immunofluorescence for E-cadherin (red), EpCAM (blue), and DAPI (gray). (Original magnification: 25×). (C) Graphs showing the percentage of CD45EpCAM+ epithelial cells contained within the enzyme-digested salivary glands from WT (black bars) and Il22−/− (white bars) mice at day 0 p.c. (D) Expression of antiviral response quantified by ELISA on sera from WT (black circles) and Il22−/− (red circles) mice calculated at days 5, 8, 15, and 23 p.c.
Fig. S3.
Fig. S3.
(A) Quantitative PCR analysis for aicda mRNA obtained from the spleens of nonimmunized (day 0) and immunized (day 8) Il22−/− (black symbols) and WT (white symbols) mice. Results are presented as ΔΔCT value. (B) Quantitative RT-PCR analysis of mRNA transcript of Il-17α in salivary glands of WT (black bars) and Il22−/− (white bars) mice at 3 h p.c. and days 2, 5, 8, 15, and 23 p.c. Transcripts were normalized to β-actin. The relative expression values were calibrated to salivary gland values on day 0 p.c. Data present the mean and ± SD of two experiments with four or six mice analyzed per group. GEE analysis was followed by Sidak’s significance test.
Fig. 3.
Fig. 3.
IL-22–deficient mice fail to induce CXCL13 and CXCL12 expression within stromal cells of TLOs. (A) Expression of Il22rα mRNA in FACS-sorted CD45EpCAMCD31gp38+ cells (black bars) in comparison with CD45EpCAMCD31gp38 cells (white bars), CD45EpCAM+ epithelial cells (dark gray bars), and CD45+ cells (light gray bars). Il22rα mRNA transcripts were assessed by quantitative RT-PCR and normalized to β-actin. RQ was calculated with day 0 CD45EpCAMCD31gp38 cells as calibrator. Results represent the mean ± SD of two independent experiments with four biological replicates. *P < 0.05; **P < 0.01. (B and D) Quantitative PCR analysis of cxcl13 and cxcl12 mRNA transcripts obtained from salivary glands at days 5, 8, 15, and 23 p.c. from Il22−/− (white bars) and WT (black bars) mice. Transcripts were normalized to pdgfrß mRNA; RQ values were calculated with day 0 salivary gland used as calibrator. **P < 0.01. Data present the mean ± SD of two independent experiments with two or three mice per group (four or six salivary glands per experiment). (C and E) mRNA expression of cxcl13 and cxcl12 mRNA on FACS-sorted CD45EpCAMCD31gp38+, CD45EpCAMCD31gp38, and EpCAM+ epithelial cells from WT (black bars) and Il22−/− (white bars) mice at days 8 and 15 p.c. (normalized to β-actin), calculated with day 0 CD45EpCAMCD31gp38 cells used as calibrator. Data present the mean ± SD of three biological replicates. *P < 0.05, **P < 0.01; ***P < 0.001.
Fig. S4.
Fig. S4.
(A) Microphotograph showing lack of CXCL13 protein expression (green) in cannulated salivary glands from Il22−/− mice but not WT mice at day 15 p.c. T cells (CD3 red) and B cells (CD19 green) are shown also. (B and C) Expression of cxcl13 (B) and cxcl12 (C) in Il22rα−/− mice (gray bars) and their WT counterparts (black bars) at day 8 p.c.; cxcl13 mRNA transcripts were normalized to pdgfrß mRNA, and results are presented as RQ values calculated with the day 0 salivary gland as calibrator. Data present the mean ± SD of two independent experiments with two or three mice per group. GEE analysis was followed by Sidak’s significance test; **P < 0.01; ***P < 0.001.
Fig. 4.
Fig. 4.
IL-22 induces differential chemokine expression in fibroblasts and epithelial cells. (A) STAT3 phosphorylation assessed by flow cytometry in CD45EpCAMCD31gp38+ stroma and EpCAM+ epithelial cells isolated from salivary glands at day 2 p.c. and stimulated in vitro with IL-22 (blue lines), IL-22, TNF-α and LTβR agonist (black lines), TNF-α and LTβR agonist (red lines), or PBS (gray lines). Two independent experiments were performed with three replicates per experiment. (B and C) Quantitative PCR analysis of cxcl13 and cxcl12 mRNA from CD45EpCAMCD31gp38+ stromal and EpCAM+ epithelial cells isolated from salivary glands at day 2 p.c. stimulated in vitro with IL-22 (black bars), IL-22, TNF-α, and LTβR agonist (gray bars), TNF-α and LTβR agonist (light brown bars), or PBS (white bars). cxcl13 and cxcl12 mRNA transcripts were normalized to β-actin mRNA. Results are presented as RQ values compared with PBS-treated gp38+ stromal cells (B) or epithelial cells (C) as calibrator. Data present the mean ± SD of two independent experiments with three technical replicates per experiment. **P < 0.01; ***P < 0.001.
Fig. 5.
Fig. 5.
In vivo blockade of IL-22 reverses TLO formation and inhibits autoantibody production. (A) Lymphocytic aggregates from WT cannulated salivary glands from untreated mice, control IgG-treated mice, and mice treated with anti–IL-22 blocking antibody from day 8 or day 2 p.c. analyzed at day 15 p.c. for CD3 (red), CD19 (blue), and CXCL13 (green). (B) The ratio between the area covered by CD19+ B cells and CD3+ T cells at day 15 p.c. for the conditions above. Data present the mean ± SD of two independent experiments with two or three mice (four or six salivary glands) per group. ***P < 0.001. (C) Lymphoid follicle size for conditions above calculated as described in Methods for aggregates at day 15 p.c. Data present the mean ± SD of two independent experiments with two or three mice (four or six salivary glands) per group. ***P < 0.001. (D, Left) Immunofluorescent detection of autoantibody on Hep2 cells showing nuclear reactivity in sera at day 23 p.c. (nuclear staining in gray, autoantibody reactivity in green) (dilution 1:80). (Right) Graph summarizing autoantibody reactivity. The data present the mean ± SD of two experiments with four cannulated mice (biological replicates expressed as the percentage of mice positive for autoantibody at 1:80 dilution or more).
Fig. S5.
Fig. S5.
(A and B) Quantitative PCR analysis for cxcl13 (A) and cxcl12 (B) mRNA obtained from salivary glands at day 15 p.c. from untreated mice, mice treated with IgG2a isotope control, and mice treated with anti–IL-22 (αIL22) from day 8 and day 2 post cannulation. The cxcl13 and cxcl12 mRNA transcripts were normalized to pdgfrß mRNA, and results are presented as RQ values calculated with day 0 untreated salivary glands as calibrator. Data are presented as the mean ± SD of two independent experiments with two or three mice (four or six salivary glands) per group. *P < 0.05; ***P < 0.001 versus untreated or control Ig-treated cannulated salivary gland. (C) Quantitative PCR analysis for aicda mRNA obtained from salivary glands at day 23 p.c., for WT cannulated untreated mice (black bars), control Ig-treated mice (gray bars), and mice treated with IL-22–blocking antibodies from day 8 p.c. (white bars) or day 2 p.c. (patterned bars). Results are presented as RQ value compared with day 0 resting salivary glands. Data presented the mean ± SD of two independent experiments with two or three mice per group. GEE analysis was followed by Sidak’s significance test; *P < 0.05; ***P < 0.001.
Fig. S6.
Fig. S6.
Expression of luciferase activity in salivary glands of WT (black bars) versus Il22−/− (white bars) mice cannulated with AdV5 replication-deficient virus containing the luciferase transgene at day 0, at 3 h p.c., and days 2, 5, 8, 15, and 23 p.c. Data present the mean ± SD of four to six mice for each p.c. time point. GEE analysis was followed by Sidak’s significance test.

References

    1. Aloisi F, Pujol-Borrell R. Lymphoid neogenesis in chronic inflammatory diseases. Nat Rev Immunol. 2006;6(3):205–217. - PubMed
    1. Pitzalis C, Jones GW, Bombardieri M, Jones SA. Ectopic lymphoid-like structures in infection, cancer and autoimmunity. Nat Rev Immunol. 2014;14(7):447–462. - PubMed
    1. Barone F, et al. Association of CXCL13 and CCL21 expression with the progressive organization of lymphoid-like structures in Sjögren’s syndrome. Arthritis Rheum. 2005;52(6):1773–1784. - PubMed
    1. Salomonsson S, et al. Expression of the B cell-attracting chemokine CXCL13 in the target organ and autoantibody production in ectopic lymphoid tissue in the chronic inflammatory disease Sjögren’s syndrome. Scand J Immunol. 2002;55(4):336–342. - PubMed
    1. Barone F, et al. CXCL13, CCL21, and CXCL12 expression in salivary glands of patients with Sjogren’s syndrome and MALT lymphoma: Association with reactive and malignant areas of lymphoid organization. J Immunol. 2008;180(7):5130–5140. - PubMed

Publication types