. 2015 Aug 19:4:e09351.
doi: 10.7554/eLife.09351.

Orchestration of microtubules and the actin cytoskeleton in trichome cell shape determination by a plant-unique kinesin

Affiliations

Orchestration of microtubules and the actin cytoskeleton in trichome cell shape determination by a plant-unique kinesin

Juan Tian et al. Elife. .

Abstract

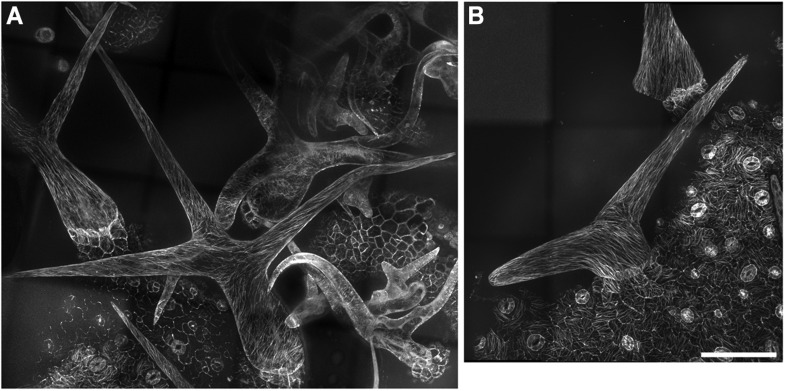
Microtubules (MTs) and actin filaments (F-actin) function cooperatively to regulate plant cell morphogenesis. However, the mechanisms underlying the crosstalk between these two cytoskeletal systems, particularly in cell shape control, remain largely unknown. In this study, we show that introduction of the MyTH4-FERM tandem into KCBP (kinesin-like calmodulin-binding protein) during evolution conferred novel functions. The MyTH4 domain and the FERM domain in the N-terminal tail of KCBP physically bind to MTs and F-actin, respectively. During trichome morphogenesis, KCBP distributes in a specific cortical gradient and concentrates at the branching sites and the apexes of elongating branches, which lack MTs but have cortical F-actin. Further, live-cell imaging and genetic analyses revealed that KCBP acts as a hub integrating MTs and actin filaments to assemble the required cytoskeletal configuration for the unique, polarized diffuse growth pattern during trichome cell morphogenesis. Our findings provide significant insights into the mechanisms underlying cytoskeletal regulation of cell shape determination.

Keywords: actin filaments; arabidopsis; cell biology; cell shape determination; kinesin; microtubules; plant biology; trichome.


Conflict of interest statement

The authors declare that no competing interests exist.

Figures

Figure 1.
Figure 1.. KCBP colocalizes with cortical MTs in vivo.
(A) GFP-labeled kinesin-like calmodulin-binding protein (KCBP) localizes along cortical microtubules (MTs) (mCherry-TUB6) in a punctate pattern in Arabidopsis epidermal pavement cells. The yellow box highlights the area used to generate the kymograph and the yellow arrow marks the direction for the kymographic analysis in (B). See also Video 1. (B) Kymograph showing the dynamicity of GFP-KCBP particles. The bright dots indicate transient appearance of most GFP-KCBP particles and the linear tracks indicate the motility of GFP-KCBP particles either dwelling on (marked by arrowheads) or moving along MTs (marked by arrows) for a short time. (C, D) Distribution of the velocity (C) and the run length (D) of GFP-KCBP moving along cortical MTs. The mean values are shown with standard deviations and examined sample sizes. Dashed lines represent the trends derived from exponential fits. Scale bars, 5 μm. DOI: http://dx.doi.org/10.7554/eLife.09351.003
Figure 1—figure supplement 1.
Figure 1—figure supplement 1.. Genetic identification of the kcbp-1/zwiA mutant.
(A) Gene structure of the KCBP gene. Black rectangles indicate exons, gray rectangles indicate the 5′ and 3′ untranslated regions, and thick lines indicate introns. The arrow indicates the location of the T-DNA insertion in the kcbp-1/zwiA mutant. (B) PCR-based identification of the T-DNA insertion. LP and RP indicate a pair of KCBP specific primers. BP indicates the T-DNA border primer. (C) RT-PCR-based identification of the kcbp-1/zwiA allele. Red arrows indicate the position and the direction of primers, which are listed in the Supplementary file 1. * Sequencing analysis of the PCR product amplified by the LBb1.3/RP primer pair revealed that the T-DNA insertion is in the third exon and located at the position of 957 bp downstream the ATP start codon of the KCBP gene and introduces a premature stop codon 61 bp downstream the insertion site by frame shift. Thus, the kcbp-1/zwiA mutant is expected to produce a short peptide of 284 amino acids containing the first 263 amino acids of KCBP at a lower level. The sequence of the PCR product is pasted below: CATCTGATCGATCTACGCCTCCCAGTTTAGATGAACGCATTGACCTCGTTGGAAAGCTCTTCAAAAAAACTTTGAAGCGT GTTGAACTCAGGGACGAACTTTTTGCCCAAATCTCCAAACAGACTAGACATAATCCTGACAGGCAATACTTGATCAAAGC TTGGGAATTGATGTACTTATGTGCCTCCTCTATGCCTCCTAGCAAAGATATCGGTGGATATCTATCTGAGTATATTCATA ATGTCGCACACGATGCAACTATTGAACCGGATGCTCAGGTTCTTGCTGTTAACACTTTGAAAGCTTTAAAGCGCTCTATC AAAGCCAACATTAATAACACATTGCGGACGTTTTTAATGTACTGGGGTGGTTTTTCTTTTCACCAGTGAGACGGGCAACA GCTGATTGCCCTTCACCGCCTGGCCCTGAGAGAGTTGCAGCAAGCGGTCCACGCTGGTTTGCCCCAGCAGGCGAAAATCC TGTTTGATGGTGGTTCCGAAATCGGCAAAAT Note: The 325-bp fragment, bolded, is the sequence of 633–957 bp downstream the ATG start codon of the KCBP gene; and the remaining 186-bp fragment is the T-DNA sequence. The 21 bp, underlined and bolded, is the sequence of the primer 031704-RP; and the 19 bp, underlined, is the reverse complement sequence of the primer LBb1.3. DOI: http://dx.doi.org/10.7554/eLife.09351.005
Figure 1—figure supplement 2.
Figure 1—figure supplement 2.. KCBP colocalizes with cortical MTs in Arabidopsis hypocotyl cells.
(A) The genomic GFP-KCBP fusion complements the trichome defects of the kcbp-1 mutant. Scale bar, 1 mm. (B) GFP-labeled KCBP localizes along cortical MTs (mCherry-TUB6) in a punctate pattern in Arabidopsis hypocotyl cells. The yellow box highlights the area used to generate the kymograph and the yellow arrow marks the direction for the kymographic analysis in (C). See also Video 2. Scale bar, 5 μm. (C) Kymograph showing the dynamicity of GFP-KCBP particles. The bright dots indicate transient appearance of most GFP-KCBP particles and the linear tracks indicate the motility of GFP-KCBP particles either dwelling on (marked by arrowhead) or moving along MTs (marked by arrow) for a short time. Scale bar, 5 μm. DOI: http://dx.doi.org/10.7554/eLife.09351.006
Figure 2.
Figure 2.. Spatio-temporal distribution of GFP-KCBP in developing wild-type trichomes.
(AF) Localization of KCBP and spatial organization of the cytoskeleton in stage 2/3 trichomes. GFP-KCBP particles form a cortical gradient with the highest expression at the branching site and the tip region of the main stem (A). The arrow and the arrowhead highlight the concentration of GFP-KCBP at the extreme apex of the main stem and the apical region of the incipient primary branch by three-dimension (3-D) reconstruction, respectively (D). Transverse MT arrays form rings encircling the elongating main stem, but leave a MT-depleted zone at the extreme apex. The incipient primary branch is also encircled by transverse MT rings, with the apex colonized by sparse MT meshworks (B). The arrow and the arrowhead in (E) highlight the 3-D reconstruction of the MT-depleted zone at the extreme apex of the main stem and the sparse MT meshworks at the apical region of the incipient primary branch, respectively. Cytoplasmic cables extend along the growth axis of the main stem, from the base to the tip region where they form a fine, cortical F-actin cap mainly in a transverse pattern, highlighted by the brackets (C). The arrow and the arrowhead in (F) highlight the 3-D reconstruction of the F-actin cap at the tip region of the main stem and actin bundles at the apical region of the incipient primary branch, respectively. See also Video 3. (GI) Localization of KCBP and spatial organization of the cytoskeleton in stage 3/4 trichomes. KCBP forms a transverse cortical punctate pattern, with the highest amounts (indicated by arrows) at the extreme apex of the elongating branches. The tandem arrowhead highlights GFP-KCBP particles in the transverse linear pattern (G). Transverse MT rings display a tip-directed density gradient, but with a MT-depleted zone (indicated by arrows) at the extreme apex of the elongating branches (H). Cytoplasmic actin cables (indicated by open arrows) extend along the growth axis of elongating branches and reach near the tip, where there is a fine, transversely aligned F-actin cap (highlighted by brackets) (I). See also Video 4. The maximum z-projection of image stacks at 0.2-μm intervals was applied to all figures. Scale bars, 20 μm. One grid unit in (DF) indicates 7.31 μm. DOI: http://dx.doi.org/10.7554/eLife.09351.009
Figure 2—figure supplement 1.
Figure 2—figure supplement 1.. Colocalization of KCBP with cortical MTs in stage 2 trichomes.
GFP-KCBP particles form a cortical gradient with the highest expression at the branching site and the tip region of the main stem. The arrowheads highlight the strongest accumulation of GFP-KCBP at the apex of the main stem and the apical region of the incipient primary branch. Transverse MT arrays form rings encircling the elongating main stem, but leave a MT-depleted zone at the extreme apex. The incipient primary branch is also encircled by transverse MT rings, with the apex colonized by sparse MT meshworks. The arrows highlight the transverse MT rings. The mCherry-labeled MTs are difficult to detect and undergo rapid photobleaching in trichomes. The maximum z-projection of image stacks at 0.2-μm intervals was applied to all figures. Scale bars, 5 μm. DOI: http://dx.doi.org/10.7554/eLife.09351.010
Figure 2—figure supplement 2.
Figure 2—figure supplement 2.. Localization of KCBP and spatial organization of MTs in stage 2/3 wild-type trichomes.
(A) The GFP-KCBP images, which were used to make the z-projection in Figure 2A, were sequentially illustrated at 0.4-μm intervals. GFP-KCBP was observed to strongly accumulate at apexes of elongating branches and branching sites in stage 2/3 trichome. Scale bars, 5 μm. (B) The GFP-TUB6 images, which were used to make the z-projection in Figure 2B, were sequentially illustrated at 0.4-μm intervals. A MT-depleted zone was observed at extreme apexes of elongating branches in stage 2/3 trichome. Scale bars, 5 μm. DOI: http://dx.doi.org/10.7554/eLife.09351.011
Figure 2—figure supplement 3.
Figure 2—figure supplement 3.. Localization of GCP2 in stage 2/3 wild-type trichomes.
(A) The Z-projection image, which was acquired from a high-resolution stack of 46 planes at 0.2-μm intervals, shows a tip-oriented cortical gradient of GCP2-3×GFP particles in the elongating main stem in a stage 2/3 trichome. Absence of GCP2-3×GFP was observed at the extreme apexes of the main stems. Scale bar, 10 μm. (B) Absence of GCP2-3×GFP at the extreme apexes of the main stems is highlighted by the 3-D reconstruction of stage 2/3 trichomes. One grid unit indicates 5.63 μm. (C) The GCP2-3×GFP images, which were used to make the Z-projection in (A), were sequentially illustrated at 0.4-μm intervals. Absence of GCP2-3×GFP was shown at extreme apexes of elongating branches in stage 2/3 trichome. Scale bars, 10 μm. DOI: http://dx.doi.org/10.7554/eLife.09351.012
Figure 3.
Figure 3.. Abnormal MT organization in kcbp-1 trichomes.
(AF) Spatio-temporal MT organization in wild-type trichomes during development. The stage 1 trichomes exhibit random MT networks (A). In stage 2/3 trichomes, the random MT network shifts into transverse MT rings encircling the elongating main stem and the incipient primary branch (B, C). In stage 3/4/5 trichomes (DF), cortical MTs rings encircle the elongating branches but leave a MT-depleted zone at the extreme apex, which is highlighted by 3-D reconstruction (the inset in D) of the area outlined by the dotted box. See also Video 6. (GK) Spatio-temporal MT organization in kcbp-1 trichomes during development. The stage 1 kcbp-1 trichomes form shorter and rounder tubular cells with random MT networks (G). In stage 2/3 trichomes, formation of the transverse MT rings that encircle the incipient primary branch is impaired (H, I). The 3-D reconstruction (the inset in I) of the incipient primary branch tip (outlined by the dotted box) shows that the MT-depleted zone is not well defined. In stage 3/4/5 trichomes (J, K), transverse MT rings are present in a relatively loose distribution. The circled B indicates the base of trichome stalks. See also Video 7. The maximum z-projection of image stacks at 0.2-μm intervals was applied to all figures. One grid unit in the inset of (D, I) indicates 7.31 μm. Scale bars, 20 μm. DOI: http://dx.doi.org/10.7554/eLife.09351.016
Figure 3—figure supplement 1.
Figure 3—figure supplement 1.. Cortical MT organization in wild-type and kcbp-1 mature trichomes.
In stage 6 wild-type mature trichomes (A), fully elongated branches form a fine and pointed tip, and cortical MTs exhibit an oblique or longitudinal configuration. By contrast, the stage 6 kcbp-1 mature trichomes (B) form one blunt tip and another relatively more-pointed tip, with oblique/longitudinal MTs. The maximum z-projection of image stacks at 0.2-μm intervals was applied. The photo stitching application of the Volocity (Version 6.2) program was applied to acquire the image of the entire mature trichomes. Scale bars are 60 μm. DOI: http://dx.doi.org/10.7554/eLife.09351.017
Figure 4.
Figure 4.. Aberrant organization of F-actin in kcbp-1 trichomes.
(AD) Spatio-temporal organization of F-actin in wild-type trichomes during development. In stage 1/2 trichomes, a population of cytoplasmic actin cables align with the growth axis (A, B). In stage 3/4/5 trichomes, the cytoplasmic actin cables extend from the base to the branch tip, while a fine, cortical F-actin cap mainly in the transverse pattern is present in the tip region of elongating branches (C, D). The 3-D reconstructed image (the inset in C) generated from the area outlined by the dotted box highlights the F-actin. White open arrows highlight the parallel cytoplasmic actin cables. (EH) Spatio-temporal organization of F-actin in kcbp-1 trichomes during development. The stage 1/2 trichomes display random meshworks of thick actin bundles (E, F). At stage 3/4/5, the curly intertwined meshwork of thick actin bundles dominates inside trichomes, but parallel-aligned cytoplasmic actin cables and the fine F-actin cap at the branch apex as shown in wild-type are lost (G, H). The 3-D reconstructed image (the inset in G) generated from the area outlined by the dotted box highlights the disorganized F-actin in the tip region of the incipient primary branch. The circled B indicates the base of trichome stalks. The maximum z-projection of image stacks at 0.2-μm intervals was applied to all figures. Scale bars, 20 μm. One grid unit in the inset of (D, E) indicates 7.31 μm. DOI: http://dx.doi.org/10.7554/eLife.09351.020
Figure 5.
Figure 5.. Genetic analyses on the role of individual domains of KCBP in trichome development.
(A) Schematic diagram of the domain organization of KCBP. (B) Genetic complementation test using various truncated versions of KCBP. The genotype column shows the individual constructs containing various truncations used for the genetic complementation in the kcbp-1 background. The phenotype column shows leaf trichomes in various transformants. Scale bars, 1 mm. The asterisk indicates the GFP-KCBP genomic fusion used in the complementation test. DOI: http://dx.doi.org/10.7554/eLife.09351.021
Figure 6.
Figure 6.. The trichome phenotype of rigor-KCBP transformants.
(A) A point mutation was introduced into genomic KCBP including its native regulatory elements generate the rigor-KCBP with a threonine 982-to-asparagine substitution in its ATP-binding motif. The rigor-KCBP construct was introduced into the kcbp-1 mutant to allow us to detect specific dominant-negative effects. (B, E) The typical wild-type trichomes contain a well-extended stalk and three/four branches. (C, F) Most kcbp-1 trichomes contain an unextended stalk and two branches including one shortened branch, with a swollen and blunt tip. (D, GN) Most rigor-KCBP trichomes contain two branches including one extremely twisted and swollen branch (GI); a few of these trichomes show extremely elongated branches (M, N). A small portion of rigor-KCBP trichomes form three branches with one or two swollen and twisted branches (JL). The arrowheads highlight unextended branches in a rigor-KCBP trichome. The arrows highlight two elongated branches with a fine tip, but in an irregular pattern, in a rigor-KCBP trichome. Scale bars are 1 mm in BD, and 0.2 mm in EN. DOI: http://dx.doi.org/10.7554/eLife.09351.022
Figure 6—figure supplement 1.
Figure 6—figure supplement 1.. Abnormal MT organization in rigor-KCBP trichomes.
(A) The formation of the transverse MT rings that encircles the incipient primary branch (indicated by the arrow) is impaired in a stage 2/3 trichome. (B) Transverse MT rings and the MT-depleted zone are not well defined in the extremely swollen branch (indicated by the arrow) of a stage 3/4 trichome. (C) Transverse MT rings and the MT-depleted zone are not well defined in the extremely swollen branch (indicated by the arrow) of a stage 3/4 trichome, which contains other two short branches with relatively fine tip. (D) A stage 4/5 trichome contains three branches with relatively fine tips, but the branching pattern is irregular when compared to the wild type (see Figure 3A–F). Transverse MTs are perpendicular to the growth axis of elongating branches. (E) A stage 4/5 trichome contains only one extremely twisted branch with oblique MTs. (F) A stage 6 mature trichome contains two swollen branches, the longer one has a relatively fine tip and displays oblique MTs, another shorter one has a swollen, blunt tip and displays transverse MTs (indicated by the arrow). (G) An irregular stage 6 mature trichome contains three branches, one is extremely long with a relatively fine tip and displays oblique MTs, the other two are seriously unextended with a blunt tip and shorter one has a swollen, blunt tip and displays oblique MTs (indicated by the arrow). The circled B indicates the base of trichome stalks. The maximum z-projection of image stacks at 0.2-μm intervals was applied to all figures. The photo stitching application of the Volocity (Version 6.2) program was applied to acquire the image of the entire mature trichomes. Scale bars are 20 μm in (AC) and are 40 μm in (DG). DOI: http://dx.doi.org/10.7554/eLife.09351.023
Figure 6—figure supplement 2.
Figure 6—figure supplement 2.. Abnormal organization of actin filaments in rigor-KCBP trichomes.
(A) The stage 1 trichomes display random meshworks of thick actin bundles. (BF) The curly, intertwined, thick actin bundles dominate inside developing rigor-KCBP trichomes, and no parallel-aligned cytoplasmic actin cables and the fine F-actin cap at the branch apex shown in wild type (see Figure 2C,I) is observed. A stage 2 trichome initiates the primary branch (B). A stage 3/4 trichome contains one relatively extended branch and another extremely swollen and unextended branch (C). A stage 3/4 trichome contains only one twisted, swollen branch (D). A stage 4/5 trichome contains only one extremely swollen and twisted branch (E). A stage 4/5 trichome contains three branches, one of which has a relatively fine tip, the others are extremely swollen with blunt tips. The arrowhead indicates the fine tip, and arrows indicate blunt tips (F). The circled B indicates the base of trichome stalks. The maximum z-projection of image stacks at 0.2-μm intervals was applied to all figures. Scale bars, 20 μm. DOI: http://dx.doi.org/10.7554/eLife.09351.024
Figure 7.
Figure 7.. In vitro MT- and F-actin-binding activity of the motorless KCBP and a working model for KCBP during trichome morphogenesis.
(A) The KCBP N-terminal tail containing the MyTH4 domain binds to MTs in vitro. Rhodamine-labeled MTs were incubated with GFP-NT, GFP-MyTH4, GFP-FERM, GFP-NT-MyTH4, GFP-NT-MyTH4-FERM, GFP-NT-MyTH4-FERM-CC recombinant proteins, or control GFP, respectively. GFP-NT-MyTH4-FERM-CC, GFP-NT-MyTH4-FERM, GFP-NT-MyTH4, GFP-NT, and GFP-MyTH4 exhibited a punctate pattern along MTs. Among them, GFP-NT-MyTH4-FERM-CC promoted the formation of densely packed MT bundles. Scale bars, 10 μm. (B) The FERM domain binds to F-actin in vitro. Actin filaments were visualized in the presence of Alexa561-phalloidin. Alexa561-phalloidin labeled F-actin was incubated with GFP-NT, GFP-MyTH4, GFP-FERM, GFP-NT-MyTH4, GFP-NT-MyTH4-FERM, GFP-NT-MyTH4-FERM-CC recombinant proteins, or control GFP, respectively. GFP-NT-MyTH4-FERM-CC, GFP-NT-MyTH4-FERM, and GFP-FERM exhibited a punctate pattern along actin filaments. Among them, GFP-NT-MyTH4-FERM-CC promoted the formation of F-actin bundles. Scale bars, 5 μm. (C) A working model for KCBP during trichome cell shaping (right panel). The three spheres on the left panel show the 3-D reconstructions of the KCBP localization, the MT configuration, and the F-actin configuration in developing trichomes (at stage 2/3), respectively. DOI: http://dx.doi.org/10.7554/eLife.09351.025
Figure 7—figure supplement 1.
Figure 7—figure supplement 1.. Coomassie blue-stained SDS-PAGE gel of the purified GFP-KCBP recombinant proteins with various truncations.
KD, kiloDalton, indicates the mass of molecular markers. DOI: http://dx.doi.org/10.7554/eLife.09351.026
Author response image 1.
Localization of GCP2 in stage 2/3 wild-type trichomes. (A) The Z-projection image, which was acquired from a high-resolution stack of 46 planes at 0.2 μm intervals, shows a tip-oriented cortical gradient of GCP2-3×GFP particles in the elongating main stem in a stage 2/3 trichome. Absence of GCP2-3×GFP was observed at the extreme apexes of the main stems. Scale bars, 10 μm. (B) Absence of GCP2-3×GFP at the extreme apexes of the main stems is highlighted by the 3-D reconstruction of stage 2/3 trichomes. One grid unit indicates 5.63 μm. (C) The GCP2-3×GFP images, which were used to make the Z-projection in (A), were sequentially illustrated at 0.4 μm intervals. Absence of GCP2-3×GFP was observed at extreme apexes of elongating branches in stage 2/3 trichome. Scale bars, 10 μm. DOI: http://dx.doi.org/10.7554/eLife.09351.030
Author response image 2.
Genetic identification of the kcbp-1 mutant. (A) Gene structure of the KCBP gene. Black rectangles indicate exons, gray rectangles indicate the 5’ and 3’ untranslated regions, and thick lines indicate introns. The arrow indicates the location of the T-DNA insertion in the Salk_031704 line. (B) PCR analysis of the T-DNA insertion. LP and RP indicate a pair of KCBP specific primers. BP indicates the T-DNA border primer. DOI: http://dx.doi.org/10.7554/eLife.09351.032

Similar articles

Cited by

References

    1. Abdel-Ghany SE, Day IS, Simmons MP, Kugrens P, Reddy AS. Origin and evolution of Kinesin-like calmodulin-binding protein. Plant Physiology. 2005;138:1711–1722. doi: 10.1104/pp.105.060913. - DOI - PMC - PubMed
    1. Basu D, El-Assal Sel D, Le J, Mallery EL, Szymanski DB. Interchangeable functions of Arabidopsis PIROGI and the human WAVE complex subunit SRA1 during leaf epidermal development. Development. 2004;131:4345–4355. doi: 10.1242/dev.01307. - DOI - PubMed
    1. Basu D, Le J, El-Essal Sel D, Huang S, Zhang C, Mallery EL, Koliantz G, Staiger CJ, Szymanski DB. DISTORTED3/SCAR2 is a putative Arabidopsis WAVE complex subunit that activates the Arp2/3 complex and is required for epidermal morphogenesis. The Plant Cell. 2005;17:502–524. doi: 10.1105/tpc.104.027987. - DOI - PMC - PubMed
    1. Beilstein M, Szymanski D. In: Cytoskeletal requirements during Arabidopsis trichome development. The plant cytoskeleton in cell differentiation and development. Hussey P, editor. Blackwell: Hoboken, NJ, United States; p; 2004. pp. 265–289.
    1. Bowser J, Reddy AS. Localization of a kinesin-like calmodulin-binding protein in dividing cells of Arabidopsis and tobacco. The Plant Journal. 1997;12:1429–1437. doi: 10.1046/j.1365-313x.1997.12061429.x. - DOI - PubMed

Publication types

Substances