A Century of Tuberculosis Epidemiology in the Northern and Southern Hemisphere: The Differential Impact of Control Interventions
- PMID: 26288079
- PMCID: PMC4545605
- DOI: 10.1371/journal.pone.0135179
A Century of Tuberculosis Epidemiology in the Northern and Southern Hemisphere: The Differential Impact of Control Interventions
Abstract
Background: Cape Town has one of the highest TB burdens of any city in the world. In 1900 the City of Cape Town, New York City and London had high mortality of tuberculosis (TB). Throughout the 20th century contemporaneous public health measures including screening, diagnosis and treatment were implemented in all three settings. Mandatory notification of TB and vital status enabled comparison of disease burden trajectories.
Methods: TB mortality, notification and case fatality rates were calculated from 1912 to 2012 using annual TB notifications, TB death certifications and population estimates. Notification rates were stratified by age and in Cape Town by HIV status (from 2009 onwards).
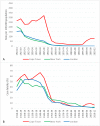
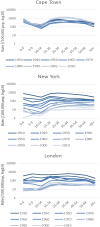
Results: Pre-chemotherapy, TB mortality and notification rates declined steadily in New York and London but remained high in Cape Town. Following introduction of combination chemotherapy, mean annual case fatality dropped from 45-60% to below 10% in all three settings. Mortality and notification rates subsequently declined, although Cape Town notifications did not decline as far as those in New York or London and returned to pre-chemotherapy levels by 1980. The proportional contribution of childhood TB diminished in New York and London but remained high in Cape Town. The advent of the Cape Town HIV-epidemic in the 1990s was associated with a further two-fold increase in incidence. In 2012, notification rates among HIV-negatives remained at pre-chemotherapy levels.
Conclusions: TB control was achieved in New York and London but failed in Cape Town. The TB disease burden trajectories started diverging before the availability of combination chemotherapy in 1952 and further diverged following the HIV epidemic in 1990. Chemotherapy impacted case fatality but not transmission, evidenced by on-going high childhood TB rates. Currently endemic TB results from high on-going transmission, which has been exacerbated by the HIV epidemic. TB control will require reducing transmission, which is inexorably linked to prevailing socio-economic factors.
Conflict of interest statement
Figures


References
-
- Wilson LG. The historical decline of tuberculosis in Europe and America: its causes and significance. J Hist Med Allied Sci. 1990;45(3):366–96. . - PubMed
-
- Drolet G, Lowell A, New York Health and Tuberculosis Association. A half century's progress against tuberculosis in New York city, 1900–1950. 1952. Available from: http://www.nyc.gov/html/doh/downloads/pdf/tb/tb1900.pdf. Accessed 20-9-2012.
-
- Davies RP, Tocque K, Bellis MA, Rimmington T, Davies PD. Historical declines in tuberculosis in England and Wales: improving social conditions or natural selection? Int J Tuberc Lung Dis. 1999;3(12):1051–4. . - PubMed
-
- Grange JM, Gandy M, Farmer P, Zumla A. Historical declines in tuberculosis: nature, nurture and the biosocial model. Int J Tuberc Lung Dis. 2001;5(3):208–12. . - PubMed
Publication types
MeSH terms
Grants and funding
LinkOut - more resources
Full Text Sources
Other Literature Sources

