. 2015 Oct;10(10):1600-11.
doi: 10.1002/biot.201400749. Epub 2015 Sep 10.

Enzymatic passaging of human embryonic stem cells alters central carbon metabolism and glycan abundance

Affiliations

Enzymatic passaging of human embryonic stem cells alters central carbon metabolism and glycan abundance

Mehmet G Badur et al. Biotechnol J. 2015 Oct.

Abstract

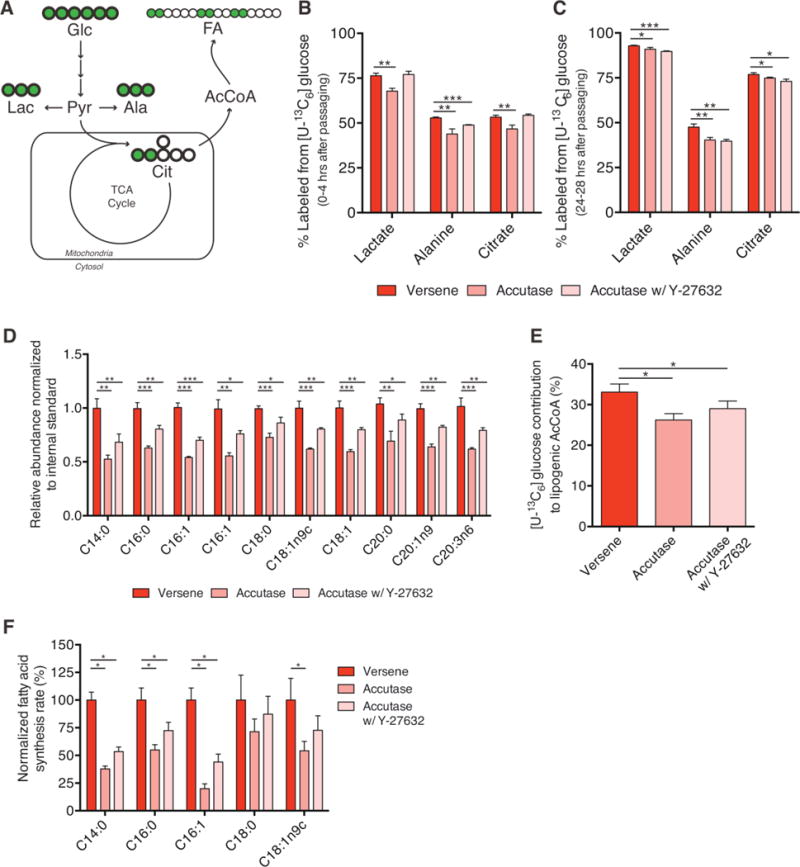
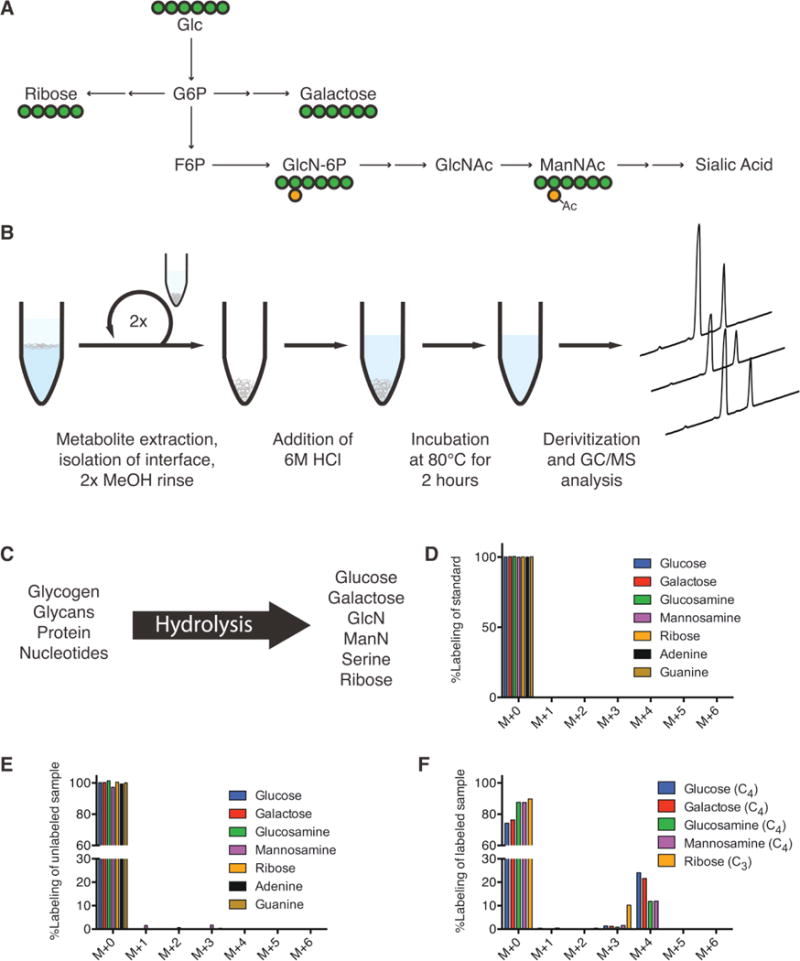
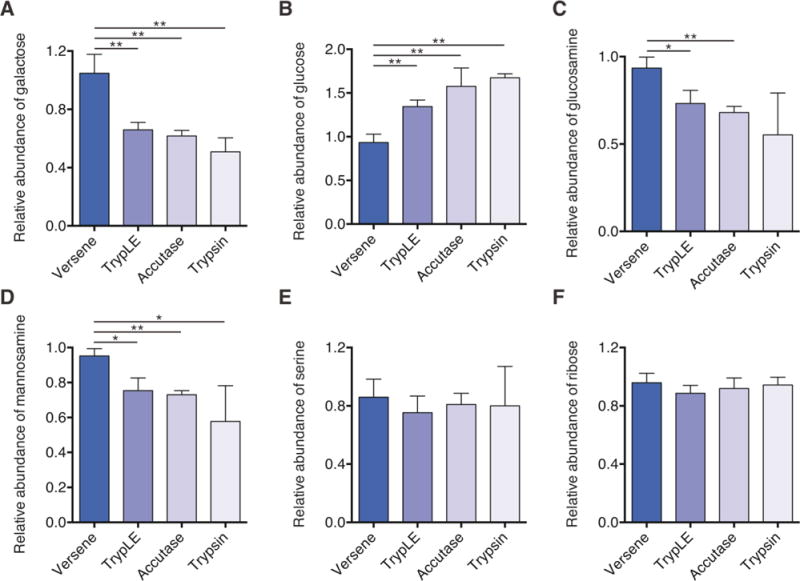
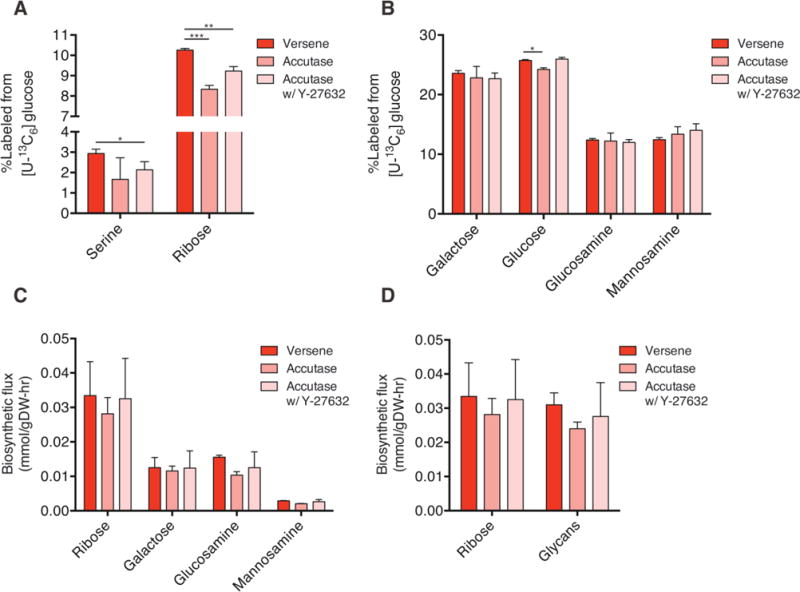
To realize the potential of human embryonic stem cells (hESCs) in regenerative medicine and drug discovery applications, large numbers of cells that accurately recapitulate cell and tissue function must be robustly produced. Previous studies have suggested that genetic instability and epigenetic changes occur as a consequence of enzymatic passaging. However, the potential impacts of such passaging methods on the metabolism of hESCs have not been described. Using stable isotope tracing and mass spectrometry-based metabolomics, we have explored how different passaging reagents impact hESC metabolism. Enzymatic passaging caused significant decreases in glucose utilization throughout central carbon metabolism along with attenuated de novo lipogenesis. In addition, we developed and validated a method for rapidly quantifying glycan abundance and isotopic labeling in hydrolyzed biomass. Enzymatic passaging reagents significantly altered levels of glycans immediately after digestion but surprisingly glucose contribution to glycans was not affected. These results demonstrate that there is an immediate effect on hESC metabolism after enzymatic passaging in both central carbon metabolism and biosynthesis. HESCs subjected to enzymatic passaging are routinely placed in a state requiring re-synthesis of biomass components, subtly influencing their metabolic needs in a manner that may impact cell performance in regenerative medicine applications.

Keywords: Glycans; Lipids; Pluripotent stem cells; Stable isotope tracing; Stem cell metabolism.


Conflict of interest statement

The authors declare no financial or commercial conflict of interest.

Figures

Figure 1
Figure 1
Enzymatic passaging alters central carbon metabolism. (A) Atom-transition map depicting flow of [U-13C6]glucose (UGlc) carbon through central carbon metabolism and lipid biosynthesis. Green circles depict 13C atoms and open circles depict 12C atoms. (B) Percentage of labeled metabolites from UGlc 4 h after non-enzymatic or enzymatic passaging. Higher labeling indicates greater glucose usage for glycolysis, non-essential amino acid synthesis, and TCA metabolism. (C) Percentage of labeled metabolites from UGlc one day after non-enzymatic or enzymatic passaging (i.e. labeled from 24–28 h after passaging). Defects in glucose catabolism mediated through enzymatic passaging are still present. (D) Relative abundance of fatty acid species after enzymatic or non-enzymatic passaging. (E) Contribution of UGlc to lipogenic AcCoA as determined by ISA model. Decrease in contribution is consistent with decreased labeling in the lipogenic metabolite citrate. (F) Normalized fatty acid flux for synthesized fatty acid species calculated using total pool size and fractional synthesis from ISA model. Error bars represent SD (BD) or 95% CI (EF) for three replicates. *, p-value between 0.01 and 0.05; **, p-value between 0.001 and 0.01; ***, p-value < 0.001 by Student’s two-tailed t-test; or, * indicates significance by nonoverlapping 95% confidence intervals
Figure 2
Figure 2
Quantitation of glycan residue abundance and labeling in cellular biomass. (A) Atom-transition map depicting flow of [U-13C6]glucose (UGlc) into ribose, galactose, and hexosamines. Green circles depict carbon atoms and orange circles depict nitrogen atoms. (B) Schematic of biomass hydrolysis method. Insoluble interface layer is isolated from initial methanol/water/chloroform quench/extraction, rinsed twice with methanol, and acid hydrolyzed. (C) Diagram of detectable metabolites after acid hydrolysis. Major macromolecules (nucleotides, protein, glycans) are broken down into primary components (ribose/nucleobases, amino acids, sugars/amino-sugars, respectively), which can be measured on GC/MS. (D) Corrected mass isotopomer distribution (MID) of each metabolite standard. Corrected M + 0 peak equal to unity ensures accuracy of MIDs. (E) Corrected MID of metabolites from unlabeled cell hydrolysates. Corrected M + 0 peak deviation from unity is informative of MID accuracy and potential contaminating fragments in hydrolysates. (F) Corrected MID of metabolites measured in hydrolysates from hESCs labeled using UGlc. Glucose, galactose, glucosamine, and mannosamine fragments have four carbons labeled from glucose. Ribose has three carbons labeled from glucose. Error bars represent SD (EF) for three independent hydrolysates.
Figure 3
Figure 3
Enzymatic passaging alters glycan abundance of hESCs. (AF) Relative abundance of biomass-derived galactose (A), glucose (B), glucosamine (C), mannosamine (D), serine (E), and ribose (F) immediately after passaging. All data are reported relative to Versene. Decreases in hexose (galactose) and hexosamine (mannosamine and glucosamine) abundances suggest that glycans are impacted by enzymatic passaging. This change in abundance is not observed in protein-derived amino acids (serine) or nucleotide/cofactor-derived ribose. Error bars represent SD (AF) for three replicates. *, p-value between 0.01 and 0.05; **, p-value between 0.001 and 0.01; ***, p-value < 0.001 by Student’s two-tailed t-test.
Figure 4
Figure 4
Biosynthetic fluxes to glycans and nucleotides are similar in cultured hESCs. (A) Percentage of labeled serine and ribose in cells cultured for 4 h after passaging in the presence of [U-13C6]glucose (UGlc). (B) Percentage of labeled glycan moieties from biomass in cells treated as in (A). (C) Quantitation of biosynthetic flux to different metabolites calculated using MIDs and molar pool sizes. (D) Comparison of fluxes to ribose versus glycans demonstrates similar biosynthetic needs in hESCs. Error bars represent SD (AD) for three replicates. *, p-value between 0.01 and 0.05; **, p-value between 0.001 and 0.01; ***, p-value < 0.001 by Student’s two-tailed t-test.

References

    1. Thomson JA, Itskovitz-Eldor J, Shapiro SS, Waknitz MA, et al. Embryonic stem cell lines derived from human blastocysts. Science. 1998;282:1145–1147. - PubMed
    1. Ludwig TE, Levenstein ME, Jones JM, Berggren WT, et al. Derivation of human embryonic stem cells in defined conditions. Nat Biotechnol. 2006;24:185–187. - PubMed
    1. Draper JS, Smith K, Gokhale P, Moore HD, et al. Recurrent gain of chromosomes 17q and 12 in cultured human embryonic stem cells. Nat Biotechnol. 2004;22:53–54. - PubMed
    1. Buzzard JJ, Gough NM, Crook JM, Colman A. Karyotype of human ES cells during extended culture. Nat Biotechnol. 2004;22:381–382. author reply 382. - PubMed
    1. Mitalipova MM, Rao RR, Hoyer DM, Johnson JA, et al. Preserving the genetic integrity of human embryonic stem cells. Nat Biotechnol. 2005;23:19–20. - PubMed

Publication types