. 2015 Oct;114(4):2390-403.
doi: 10.1152/jn.00649.2015. Epub 2015 Aug 19.

Spatiotemporal profiles of receptive fields of neurons in the lateral posterior nucleus of the cat LP-pulvinar complex

Affiliations

Spatiotemporal profiles of receptive fields of neurons in the lateral posterior nucleus of the cat LP-pulvinar complex

Marilyse Piché et al. J Neurophysiol. 2015 Oct.

Abstract

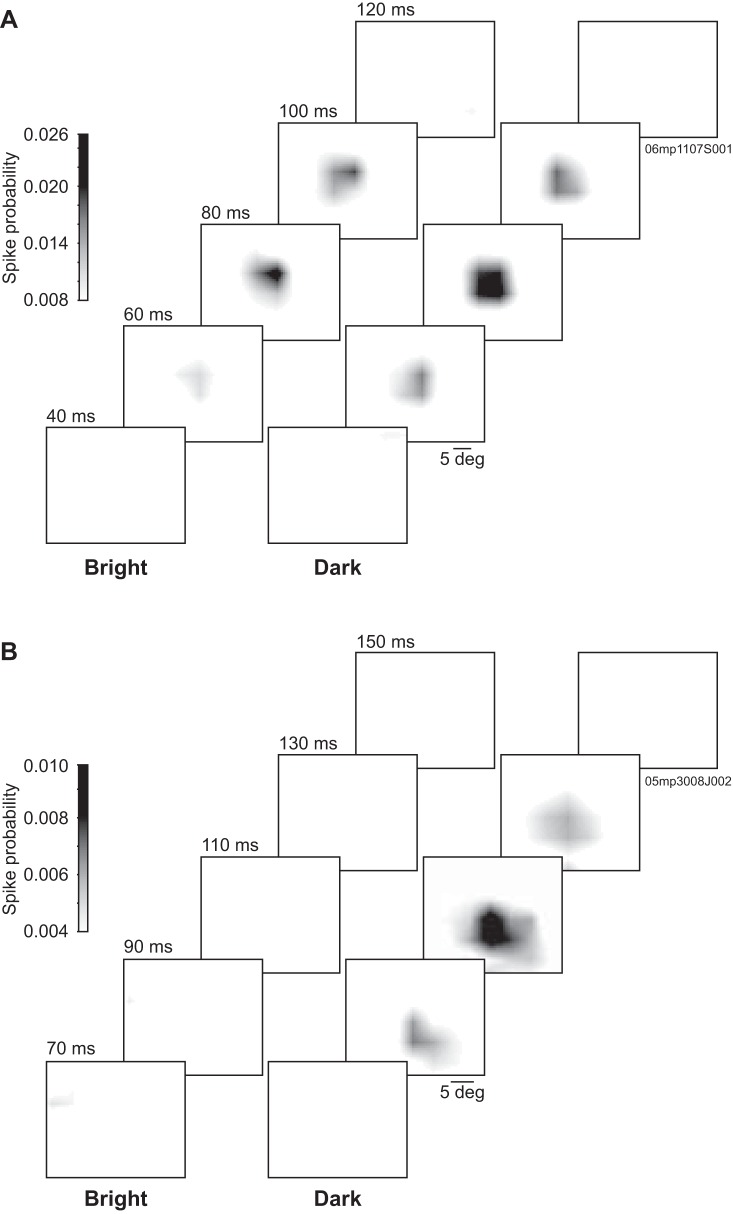
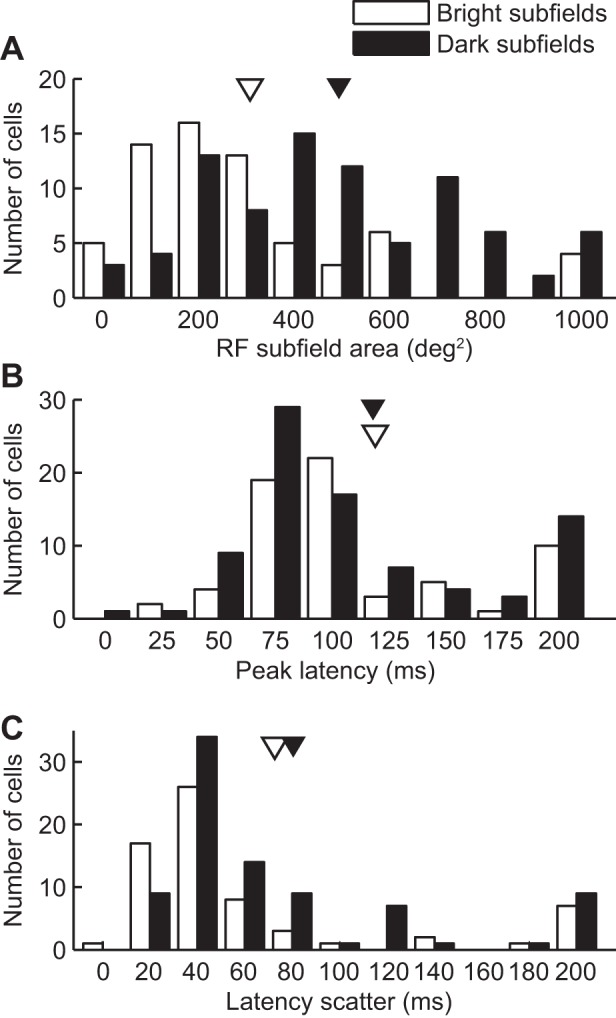
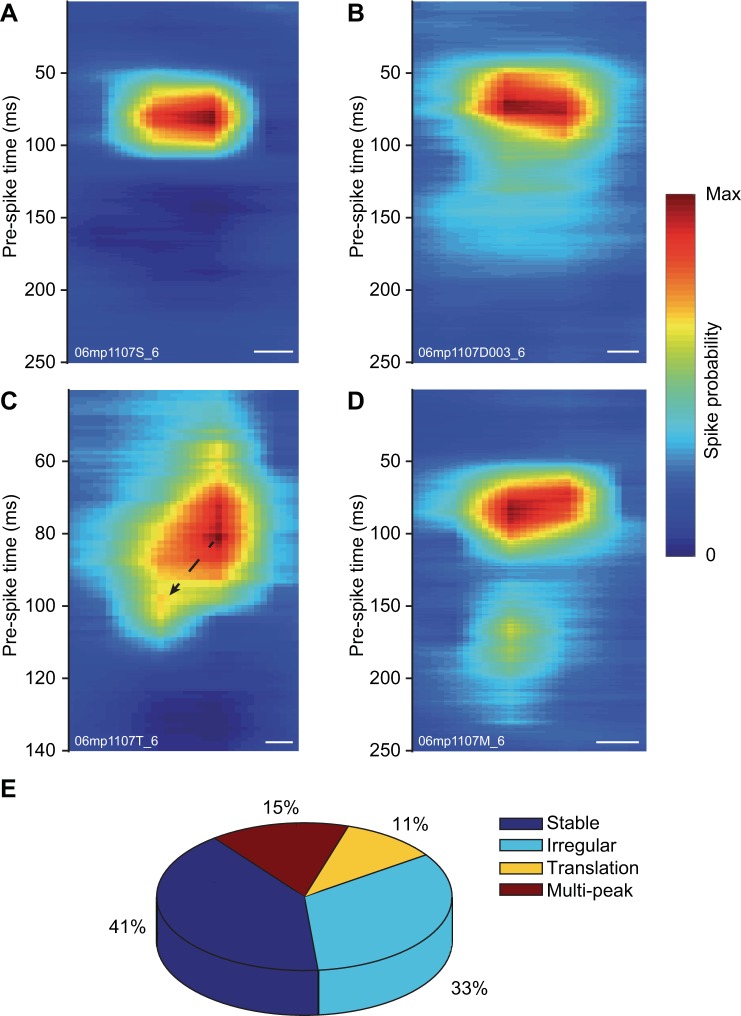
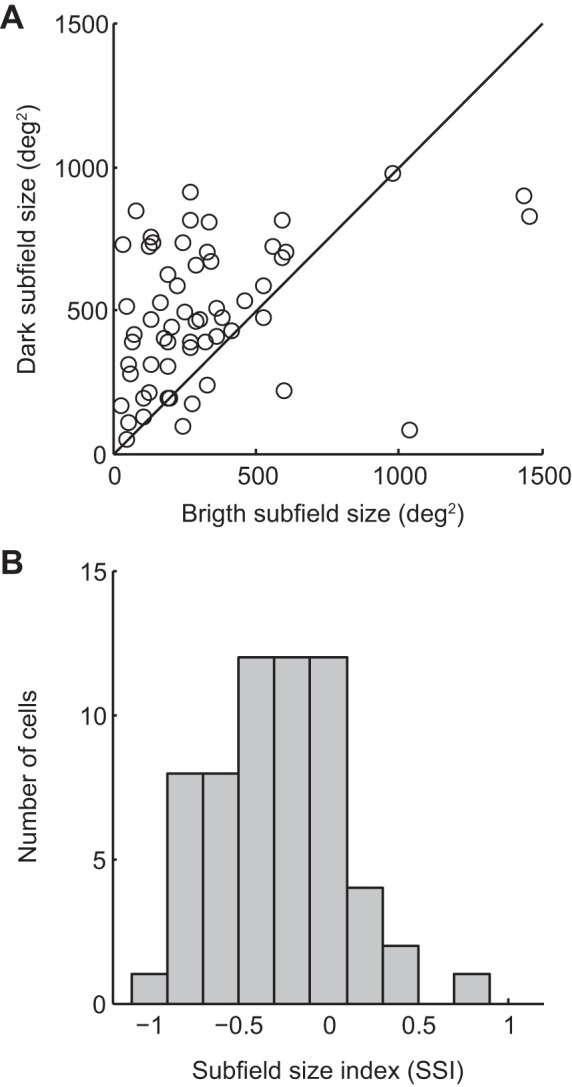
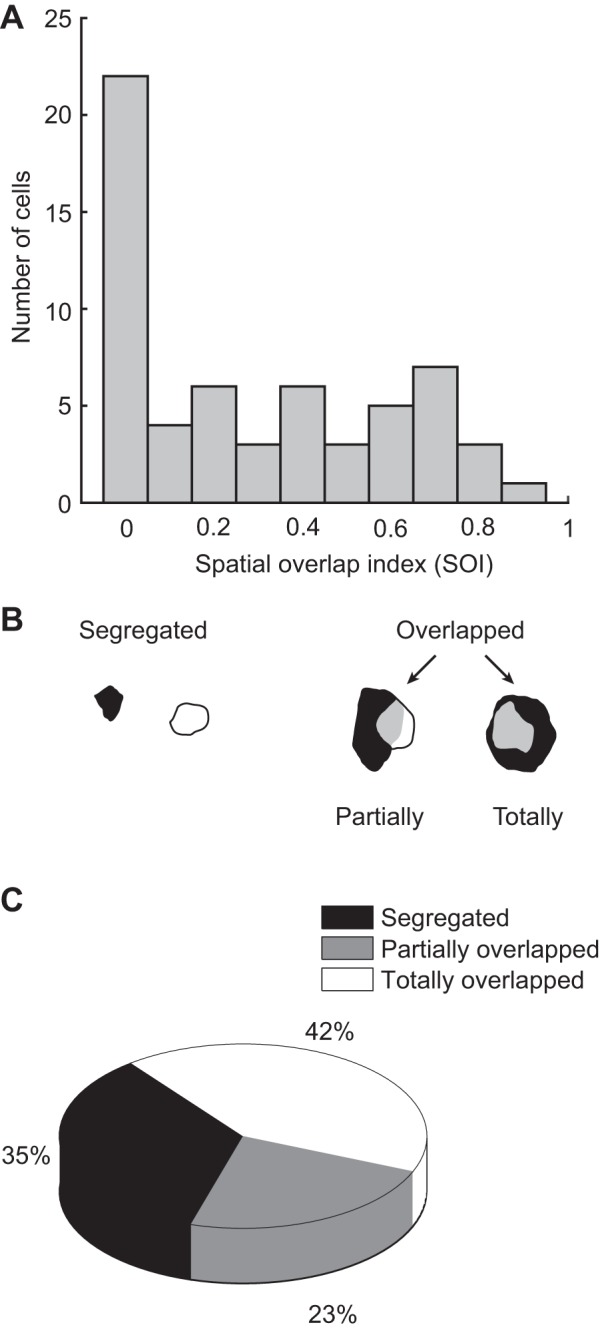
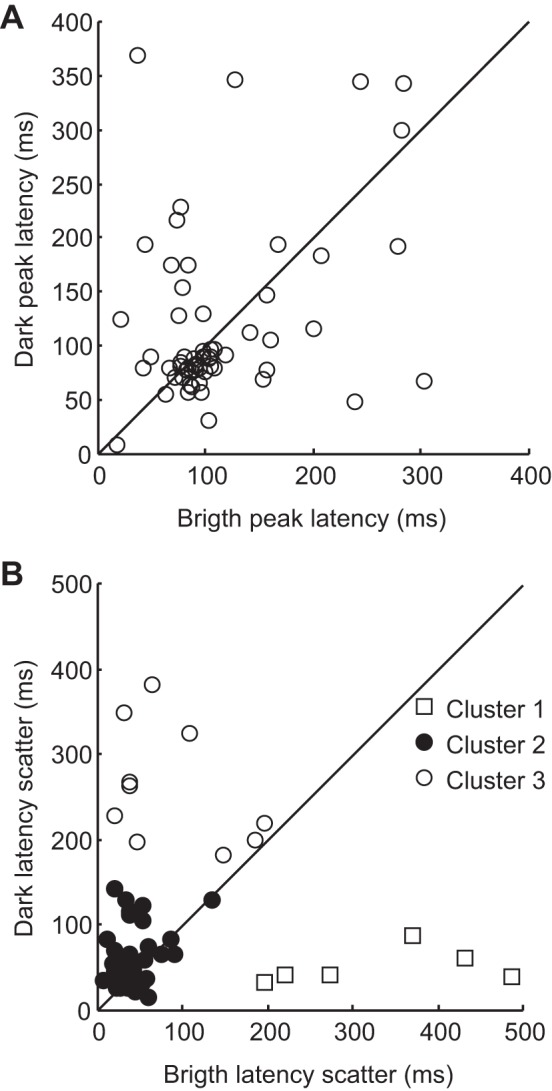
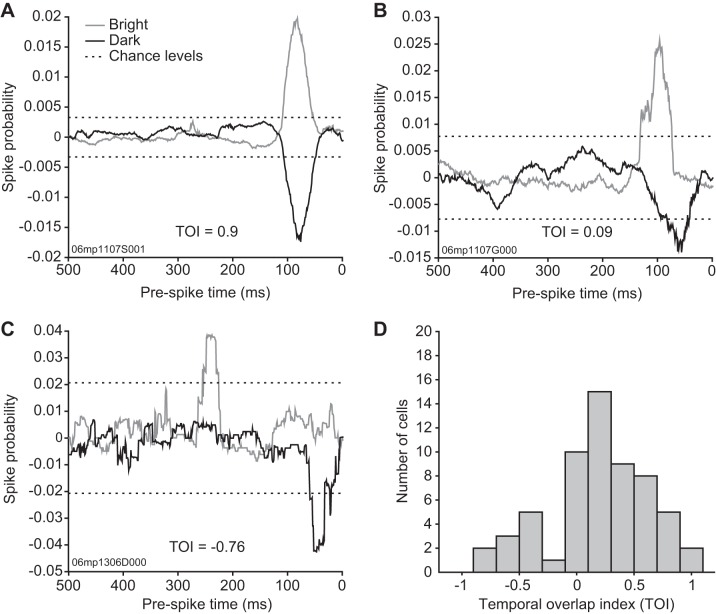
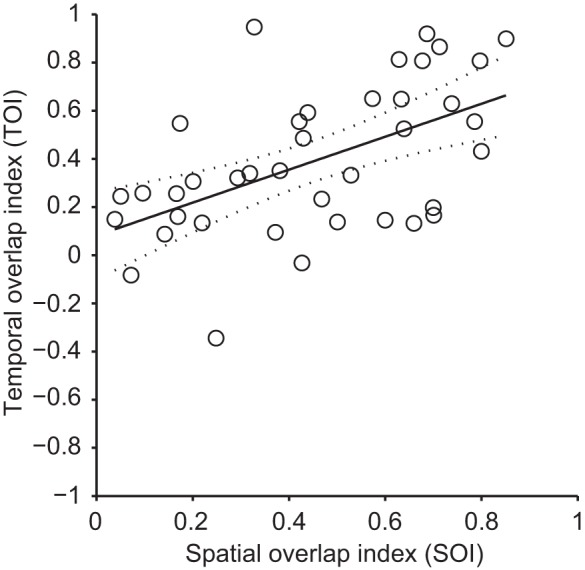
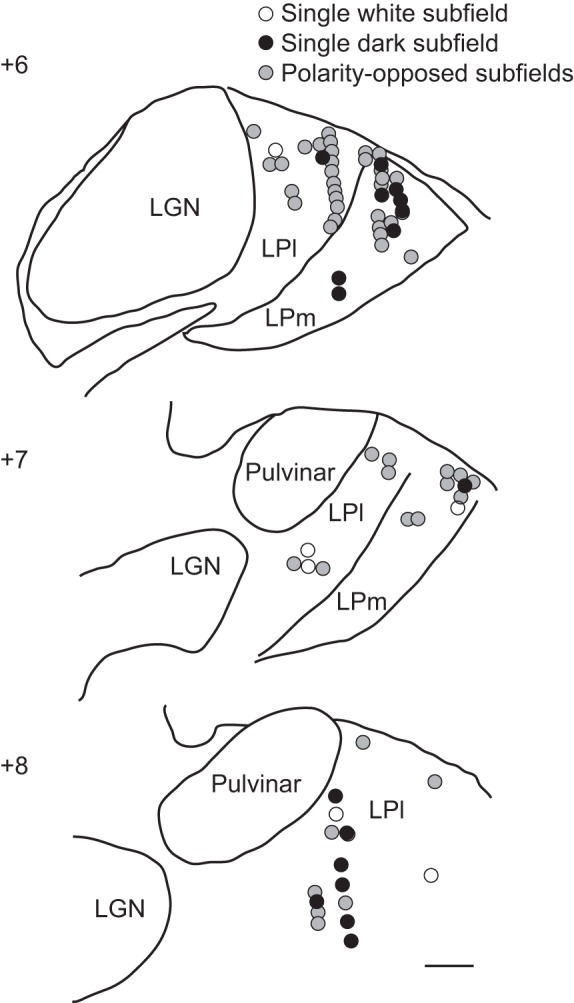
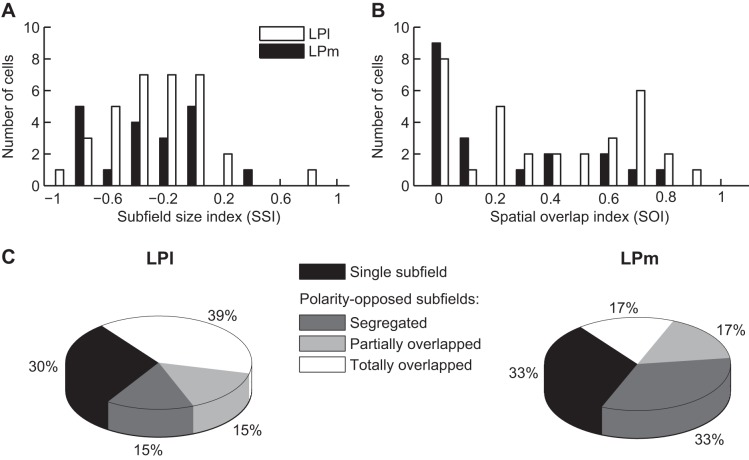
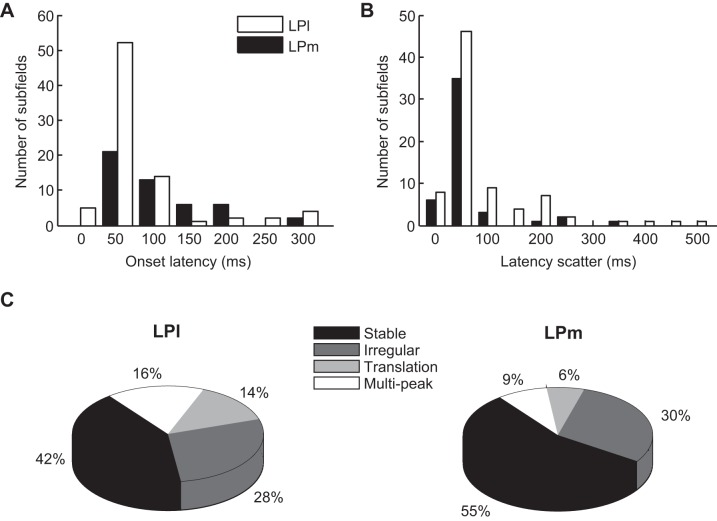
The pulvinar is the largest extrageniculate thalamic visual nucleus in mammals. It establishes reciprocal connections with virtually all visual cortexes and likely plays a role in transthalamic cortico-cortical communication. In cats, the lateral posterior nucleus (LP) of the LP-pulvinar complex can be subdivided in two subregions, the lateral (LPl) and medial (LPm) parts, which receive a predominant input from the striate cortex and the superior colliculus, respectively. Here, we revisit the receptive field structure of LPl and LPm cells in anesthetized cats by determining their first-order spatiotemporal profiles through reverse correlation analysis following sparse noise stimulation. Our data reveal the existence of previously unidentified receptive field profiles in the LP nucleus both in space and time domains. While some cells responded to only one stimulus polarity, the majority of neurons had receptive fields comprised of bright and dark responsive subfields. For these neurons, dark subfields' size was larger than that of bright subfields. A variety of receptive field spatial organization types were identified, ranging from totally overlapped to segregated bright and dark subfields. In the time domain, a large spectrum of activity overlap was found, from cells with temporally coinciding subfield activity to neurons with distinct, time-dissociated subfield peak activity windows. We also found LP neurons with space-time inseparable receptive fields and neurons with multiple activity periods. Finally, a substantial degree of homology was found between LPl and LPm first-order receptive field spatiotemporal profiles, suggesting a high integration of cortical and subcortical inputs within the LP-pulvinar complex.

Keywords: cortico-thalamo-cortical pathways; electrophysiology; reverse correlation; thalamus; visual system.


Figures

Fig. 1.
Fig. 1.
Representative spatiotemporal receptive field (RF) profiles from lateral posterior nucleus (LP) neurons. Grayscale-coded probability spatial maps from LP neurons obtained at different prespike times shown separately for bright and dark stimuli. A: this lateral LP (LPl) neuron responded to both bright and dark stimuli with spatially overlapping RF subfields and with coinciding peak probability latencies of ∼80 ms. This neuron was probed with 6.5° squares distributed on a 15 × 11 stimulation position grid. B: this medial LP (LPm) neuron responded to dark stimuli only, with a peak probability latency of ∼110 ms. This neuron was probed with 5° squares distributed on a 20 × 15 stimulation position grid.
Fig. 2.
Fig. 2.
Basic spatial and temporal features of LP neuron RFs. Distribution histograms of basic RF features for bright (open bars) and dark (filled bars) subfields. Means are indicated by arrowheads. A: distribution histogram of RF subfield sizes. Note that the dark subfield size distribution is shifted to higher surface values (mean in deg2 for bright subfields: 314 ± 35 and for dark subfields: 511 ± 38). B: distribution histogram of the prespike time associated with the maximal spike probability (peak latency). Mean peak latency was 119 ± 6 ms and was not found to differ between bright and dark subfields (bright: 119 ± 9, n = 66, dark: 118 ± 8, n = 85, P > 0.05 Wilcoxon rank sum test). C: distribution histogram of the time duration during which spike probability was above chance levels (latency scatter). A small, yet significant, increase in latency scatter was observed for dark subfields (bright: 73 ± 12 ms, dark: 81 ± 8 ms, P < 0.01 Wilcoxon rank sum test).
Fig. 3.
Fig. 3.
LP neuron RF space and time domain interdependence. AD: examples of heat color-coded spike probability xt maps. From the peak probability y-axis value, the spike probability profile along the x-axis is consecutively drawn at the analysis temporal resolution (1 ms). Bar size, 10°. A: example from a neuron with a stable space- and time-circumscribed RF subfield. B: example from a neuron with irregular spatial boundaries that vary in time around its central position. C: example from a neuron exhibiting translation of its subfield position across time. D: example from a neuron with multiple peak activation periods. E: pie chart showing the proportion of the different spatiotemporal profiles found in the LP neuron population.
Fig. 4.
Fig. 4.
Differences in subfield size from neurons with polarity-opposed subfields. A: scatter plot of subfield size from paired bright and dark subfields. Note the higher proportion of points that lie above the line of unity, indicating a bias toward larger dark subfield sizes. B: distribution histogram of the subfield size index (see methods), a normalized index where negative values are associated with a larger dark subfield size. Distribution mean of −0.26 ± 0.05, P < 0.001 1-sample t-test, n = 60.
Fig. 5.
Fig. 5.
Spatial organization of LP neuron RFs with polarity-opposed subfields. A: distribution histogram of the spatial overlap index (see methods), a normalized index quantifying the degree of spatial overlap between bright and dark subfields. B and C: results from a semiquantitative classification of RF organization found in LP neurons. B: drawings of the different subfield organization types found in LP nucleus. C: pie chart showing the proportion of cells found in each spatial organization class.
Fig. 6.
Fig. 6.
RF temporal profiles of LP neurons with polarity-opposed subfields. A: scatter plot of the prespike times associated with maximal spike probability (peak latency) of dark subfields as a function of their paired bright subfields. Most neurons had similar subfield peak latency values (40/60 cells with <50 ms difference between subfield peak latencies). B: results from cluster analysis of latency scatter differences between bright and dark subfields. K-means cluster analysis identified three groups of cells: one with similar subfield latency scatter values (cluster 2: Δ −19 ± 5 ms, n = 44) and two more groups with distinct subfield latency scatter values (cluster 1: Δ 280 ± 46 ms, n = 6, cluster 3: Δ −174 ± 36 ms n = 10).
Fig. 7.
Fig. 7.
Subfield temporal profile concurrence of LP neurons with polarity-opposed subfields. To quantify the degree of synchronicity between bright and dark subfield spike probability latency profiles, a temporal overlap index (TOI, see methods) was computed. Negative values indicate time-segregated subfield spike latency profiles, whereas a value of 1 would indicate perfect synchrony between bright and dark subfield profiles. AC: examples of temporal profiles obtained from LP neurons with polarity-opposed subfields where spike probability is plotted as a function of prespike time. Bright subfield spike probability is plotted in gray, whereas dark subfield is plotted in dark and, by convention, given negative values. Dotted lines indicate the spike probability levels expected by chance. Individual TOI values are indicated in the graphs. A: spike probability timecourse from a neuron with concurrent subfield spike latencies. B: spike probability timecourse from a neuron with subfield spike latencies that partially overlap. C: spike probability timecourse from a neuron with time-segregated subfield spike latencies. D: histogram of the TOI. Note the distinct distribution peak in negative TOI values (15/60 cells had negative TOI values).
Fig. 8.
Fig. 8.
Correlation between spatial and temporal overlap indexes from neurons with polarity-opposed subfields. TOI values were plotted against spatial overlap index (SOI) values and subject to linear regression analysis. A correlation with a determination coefficient of 0.29 (P < 0.001, F-test) was found between SOI and TOI. Solid line represents the linear regression, and the dotted lines represent the 95% confidence interval of the regression.
Fig. 9.
Fig. 9.
Anatomic distribution of recording sites. Schematic drawings of thalamic coronal sections at different antero-posterior coordinates indicating the anatomic position of the neurons studied. Neurons with polarity-opposed subfields are indicated by gray circles, whereas neurons with single bright or dark subfields are indicated by open and filled circles, respectively. LGN, lateral geniculate. Scale bar is 1 mm.
Fig. 10.
Fig. 10.
Comparison between LPl and LPm RF profiles in the space domain. A: distribution histogram of the subfield size index (SSI) for LPl (open bars) and LPm (filled bars). Distributions were not found to significantly differ (P > 0.05 Student's t-test). B: distribution histogram of the SOI for LPl (open bars) and LPm (filled bars). LPl nucleus data included more cells with high SOI values (P < 0.05 Wilcoxon rank sum test). C: pie charts showing the proportion of the different RF spatial organization types found in LPl (left) and LPm (right) nuclei. Note the higher proportion of neurons with totally overlapped subfields in LPl (P < 0.05 Chi square test with Bonferroni post hoc test).
Fig. 11.
Fig. 11.
Comparison between LPl and LPm RF profiles in the time domain. A: distribution histogram of subfield onset latency for LPl (open bars) and LPm (filled bars). LPl subfield onset latencies were on average smaller than for LPm subfields (P < 0.05 Wilcoxon rank sum test). B: distribution histogram of subfield latency scatter for LPl (open bars) and LPm (filled bars). LPl subfield latency scatters were on average larger than for LPm subfields (P < 0.01 Wilcoxon rank sum test). C: pie charts showing the proportion of the different spatiotemporal profile types found in LPl (left) and LPm (right) nuclei. No statistically significant difference was found in the occurrence rate of profile types between the two nuclei.

References

    1. Abramson BP, Chalupa LM. The laminar distribution of cortical connections with the tecto- and cortico-recipient zones in the cat's lateral posterior nucleus. Neuroscience 15: 81–95, 1985. - PubMed
    1. Bender DB. Receptive-field properties of neurons in the macaque inferior pulvinar. J Neurophysiol 48: 1–17, 1982. - PubMed
    1. Bender DB. Visual activation of neurons in the primate pulvinar depends on cortex but not colliculus. Brain Res 279: 258–261, 1983. - PubMed
    1. Berson DM, Graybiel AM. Organization of the striate-recipient zone of the cats lateralis posterior-pulvinar complex and its relations with the geniculostriate system. Neuroscience 9: 337–372, 1983. - PubMed
    1. Boire D, Matteau I, Casanova C, Ptito M. Retinal projections to the lateral posterior-pulvinar complex in intact and early visual cortex lesioned cats. Exp Brain Res 159: 185–196, 2004. - PubMed

Publication types

LinkOut - more resources