. 2015 Sep 1;112(35):11036-41.
doi: 10.1073/pnas.1513359112. Epub 2015 Aug 19.

Nonmuscle myosin heavy chain IIA mediates Epstein-Barr virus infection of nasopharyngeal epithelial cells

Affiliations

Nonmuscle myosin heavy chain IIA mediates Epstein-Barr virus infection of nasopharyngeal epithelial cells

Dan Xiong et al. Proc Natl Acad Sci U S A. .

Abstract

EBV causes B lymphomas and undifferentiated nasopharyngeal carcinoma (NPC). Although the mechanisms by which EBV infects B lymphocytes have been extensively studied, investigation of the mechanisms by which EBV infects nasopharyngeal epithelial cells (NPECs) has only recently been enabled by the successful growth of B lymphoma Mo-MLV insertion region 1 homolog (BMI1)-immortalized NPECs in vitro and the discovery that neuropilin 1 expression positively affects EBV glycoprotein B (gB)-mediated infection and tyrosine kinase activations in enhancing EBV infection of BMI1-immortalized NPECs. We have now found that even though EBV infected NPECs grown as a monolayer at extremely low efficiency (<3%), close to 30% of NPECs grown as sphere-like cells (SLCs) were infected by EBV. We also identified nonmuscle myosin heavy chain IIA (NMHC-IIA) as another NPEC protein important for efficient EBV infection. EBV gH/gL specifically interacted with NMHC-IIA both in vitro and in vivo. NMHC-IIA densely aggregated on the surface of NPEC SLCs and colocalized with EBV. EBV infection of NPEC SLCs was significantly reduced by NMHC-IIA siRNA knock-down. NMHC-IIA antisera also efficiently blocked EBV infection. These data indicate that NMHC-IIA is an important factor for EBV NPEC infection.

Keywords: BMI1; Epstein–Barr virus; NMHC-IIA; gH/gL; nasopharyngeal carcinoma.


Conflict of interest statement

The authors declare no conflict of interest.

Figures
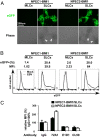
Fig. 1.
Fig. 1.
High-efficiency EBV infection using BMI1-immortalized NPECs. (A) NPEC1 or NPEC2 BMI1 cells were seeded at 5 × 10⁴ or 5 × 10⁵ into 48 well plates for 36 h. Cells at 5 × 10⁴ density grew as confluent MLCs, whereas cells at 5 × 10⁵ density formed two layers, with SLCs (white arrowheads indicated) above MLCs. SLCs were more susceptible to EBV infection, whereas MLCs were more resistant to infection. EGFP-positive cells were indicative of successful infection. (B) Percentages and MFIs of infected MLCs and SLCs after exposure to EBV-eGFP were analyzed by flow cytometry. The percentages and MFIs of the infected cells were quantified and are labeled above the histogram graph. Gray lines show mock infection, and black lines show EBV-eGFP infection. (C) SLCs originated from NPEC1 or NPEC2 BMI1 cells and were exposed to EBV-eGFP after pretreatment with 100 μg/mL mouse IgG, 72A1 (antibody to gp350), E1D1 (antibody to gH/gL), and CL59 (antibody to gH) at 4 °C for 1 h. The infected cell MFIs were measured by flow cytometry 24 h after infection. The mean value of the control IgG was normalized to 100% relative MFI. The error bars are ±SEM.
Fig. S1.
Fig. S1.
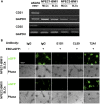
Characteristics of SLCs and gH/gL are critical to infection. (A) CD21 and CD35 mRNA expression levels in the BMI1/NPEC MLCs and SLCs were determined by RT-PCR. (B) Phase contrast and GFP fluorescence photomicrograph images of EBV-infected SLCs. SLCs were exposed to cell-free EBV-eGFP at an MOI of 300 at 37 °C for 3 h after pretreatment with 100 μg/mL antibodies, including mouse IgG, 72A1, E1D1, and CL59 at 4 °C for 1 h.
Fig. 2.
Fig. 2.
NMHC-IIA interacts with gH/gL. (A) Precipitation of the SLC lysates with myc-gH/gL (lane 1) and BSA (lane 2). The precipitates were separated by SDS/PAGE and subjected to silver staining, and myc-gH/gL was used as a control to exclude false-positive bands. The black arrows indicate the gH/gL, IgG heavy chain (HC), IgG light chain (LC), and a protein differentially pulled down by gH/gL above 170 kDa. (B) Sequence coverage (red) for the NMHC-IIA from liquid chromatography-MS analyses of the excised differential band in A. (C) Lysates of 293T cells transfected with pcep2 vector, pcep2-FLAG-gH/gL, were precipitated with FLAG-M2-antibody and FLAG-gH/gL, and endogenous NMHC-IIA was blotted with FLAG-M2 and NMHC-IIA antibodies, respectively. IB, immunoblot. (D) Equivalent amounts of soluble GST and GST-NMHC-IIA-C (amino acids 1,665–1,960) proteins were precipitated with the purified soluble myc-gH/gL. The precipitates were blotted with a myc-antibody. Coomassie blue staining showed equivalent input protein levels in each assay.
Fig. 3.
Fig. 3.
NMHC-IIA located on the SLC membrane. (A) Membrane or its associated MLC and SLC proteins were cross-linked with 3,3′-dithiobis(sulfosuccinimidyl propionate) (DTSSP) and extracted with the ProteoExtract Native Membrane Protein Extraction Kit. The presence of α-tubulin and E-cadherin indicated the cytoplasm and membrane fractions, respectively. The presence of NMHC-IIA was measured in the MLC and SLC cytoplasm and membrane fractions. cyto, cytoplasm fraction; mem, membrane fraction. (B) MLC and SLC membrane proteins were immunoprecipitated with purified myc-gH/gL, and the immunoprecipitates (IP) were blotted with NMHC-IIA and myc tag antibodies. (C) Typical 3D immunostaining image of NMHC-IIA localization in a field after SLC formation. The cells were incubated with the NMHC-IIA antibody or control IgG, followed by an AF488-conjugated secondary antibody with or without permeabilization by 0.1% Triton X-100 (TriX100) treatment. The nuclei were stained with DAPI (blue). (D) Typical 3D immunostaining image of a sphere surface for visualizing the colonization of EBV and NMHC-IIA. NPEC1-BMI1 SLCs were exposed to cell-free EBV-eGFP at 4 °C for 2 h. Then, the unbound EBV was removed by washing with prechilled PBS three times. EBV and NMHC-IIA on the surface of the SLCs were stained with 72A1 (green) and NMHC-IIA (red) antibodies without permeabilization. The nuclei were stained with DAPI (blue). b, blue, g, green, r, red.
Fig. 4.
Fig. 4.
Inhibition of endogenous NMHC-IIA reduced EBV infection of the SLCs. (A) Protein expression levels of NMHC-IIA were determined by immunoblotting 48 h after siRNA transfection. (B) Twenty-four hours after transfection, the siRNA-treated cells were reseeded into 48 well plates to form the SLCs. The SLCs were exposed to EBV-eGFP or AdV-eGFP at an MOI of 300 and 10, respectively. Then, the infected cell MFIs were determined 24 h postinfection by flow cytometry. The data are shown as mean and SEM (n = 3; two-tailed Student’s t test). The mean value of the negative control (NC)-treated SLCs was normalized to 100% relative MFI. The error bars are ±SEM. *P < 0.05; **P < 0.01. (C) EBV copy number on the NMHC-IIA siRNA-treated SLCs was detected with a Taqman probe-based qRT-PCR method. **P < 0.01; ***P < 0.001. (D) MLCs and SLCs of the BMI1-immortalized NPECs were pretreated with the indicated concentrations of polyclonal NMHC-IIA antibody or IgG for 1 h at 4 °C. Then, they were exposed to EBV-eGFP or AdV-eGFP at an MOI of 300 and 10, respectively. The infected cell MFIs were determined 24 h after infection by flow cytometry. The data are shown as mean and SEM (n = 3). The mean value in the presence of the indicated IgG concentration was normalized to 100% relative MFI. The data are shown as mean and SEM (n = 3; two-tailed Student’s t test). The error bars are ±SEM. ns, not significant. *P < 0.05; **P < 0.01.
Fig. S2.
Fig. S2.
Inhibition of endogenous NMHC-IIA by siRNA in NPECs. (A) NMHC-IIA mRNA expression was determined by qPCR after transfection with the siRNAs for 36 h. The negative control (NC) expression level was normalized to 100%. The data are shown as mean and SEM (n = 3). (B) NMHC-IIA (green) expression on the SLC surface was determined with an immunostaining method without permeabilization. The nuclei were stained with DAPI (blue). (C) Quantitative analysis of NMHC-IIA expression (green fluorescence intensity) on the SLC surface after siRNA knockdown. The quantitative expression levels of NMHC-IIA were analyzed by Olympus Fluoview version 3.1a software. Scramble siRNA control expression was set to 100%. The data shown are mean ± SEM (n = 3).
Fig. S3.
Fig. S3.
Correlation of NMHC-IIA expression and EBV infection in nasopharyngeal epithelium with atypical hyperplasia. Atypical hyperplasia sections (A, C, and E) and normal nasopharyngeal epithelium sections (B, D, and F) are shown. Sections were stained with NMHC-IIA (A and B), detected with EBV EBER probe (C and D), or stained with H&E (E and F). AF were evaluated at a magnification of 200×, and the magnification of the Insets in A and B is 400×.
Fig. S4.
Fig. S4.
EBV infection does not influence NMHC-IIA expression. NMHC-IIA protein expression was measured before and after EBV infection in SLC cells. GAPDH expression was used as an inner control.

References

    1. Cohen JI. Epstein-Barr virus infection. N Engl J Med. 2000;343(7):481–492. - PubMed
    1. Lieberman PM. Virology. Epstein-Barr virus turns 50. Science. 2014;343(6177):1323–1325. - PMC - PubMed
    1. Young LS. Epstein-Barr virus at 50-future perspectives. Chin J Cancer. 2014;33(11):527–528. - PMC - PubMed
    1. Hutt-Fletcher LM. Epstein-Barr virus entry. J Virol. 2007;81(15):7825–7832. - PMC - PubMed
    1. Tanner J, Weis J, Fearon D, Whang Y, Kieff E. Epstein-Barr virus gp350/220 binding to the B lymphocyte C3d receptor mediates adsorption, capping, and endocytosis. Cell. 1987;50(2):203–213. - PubMed

Publication types

MeSH terms

Substances