. 2015 Sep 1;112(35):10932-7.
doi: 10.1073/pnas.1513775112. Epub 2015 Aug 19.

E-cadherin junction formation involves an active kinetic nucleation process

Affiliations

E-cadherin junction formation involves an active kinetic nucleation process

Kabir H Biswas et al. Proc Natl Acad Sci U S A. .

Erratum in

Abstract

Epithelial (E)-cadherin-mediated cell-cell junctions play important roles in the development and maintenance of tissue structure in multicellular organisms. E-cadherin adhesion is thus a key element of the cellular microenvironment that provides both mechanical and biochemical signaling inputs. Here, we report in vitro reconstitution of junction-like structures between native E-cadherin in living cells and the extracellular domain of E-cadherin (E-cad-ECD) in a supported membrane. Junction formation in this hybrid live cell-supported membrane configuration requires both active processes within the living cell and a supported membrane with low E-cad-ECD mobility. The hybrid junctions recruit α-catenin and exhibit remodeled cortical actin. Observations suggest that the initial stages of junction formation in this hybrid system depend on the trans but not the cis interactions between E-cadherin molecules, and proceed via a nucleation process in which protrusion and retraction of filopodia play a key role.

Keywords: adhesion; bilayer; cadherin; diffusion; nucleation.


Conflict of interest statement

The authors declare no conflict of interest.

Figures

Fig. 1.
Fig. 1.
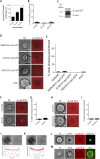
Biophysical characterization of E-cad-ECD on supported lipid bilayers. (A) Schematic representation of E-cad-ECD bound to bilayer via Ni-NTA interaction. Relative position of the fluorophore on the crystal structure of the extracellular domain of E-cadherin (PDB: 3Q2V) is also shown. (B) Fluorescently labeled E-cad-ECD was subjected to size exclusion chromatography. Inset shows Coomassie stained SDS/PAGE image of E-cad-ECD. (C) FRAP analysis of E-cad-ECD functionalized lipid bilayer. (Top) Photobleached spot that recovers after 90 s. (Bottom) Line scan of the images. (D) FCS curve fit to a standard 2D, single-component diffusion model. Diffusion coefficient D and density shown in the box were determined from Z-scan FCS analysis of multiple E-cad-ECD containing bilayers. Values represent mean ± SD (E) PCH fit of an E-cad-ECD functionalized bilayer to a two-species model. Identical brightness of the two species obtained from the PCH fit, indicated as B1 and B2, shows that E-cad-ECD is present as single oligomeric species. PCH fit of TexasRed in TexasRed-DHPE containing bilayer is shown as a control.
Fig. 2.
Fig. 2.
E-cadherin mediated cell-bilayer junction formation. (A) Schematic representation of E-cadherin-mediated hybrid cell−bilayer junction formation. (B and C) Representative time series of epifluorescence images of E-cad-ECD showing enrichment of E-cad-ECD by MKN-28 cells on either fluid (B) or partially fluid (C) bilayers. Color bars represent fold increase in E-cad-ECD surface density. (Scale bar, 5 µm.) (D) Percentage of MKN28 cells showing E-cadherin enrichment on bilayers with different properties. Values represent mean ± SD from multiple experiments. Inset is a schematic representation of bilayer fluidity in gray scale.
Fig. S1.
Fig. S1.
(A) Bright field and confocal image of MKN28 cells forming junctions in culture and stained with an antibody raised against the intracellular domain of E-cadherin. (B) Western blot analysis of lysates prepared from a confluent monolayer of MKN28 cells probed for E-cadherin, β-catenin, and α-catenin. (C) Initial binding of fluorescently labeled E-cad-ECD to glass-adsorbed, nonlabeled E-cad-ECD in the presence and absence of Ca2+, monitored by TIRF microscopy. (D) Binding of fluorescently labeled E-cad-ECD to nonlabeled E-cad-ECD adsorbed on a glass surface in the presence and absence of Ca2+. (E and F) Bright field image (E) and quantification (F) of MKN28 cells adhering to either negative control (BSA) or E-cad-ECD coated glass surface. (Scale bar, 100 μm.) (G) (Top) Western blot analysis of lysates prepared from MKN28 cells in either culture or suspension, probed with an antibody against the intracellular domain of E-cadherin. (Bottom) The same blot probed with anti-beta actin antibody. (H) Relative level of E-cadherin in lysates prepared from MKN28 cells in either culture or suspension, quantified from chemiluminescence signal using ImageJ.
Fig. S2.
Fig. S2.
(A) Molecular density of E-cad-ECD on fluid bilayers functionalized using solutions containing 30 nM, 60 nM, or 150 nM of E-cad-ECD. Values represent mean ± SD from an experiment. (B) Percentage of MKN28 cells showing E-cad-ECD enrichment on fluid bilayers functionalized with 30 nM, 60 nM, or 150 nM of E-cad-ECD. Values represent mean ± SD from multiple experiments. (C) Western blot analysis of lysates prepared from MKN28 and MKN28 cells stably expressing E-cadherin-GFP (MKN28-E-cad-GFP), showing expression of the endogenous and the GFP fusion protein. (D) Bright field and epifluorescence images of S180-Ecad-GFP, MDCK-E-cad-GFP, and MKN28 cells with E-cad-ECD functionalized fluid bilayers. (E) Percentage of different cell types showing E-cad-ECD enrichment on fluid bilayers functionalized with E-cad-ECD. Values represent mean ± SD from multiple experiments. (F) Bright field and epifluorescence images of MKN28 cells and E-cad-ECD functionalized fluid bilayers incubated in the presence and absence of serum. (G) Percentage of MKN28 cells showing E-cad-ECD enrichment on fluid bilayers functionalized with E-cad-ECD in the absence and presence of 10% serum. Values represent mean ± SD from multiple experiments. (H) Bright field and epifluorescence images of MKN28 cells and E-cad-ECD functionalized fluid bilayers incubated in control or hypotonic buffer. (I) Percentage of MKN28 cells showing E-cad-ECD enrichment on fluid bilayers functionalized with E-cad-ECD and incubated in control or hypotonic buffer. Values represent mean ± SD from multiple experiments. (All scale bars, 5 µm.) (J and K) FRAP analysis of Alexafluor568-labeled E-cad-ECD and either EphrinA1-EYFP (J) or RGD (K) functionalized bilayers prepared with DOPC as the base lipid and either 4 mole % Ni-NTA-DOGS or 3.8 mole % Ni-NTA-DOGS and 0.2 mole % biotinyl-Cap-PE. (L) Bright field, RICM, epifluorescence, and TIRF images of MCF-10A cells forming junction on fluid bilayers functionalized with E-cad-ECD and EphrinA1-EYFP. (M) Bright field, RICM, and epifluorescence images of MCF-10A cells forming junction on fluid bilayers functionalized with E-cad-ECD and RGD. (Scale bar, 5 μm.)
Fig. S3.
Fig. S3.
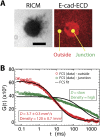
Junction formation results in a reduction in diffusion of E-cad-ECD. (A) RICM and epifluorescence image of a hybrid junction formed between a live cell and E-cad-ECD functionalized fluid bilayer. (B) FCS curve fit to a standard 2D, single-component diffusion model of spots outside and inside the hybrid junction indicated in A. Note that the intensity fluctuation of E-cad-ECD inside the junction could not be fit to a simple, single-component model indicating the presence of clusters that do not show random Brownian diffusion. (Scale bar, 5 µm.)
Fig. S4.
Fig. S4.
FRAP analysis of partially fluid E-cad-ECD functionalized bilayer. (Top) Recovery of fluorescence intensity of labeled E-cad-ECD (A) and NBD-PC (B) and (Bottom) corresponding line scans of the images. Diffusion coefficient of NBD-PC was estimated to be 0.04 μm2/s. Diffusion coefficient of E-cad-ECD could not be estimated due very low recovery of fluorescence intensity.
Fig. S5.
Fig. S5.
FRAP analysis of Alexafluor568-labeled E-cad-ECD functionalized bilayers prepared with DPPC as the base lipid and 30 mole % DOPC (A), 20 mole % DOPC (B), 10 mole % DOPC (C), 1 mole % NBD-PC (D), and 5 mole % NBD-PC (E). All bilayers contained 4 mole % Ni-NTA-DOGS lipid for anchoring the protein. (Top) The photobleached spots at 0-min and 4-min time periods, and (Bottom) line scans of the images at the indicated position (yellow line in Top). (F) MKN28 cells were seeded on bilayers with different lipid compositions, and then the cells showing enrichment of E-cadherin were counted to determine their percentage.
Fig. 3.
Fig. 3.
Characterization of hybrid cell−bilayer junctions. (A) Bright field images of MKN28 cells seeded on partially fluid bilayers functionalized with E-cad-ECD in the presence or absence of Ca2+ and epifluorescence images of E-cad-ECD on bilayers showing the formation or lack of a junction. (B) Percentage of MKN28 cells showing E-cad-ECD enrichment on partially fluid bilayers in the presence or absence of Ca2+. Values represent mean ± SD from multiple experiments. (Scale bar, 5 μm.) (CE) MKN-28 cells forming junctions on partially fluid bilayers were either immunostained for cellular E-cadherin using an antibody raised against the intracellular part of E-cadherin (C) and an antibody against α-catenin (D) or stained with phalloidin (E). Cellular E-cadherin and α-catenin colocalize with E-cad-ECD molecules on bilayer whereas F-actin is remodeled to form a ring around the hybrid junction. (Scale bar, 5 µm.)
Fig. S6.
Fig. S6.
(A) Bright field and epifluorescence images of MKN28 cells seeded on DPPC bilayers incubated at the indicated temperatures. (B) Percentage of MKN28 cells showing E-cad-ECD enrichment on DPPC bilayers incubated at the indicated temperatures. Values represent mean ± SD. (Scale bar, 5 μm.) (C) MKN-28 cells forming junctions on fluid bilayers were either immunostained with an antibody against α-catenin or stained with phalloidin. Cellular α-catenin colocalize with E-cad-ECD molecules on the bilayer whereas F-actin is remodeled to form a ring around the hybrid junction. (Scale bar, 5 µm.) (D) Bright field and RICM images of MKN28 cells, on partially fluid bilayers with E-cad-ECD, with and without ML 141 treatment. (Scale bar, 5 µm.) (E) Bright field images of A-431D cells expressing wild-type, cis-mutant, or intracellular domain-deleted E-cadherin, seeded on partially fluid bilayers functionalized with wild-type, cis-mutant, or wild-type E-cad-ECD, respectively, and epifluorescence images of fluorescently labeled protein showing formation of junction. (Scale bar, 5 μm.) (F) Bright field images of MKN28 cells expressing E-cadherin fused to the actin-binding domain of α-catenin, seeded on either a fluid or partially fluid bilayer, and epifluorescence images of E-cad-ECD showing formation of junction. (G) Bright field and epifluorescence images of an MKN28 cell with the E-cadherin-α-catenin actin-binding domain fusion protein forming a junction with E-cad-ECD on a partially fluid bilayer. (Scale bar, 10 μm.)
Fig. 4.
Fig. 4.
E-cadherin clustering and junction formation is an actomyosin-dependent process. (A) Epifluorescence and RICM imaging of the cell shown in Fig. 2C revealing a tight contact with the bilayer around the zone of E-cad-ECD enrichment. Zoomed-in view of a retracting filopodia shows clustering of E-cad-ECD molecules. A trace of the retracting filopodia is overlapped on the epifluorescence image of E-cad-ECD on the bilayer. Numbers indicate time in minutes, with initial time assumed to be t. (B) Percentage of MKN28 cells, either untreated or treated with ML 141, calyculin A, blebbistatin, or a combination of antimycin A and 2’-deoxy glucose, showing enrichment of E-cad-ECD on partially fluid bilayers. Values represent mean ± SD from multiple experiments. (Scale bar, 5 µm.)
Fig. 5.
Fig. 5.
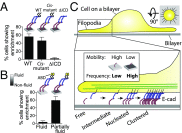
Mechanism of E-cadherin junction formation. (A, Bottom) Percentage of A-431D cells expressing wild-type, cis-mutant, or intracellular domain-deleted E-cadherin showing enrichment of fluorescently labeled E-cad-ECD on partially fluid bilayers functionalized with wild-type, cis-mutant, or wild-type E-cad-ECD, respectively. (Top) Schematic representation of junction formation by wild-type, cis-mutant, or intracellular domain-deleted E-cadherin on partially fluid bilayers. (B, Bottom) Percentage of MKN28 cells expressing E-cadherin fused with the actin-binding domain of α-catenin showing E-cad-ECD enrichment on fluid or partially fluid bilayers functionalized with the wild-type E-cad-ECD. (Top) Schematic representation of junction formation by E-cadherin fused to the actin-binding domain of α-catenin on fluid and partially fluid bilayers. Values represent mean ± SD from multiple experiments. (Scale bar, 5 μm.) (C) Schematic representation of E-cadherin junction formation on a supported lipid bilayer involving filopodia retraction-mediated local increase in E-cad-ECD concentration.

References

    1. Chen CS, Mrksich M, Huang S, Whitesides GM, Ingber DE. Geometric control of cell life and death. Science. 1997;276(5317):1425–1428. - PubMed
    1. Boudreau N, Sympson CJ, Werb Z, Bissell MJ. Suppression of ICE and apoptosis in mammary epithelial cells by extracellular matrix. Science. 1995;267(5199):891–893. - PMC - PubMed
    1. Nelson CM, Vanduijn MM, Inman JL, Fletcher DA, Bissell MJ. Tissue geometry determines sites of mammary branching morphogenesis in organotypic cultures. Science. 2006;314(5797):298–300. - PMC - PubMed
    1. Engler AJ, Sen S, Sweeney HL, Discher DE. Matrix elasticity directs stem cell lineage specification. Cell. 2006;126(4):677–689. - PubMed
    1. Levental KR, et al. Matrix crosslinking forces tumor progression by enhancing integrin signaling. Cell. 2009;139(5):891–906. - PMC - PubMed

Publication types