. 2014 Nov 27:56:26.
doi: 10.1186/2055-0391-56-26. eCollection 2014.

Capacitation and acrosome reaction differences of bovine, mouse and porcine spermatozoa in responsiveness to estrogenic compounds

Affiliations

Capacitation and acrosome reaction differences of bovine, mouse and porcine spermatozoa in responsiveness to estrogenic compounds

Do-Yeal Ryu et al. J Anim Sci Technol. .

Abstract

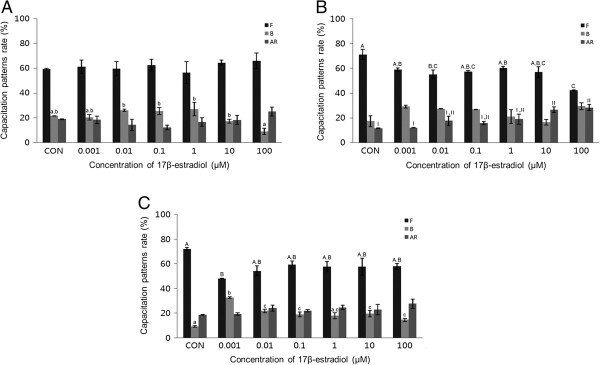
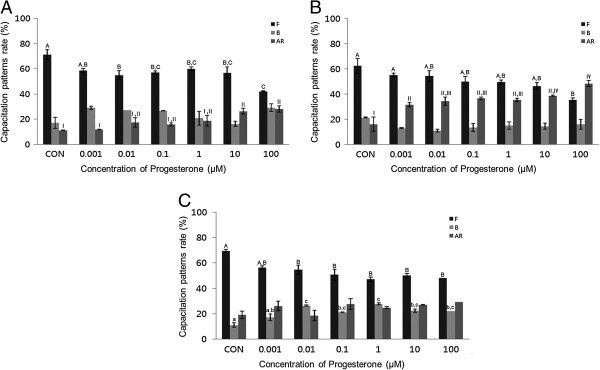
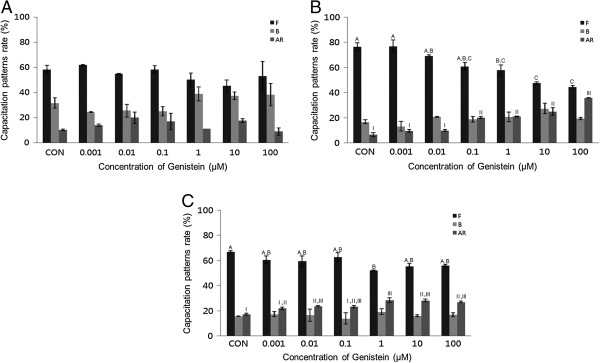
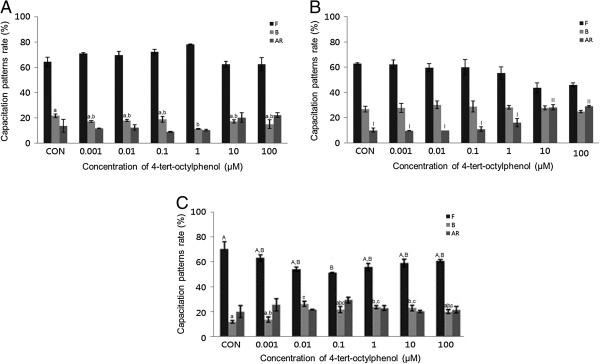
Background: Endocrine disruptors are exogenous substance, interfere with the endocrine system, and disrupt hormonal functions. However, the effect of endocrine disruptors in different species has not yet been elucidated. Therefore, we investigated the possible effects of 17ß-estradiol (E2), progesterone (P4), genistein (GEN) and 4-tert-octylphenol (OP), on capacitation and the acrosome reaction in bovine, mouse, and porcine spermatozoa. In this in vitro trial, spermatozoa were incubated with 0.001-100 μM of each chemical either 15 or 30 min and then assessed capacitation status using chlortetracycline staining.

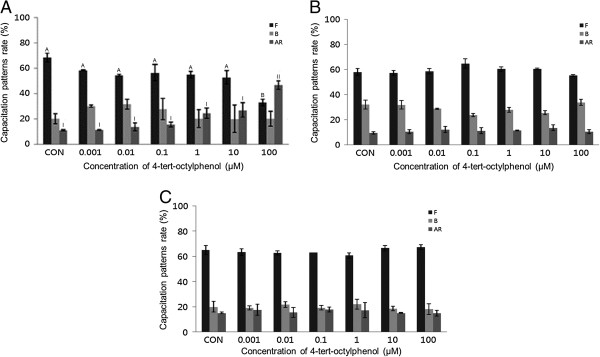
Results: E2 significantly increased capacitation and the acrosome reaction after 30 min, while the acrosome reaction after 15 min incubation in mouse spermatozoa. Simultaneously, capacitation and the acrosome reaction were induced after 15 and 30 min incubation in porcine spermatozoa, respectively. Capacitation was increased in porcine spermatozoa after 15 min incubation at the lowest concentration, while the acrosome reaction was increased in mouse spermatozoa after 30 min (P <0.05). E2 significantly increased the acrosome reaction in porcine spermatozoa, but only at the highest concentration examined (P <0.05). P4 significantly increased the acrosome reaction in bovine and mouse spermatozoa treated for 15 min (P <0.05). The same treatment significantly increased capacitation in porcine spermatozoa (P <0.05). P4 significantly increased capacitation in mouse spermatozoa treated for 30 min (P <0.05). GEN significantly increased the acrosome reaction in porcine spermatozoa treated for 15 and 30 min and in mouse spermatozoa treated for 30 min (P <0.05). OP significantly increased the acrosome reaction in mouse spermatozoa after 15 min (P <0.05). Besides, when spermatozoa were incubated for 30 min, capacitation and the acrosome reaction were higher than 15 min incubation in E2 or GEN. Furthermore, the responsiveness of bovine, mouse and porcine spermatozoa to each chemical differed.

Conclusions: In conclusion, all chemicals studied effectively increased capacitation and the acrosome reaction in bovine, mouse, and porcine spermatozoa. Also we found that both E2 and P4 were more potent than environmental estrogens in altering sperm function. Porcine and mouse spermatozoa were more responsive than bovine spermatozoa.

Keywords: Acrosome reaction; Capacitation; Endocrine disruptor; Estrogen; Spermatozoa.


Figures

Figure 1
Figure 1
Effects of 15 min of incubation with 17β-estradiol (E2) on capacitation status. (A) Change of sperm capacitation status of bovine spermatozoa in the absence or presence of E2 (0.001 to 100 μM). (B) Change of sperm capacitation status of mouse spermatozoa in the absence or presence of E2 (0.001 to 100 μM). (C) Change of sperm capacitation status of porcine spermatozoa under in the absence or presence of E2 (0.001 to 100 μM). Capacitation status was distinguished F, B and AR pattern (Black Bar: F pattern, Grey Bar: B pattern, Dark-grey Bar: AR pattern). Data represent mean ± SEM, n =3. A, B, C Values with different superscripts were significantly different compared to control and the F pattern group, by ANOVA (P <0.05). a, b, c Values with different superscripts were significantly different compared to control and the B pattern group, by ANOVA (P <0.05). I, II Values with different superscripts were significantly different compared to control and the AR pattern group, by ANOVA (P <0.05).
Figure 2
Figure 2
Effects of 30 min of incubation with 17β-estradiol (E2) on capacitation status. (A) Change of sperm capacitation status of bovine spermatozoa in the absence or presence of E2 (0.001 to 100 μM). (B) Change of sperm capacitation status of mouse spermatozoa in the absence or presence of E2 (0.001 to 100 μM). (C) Change of sperm capacitation status of porcine spermatozoa in the absence or presence of E2 (0.001 to 100 μM). Capacitation status was distinguished F, B and AR pattern (Black Bar: F pattern, Grey Bar: B pattern, Dark-grey Bar: AR pattern). Data represent mean ± SEM, n =3. A, B, C Values with different superscripts were significantly different compared to control and the F pattern group, by ANOVA (P <0.05). a, b, c Values with different superscripts were significantly different compared to control and the B pattern group, by ANOVA (P <0.05). I, II, III, IV Values with different superscripts were significantly different compared to control and the AR pattern group, by ANOVA (P <0.05).
Figure 3
Figure 3
Effects of 15 min of incubation with progesterone (P4) on capacitation status. (A) Change of sperm capacitation status of bovine spermatozoa in the absence or presence of P4 (0.001 to 100 μM). (B) Change of sperm capacitation status of mouse spermatozoa in the absence or presence of P4 (0.001 to 100 μM). (C) Change of sperm capacitation status of porcine spermatozoa in the absence or presence of P4 (0.001 to 100 μM). Capacitation status was distinguished F, B and AR pattern (Black Bar: F pattern, Grey Bar: B pattern, Dark-grey Bar: AR pattern). Data represent mean ± SEM, n =3. A, B, C Values with different superscripts were significantly different compared to control and the F pattern group, by ANOVA (P <0.05). a, b, c Values with different superscripts were significantly different compared to control and the B pattern group, by ANOVA (P <0.05). I, II, III, IV Values with different superscripts were significantly different compared to control and the AR pattern group, by ANOVA (P <0.05).
Figure 4
Figure 4
Effects of 30 min of incubation with progesterone (P4) on capacitation status. (A) Change of sperm capacitation status of bovine spermatozoa in the absence or presence of P4 (0.001 to 100 μM). (B) Change of sperm capacitation status of mouse spermatozoa in the absence or presence of P4 (0.001 to 100 μM). (C) Change of sperm capacitation status of porcine spermatozoa in the absence or presence of P4 (0.001 to 100 μM). Capacitation status was distinguished F, B and AR pattern (Black Bar: F pattern, Grey Bar: B pattern, Dark-grey Bar: AR pattern). Data represent mean ± SEM, n =3. A, B, C Values with different superscripts were significantly different compared to control and the F pattern group, by ANOVA (P <0.05). a, b, c Values with different superscripts were significantly different compared to control and the B pattern group, by ANOVA (P <0.05). I, II Values with different superscripts were significantly different compared to control and the AR pattern group, by ANOVA (P <0.05).
Figure 5
Figure 5
Effects of 15 min of incubation with genistein (GEN) on capacitation status. (A) Change of sperm capacitation status of bovine spermatozoa in the absence or presence of GEN (0.001 to 100 μM). (B) Change of sperm capacitation status of mouse spermatozoa in the absence or presence of GEN (0.001 to 100 μM). (C) Change of sperm capacitation status of porcine spermatozoa in the absence or presence of GEN (0.001 to 100 μM). Capacitation status was distinguished F, B and AR pattern (Black Bar: F pattern, Grey Bar: B pattern, Dark-grey Bar: AR pattern). Data represent mean ± SEM, n =3. A, B Values with different superscripts were significantly different compared to control and the F pattern group, by ANOVA (P <0.05). a, b Values with different superscripts were significantly different compared to control and the B pattern group, by ANOVA (P <0.05). I, II Values with different superscripts were significantly different compared to control and the AR pattern group, by ANOVA (P <0.05).
Figure 6
Figure 6
Effects of 30 min of incubation with genistein (GEN) on capacitation status. (A) Change of sperm capacitation status of bovine spermatozoa in the absence or presence of GEN (0.001 to 100 μM). (B) Change of sperm capacitation status of mouse spermatozoa in the absence or presence of GEN (0.001 to 100 μM). (C) Change of sperm capacitation status of porcine spermatozoa in the absence or presence of GEN (0.001 to 100 μM). Capacitation status was distinguished F, B and AR pattern (Black Bar: F pattern, Grey Bar: B pattern, Dark-grey Bar: AR pattern). Data represent mean ± SEM, n =3. A, B, C Values with different superscripts were significantly different compared to control and the F pattern group, by ANOVA (P <0.05). I, II, III Values with different superscripts were significantly different compared to control and the AR pattern group, by ANOVA (P <0.05).
Figure 7
Figure 7
Effects of 15 min of incubation with 4-tert-octylphenol (OP) on capacitation status. (A) Change of sperm capacitation status of bovine spermatozoa in the absence or presence of OP (0.001 to 100 μM). (B) Change of sperm capacitation status of mouse spermatozoa in the absence or presence of OP (0.001 to 100 μM). (C) Change of sperm capacitation status of porcine spermatozoa in the absence or presence of OP (0.001 to 100 μM). Capacitation status was distinguished F, B and AR pattern (Black Bar: F pattern, Grey Bar: B pattern, Dark-grey Bar: AR pattern). Data represent mean ± SEM, n =3. A, B Values with different superscripts were significantly different compared to control and the F pattern group, by ANOVA (P <0.05). a, b, c Values with different superscripts were significantly different compared to control and the B pattern group, by ANOVA (P <0.05). I, II Values with different superscripts were significantly different compared to control and the AR pattern group, by ANOVA (P <0.05).
Figure 8
Figure 8
Effects of 15 min of incubation with 4-tert-octylphenol (OP) on capacitation status. (A) Change of sperm capacitation status of bovine spermatozoa in the absence or presence of OP (0.001 to 100 μM). (B) Change of sperm capacitation status of mouse spermatozoa in the absence or presence of OP (0.001 to 100 μM). (C) Change of sperm capacitation status of porcine spermatozoa in the absence or presence of OP (0.001 to 100 μM). Capacitation status was distinguished F, B and AR pattern (Black Bar: F pattern, Grey Bar: B pattern, Dark-grey Bar: AR pattern). Data represent mean ± SEM, n =3. A, B Values with different superscripts were significantly different compared to control and the F pattern group, by ANOVA (P <0.05). I, II Values with different superscripts were significantly different compared to control and the AR pattern group, by ANOVA (P <0.05).

References

    1. Stormshak F, Bishop CV. Estrogen and progesterone signaling: genomic and nongenomic actions in domestic ruminants. J Anim Sci. 2008;86:299–315. doi: 10.2527/jas.2007-0489. - DOI - PubMed
    1. Luconi M, Muratori M, Forti G, Baldi E. Identification and characterization of a novel functional estrogen receptor on human sperm membrane that interferes with progesterone effects. J Clin Endocrinol Metab. 1999;84:1670–1678. doi: 10.1210/jcem.84.5.5670. - DOI - PubMed
    1. Couse JF, Korach KS. Estrogen receptor null mice: what have we learned and where will they lead us? Endocr Rev. 1999;20:358–417. doi: 10.1210/edrv.20.3.0370. - DOI - PubMed
    1. Sharpe RM. Hormones and testis development and the possible adverse effects of environmental chemicals. Toxicol Lett. 2001;120:221–232. doi: 10.1016/S0378-4274(01)00298-3. - DOI - PubMed
    1. Skakkebaek NE, Rajpert-De Meyts E, Main KM. Testicular dysgenesis syndrome: an increasingly common developmental disorder with environmental aspects. Hum Reprod. 2001;16:972–978. doi: 10.1093/humrep/16.5.972. - DOI - PubMed