. 2015 Aug 19;87(4):733-50.
doi: 10.1016/j.neuron.2015.07.031.

Regulatory Logic of Pan-Neuronal Gene Expression in C. elegans

Affiliations

Regulatory Logic of Pan-Neuronal Gene Expression in C. elegans

Nikolaos Stefanakis et al. Neuron. .

Abstract

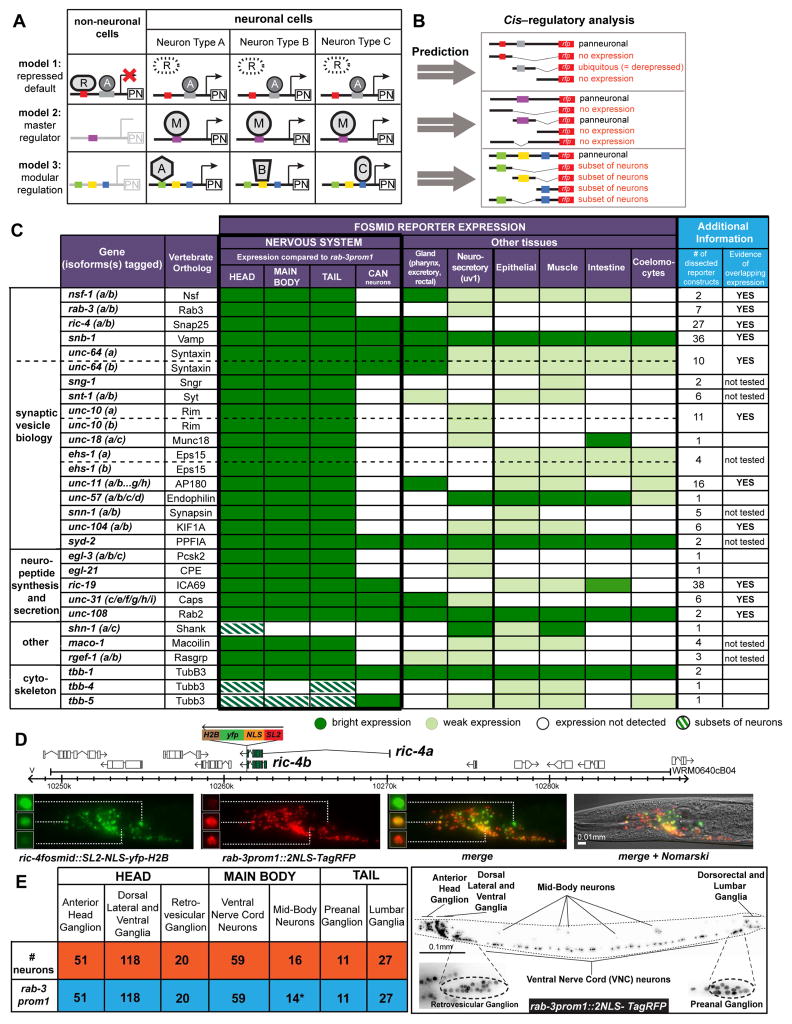
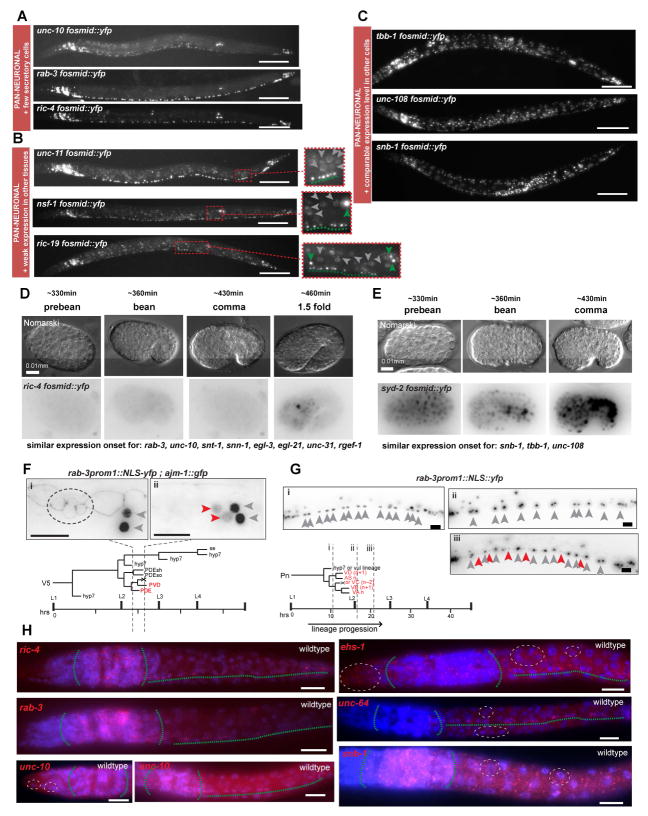
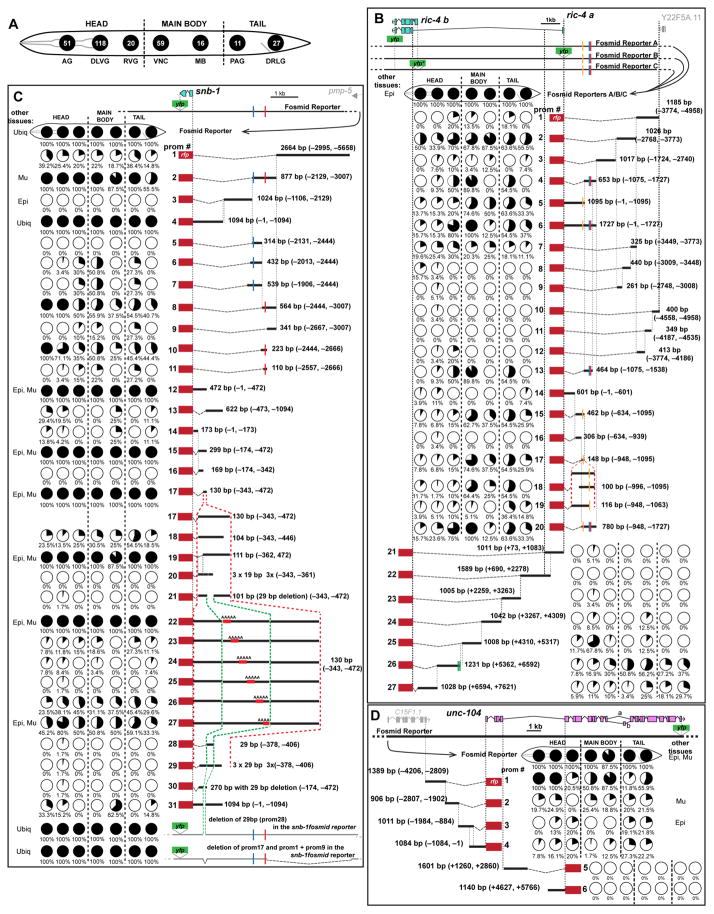
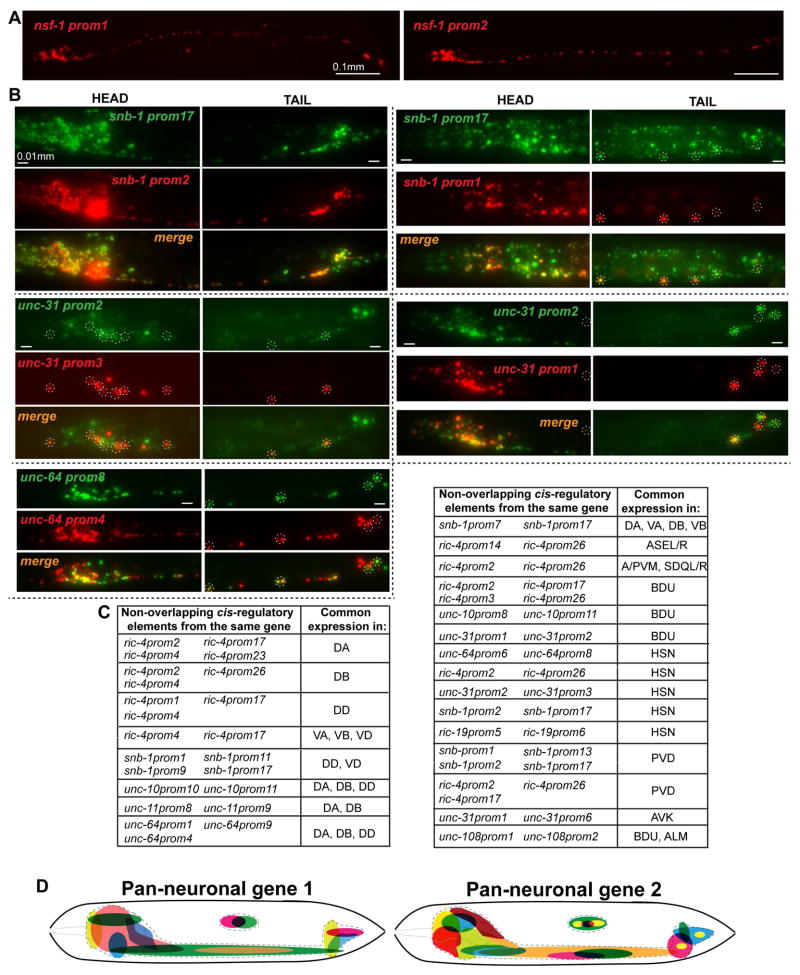
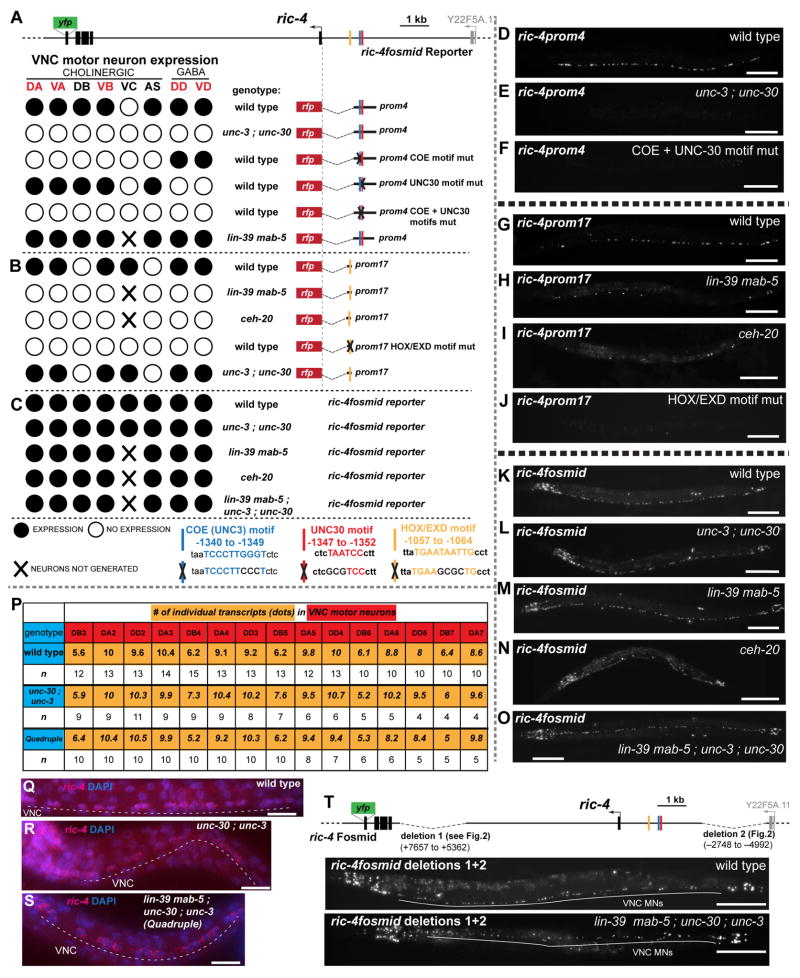
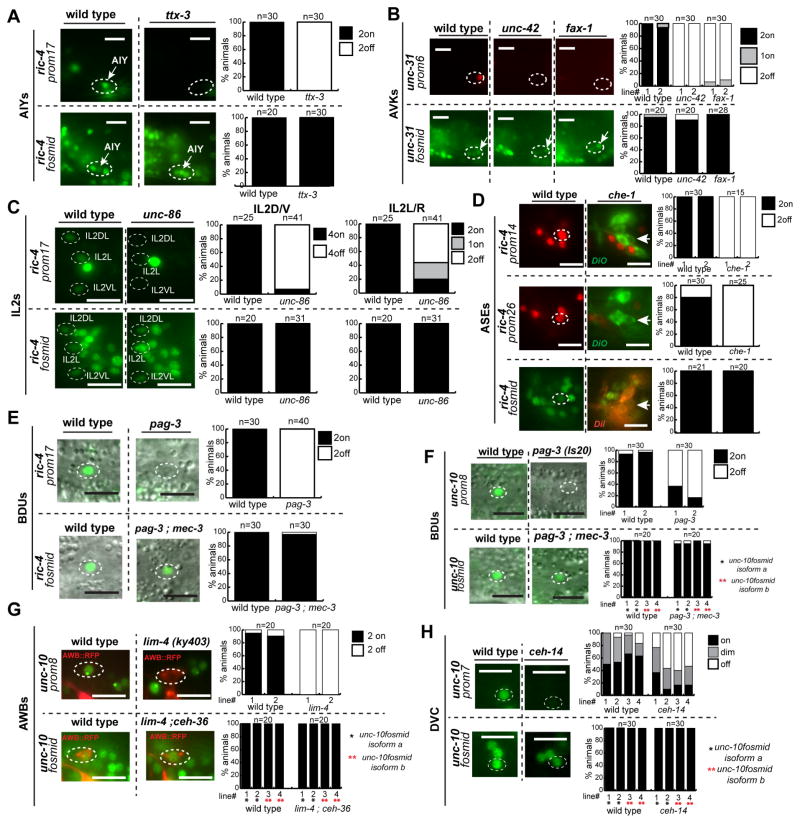
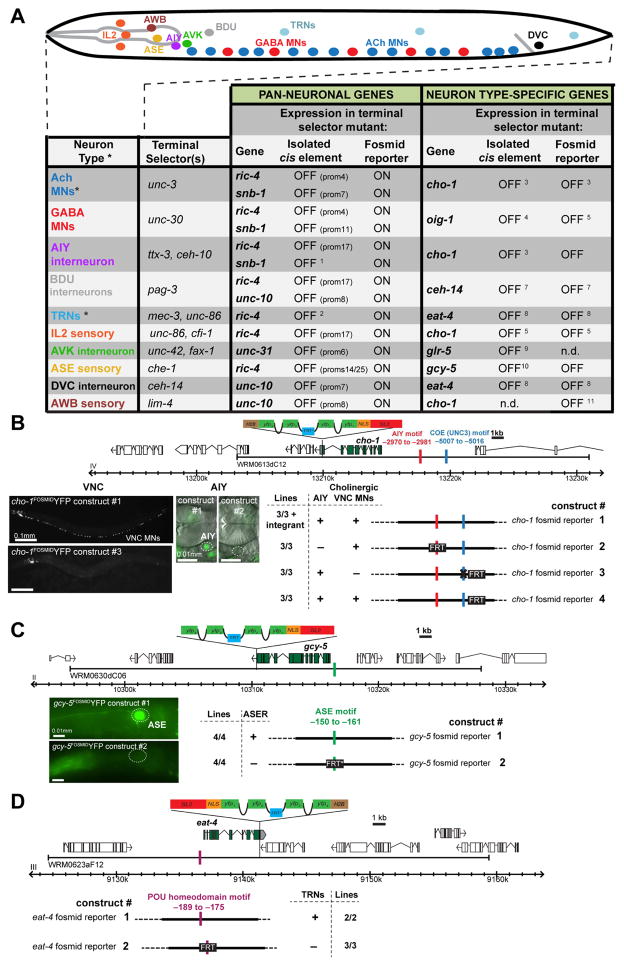
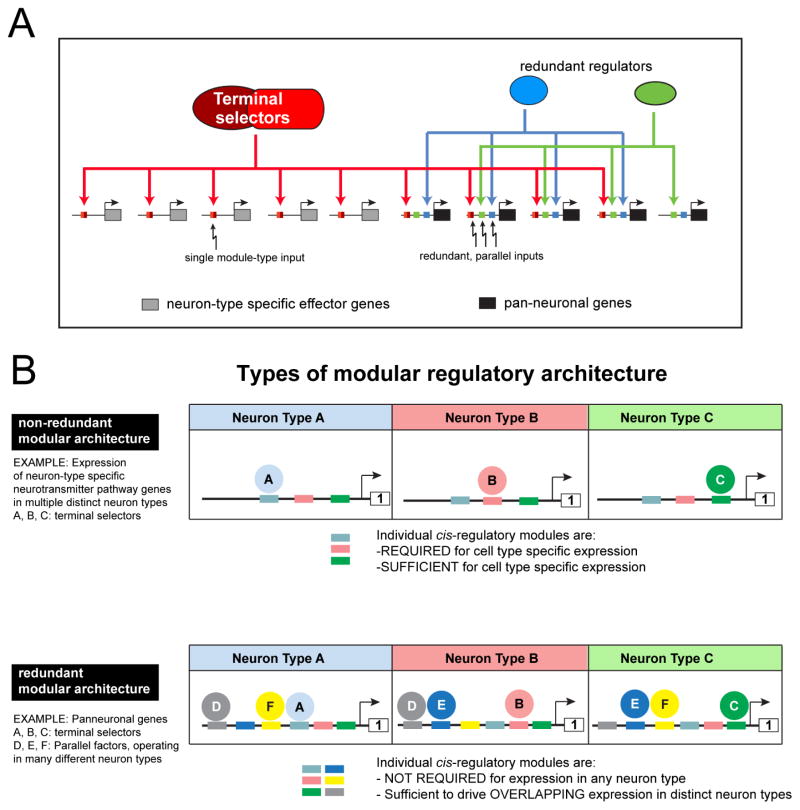
While neuronal cell types display an astounding degree of phenotypic diversity, most if not all neuron types share a core panel of terminal features. However, little is known about how pan-neuronal expression patterns are genetically programmed. Through an extensive analysis of the cis-regulatory control regions of a battery of pan-neuronal C. elegans genes, including genes involved in synaptic vesicle biology and neuropeptide signaling, we define a common organizational principle in the regulation of pan-neuronal genes in the form of a surprisingly complex array of seemingly redundant, parallel-acting cis-regulatory modules that direct expression to broad, overlapping domains throughout the nervous system. These parallel-acting cis-regulatory modules are responsive to a multitude of distinct trans-acting factors. Neuronal gene expression programs therefore fall into two fundamentally distinct classes. Neuron-type-specific genes are generally controlled by discrete and non-redundantly acting regulatory inputs, while pan-neuronal gene expression is controlled by diverse, coincident and seemingly redundant regulatory inputs.


Figures

Fig. 1
Fig. 1. Probing Pan-neuronal Gene Expression in C. elegans
A: Schematic representation of 3 possible models for regulation of pan-neuronal gene expression. PN = pan-neuronal gene, R = non-neuronal repressor, A = activator, M = master regulator, A,B,C = different transcription factors in different neuron types. B: Different possible outcomes of our cis-regulatory analysis based on the three predicted models in panel A. C: Summary of the expression patterns of the fosmid reporters of the 26 genes under study. For genes that have isoforms with alternative 3′ ends, more than one fosmid reporter was made to tag these different isoforms. 23 genes (all except for shn-1, tbb-4 and tbb-5) are expressed in a pan-neuronal manner, as compared to rab-3prom1 pan-neuronal expression. The two columns on the right summarize additional reporter constructs made for each gene in this study and whether these additional reporter constructs provided evidence of overlapping expression, meaning more than one element show expression in the same domains. Expression of the unc-10fosmid reporter can also be observed in very few cells in the very anterior head part of C. elegans (supported by smFISH in Fig. 2H). D: Schematic representation of the ric-4 fosmid reporter (top) and expression of ric-4 fosmid reporter in the head neurons (bottom). Fosmid reporter expression patterns (YFP) are always scored in comparison to the reference rab-3prom1 reporter (RFP). Expression intensity varies in distinct neurons also in comparison to the rab-3 expression. Three representative examples are shown: the neuron shown on top expresses high YFP but low RFP levels. The neuron in the middle has equal levels of expression of YFP and RFP. The neuron at the bottom has low YFP but high RFP expression levels. Schematic representation of all fosmid reporters and fluorescent worm images for each reporter are shown in supplemental Fig. S1A, B and expression intensity variability for snb-1 and unc-31 fosmids in supplemental Fig. S1C and Fig. S1D respectively. E: The 302 neurons of the adult hermaphrodite C. elegans (orange) are distributed in different ganglia in the head, main body and tail of the worm (see Table S2 for list of these neurons). The rab-3prom1 transcriptional reporter (schematically shown in Fig. S3) is expressed in all neurons (blue) except for the CAN (*) mid-body neuronal pair. Right panel: Expression pattern of the rab-3prom1 reporter transgene in the different ganglia. Lateral view where anterior is to the left and ventral is down. Scale bar for E is 0.1 mm.
Fig. 2
Fig. 2. Different Categories of Pan-neuronal Genes
Pan-neuronal genes can be grouped in three categories based on their expression in non-neuronal cells (panels A – C). A: Expression in all neurons and only few non-neuronal secretory cells. B: Expression in all neurons and weaker expression in other tissues. Expanded boxes show better the difference in levels between neurons and non-neuronal cells. Green arrowheads indicate neurons, dashed greens line underlines ventral nerve cord motorneurons (VNC MNs) and grey arrowheads indicate non-neuronal cells. C: Expression in all neurons and equally bright expression in all other tissues. Fluorescent images of L4/young adult worms of selected fosmid reporter for each category are shown. For description of spatial expression patterns of all fosmid reporters see Fig. 1C. Temporal onset of expression of pan-neuronal genes differs between genes that belong in different categories (panels D – G). D: Embryonic expression onset of the fosmid reporter of ric-4, a pan-neuronal gene that is more restricted to the nervous system. Expression at first is detected at the comma stage, when all neurons have already been born. Other pan-neuronal genes that are also mainly nervous system restricted (listed below) have similar temporal expression pattern. E: Embryonic onset of expression of the fosmid reporter of syd-2, a pan-neuronal gene that is expressed broadly in non-neuronal cell types. Broad expression is detected in very early embryonic stages when neurons are not yet born. Other pan-neuronal genes that are also expressed broadly outside the nervous system (listed below) have similar temporal expression pattern. F – G: Onset of expression of the neuronal restricted rab-3 in post-embryonically born neurons. In F, the V5 postembryonic lineage gives rise to two neurons, PDE and PVD, two glial cells and epidermal cells. rab-3prom1::2xNLS-yfp expression is detected only in mature postmitotic PDE and PVD neurons (ii), but not at an earlier stage in the “young” postmitotic PDE neuron and the PVD progenitor (i). Also in ii, the YFP expression levels in PDE and PVD (red arrowheads) are lower in comparison to neighboring neurons SDQL and PVM (grey arrowheads) that are born in the embryo. In later larval and adult stages PDE and PVD expression of rab-3prom1 is similar to the expression in SDQL and PVM. ajm-1::gfp is an apical junction marker that is used to follow the different stages of progression of the V5 lineage. In (i) the dashed circle indicates the ajm-1::gfp expression in 4 cells at the corresponding stage (i) indicated in the lineage diagram. One of these 4 cells is the “young” PDE neuron. In G, the Pn postembryonic lineage gives rise to different VNC MN types. Expression of rab-3prom1::2xNLS-yfp is not detected in the neural progenitors (i), or even at a stage when the neurons have just been born (ii). YFP expression in the postembryonic VNC MNs (read arrowheads) is detected only at a later stage (iii) and is initially weaker in comparison to YFP expression of the embryonically born VNC neurons (grey arrowheads). In later larval stages and adult worms all VNC neurons have more similar rab-3prom1::2xNLS-yfp expression levels. In F and G, grey arrows indicate embryonic neurons and red arrows indicate postembryonic neurons. H: Single molecule in situ hybridization (smFISH) verifies expression patterns of selected pan-neuronal genes. C. elegans larvae were fixed and hybridized at the L1 stage. In red the labeled smFISH probes and in blue is DAPI staining. smFISH for ric-4, rab-3 and unc-10 (left column) shows neuronally restricted fluorescent signals. smFISH for unc-10 recapitulates the unc-10 fosmid reporter expression in just a few cells in the tip of the head (dashed white circle). smFISH for ehs-1, unc-64 and snb-1 shows more broad staining in cells outside the nervous system corroborating the fosmid reporter results. Green dashed lines outline nervous system (head ganglia and VNC). White dashed-line circles outline examples of expression in non-neuronal cells. Scale bars are 0.1 mm in A – C and 0.01 mm in D – H.
Fig. 3
Fig. 3. Modular Architecture of Cis-Regulatory Regions of Pan-neuronal Genes
A: Schematic representation of the nervous system of C. elegans. Neurons belonging in the different ganglia or regions, also shown in Fig. 1E, are clustered together and represented by a black circle (numbers of neurons belonging in each ganglion are indicated inside the circle). In the ensuing panels the fraction of neurons of each ganglion expressing a reporter is indicated with a partially filled circle (pie-chart). AG = anterior head ganglion, DLVG = dorsal, lateral and ventral head ganglia, RVG = retrovesicular ganglion, VNC = ventral nerve cord motor neurons, MB = mid-body neurons, PAG = preanal ganglion, DRLG = dorsorectal and lumbar ganglia. B – D: Dissection analysis of cis-regulatory regions of the ric-4, snb-1 and unc-104 loci. Schematics of the fosmid reporters are shown below gene schematics (YFP = pBALU23, YFP* = pBALUNI). The expression of each reporter construct is presented in the form of pie-charts that show % of neurons expressing in each of these different ganglia. For example, ric-4prom1 drives expression in 4 out of the 20 neurons of the Retrovesicular Ganglion (RVG, that this represented by the third circle, as shown in panel A), which translates into 20% of the neurons of the RVG. For each of these reporter constructs, 3 independent transgenic lines are scored (≥10 worms scored for each line); very little variation is observed across the three different lines. The % shown is an average of the average number of neurons for each line. The length in base pairs (bp) and the coordinates of each promoter fragment in relation to the translational start site are shown next to each construct. Expression in other tissues: ubiq = ubiquitous, Epi = epidermis, Mu = muscle, Int = intestine, Cc = coelomocytes. Functional binding motifs are shown as vertical colored lines: blue = COE (binding motif for unc-3) motif, red = UNC-30 motif, yellow = HOX/EXD motif, green = ASE motif (binding motif for che-1). Cis-regulatory analysis for all the other genes is shown in supplemental Fig. S2, Fig. S3 and Fig S4.
Fig. 4
Fig. 4. Modular Elements Contain Redundant Cis-Regulatory Information
Overlapping expression can be evidenced in different ways. In panel A, nsf-1prom1 and nsf-1prom2 drive expression in >85% of the C. elegans nervous system and they obviously have overlapping expression in most of C. elegans neurons. In panel B, overlapping expression is directly visualized. In this case the non-overlapping fragments are tagged with fluorescent proteins of different colors and when subsequently crossed together they reveal neurons with overlapping expression (seen as orange/yellow neurons in the merge, also specific cases are outlined with dashed line circles). Finally in panel C, we identified specific neuron types (right column) in which there is overlapping expression from non-overlapping fragments of the same locus (left column). The temporal expression pattern of two elements from the ric-4 locus, ric-4prom4 and ric-4prom17, with overlapping expression in many VNC MNs also appears to be indistinguishable between the two (data is shown in supplemental Fig. S5A). D: Schematic summary of the redundant modular expression of pan-neuronal genes. Distinct cis-regulatory elements drive overlapping expression in different domains (colored) of the C. elegans nervous system (outlined with dashed line). Scale bars are 0.01 mm in A and 0.01 mm in B.
Fig. 5
Fig. 5. Terminal selectors act in parallel to HOX Genes to regulate VNC MN expression
A – C: ric-4 reporter gene expression in various genetic backgrounds. In a wild-type background, both ric-4prom4 and ric-4prom17 drive overlapping expression in VNC MNs. The terminal selectors unc-3 and unc-30 directly control ric-4prom4 expression in the cholinergic and GABAergic VNC MNs respectively (panel A; see also Fig. S6B, C), while ric-4prom4 expression does not depend on HOX genes. ric-4prom17 expression in the VNC MNs depends on HOX genes (lin-39, mab-5) and the HOX cofactor ceh-20, and is independent of unc-3 and unc-30 (B). In all panels, the reporter transgene (otIs490 for ric-4prom4, otIs414 for ric-4prom17 and otIs353 for ric-4fosmid) was crossed into the respective mutant background. ric-4 fosmid reporter (schematic shown again on top) VNC expression is unaffected in the unc-3 ; unc-30 mutants, HOX mutants and in the quadruple mutant background (C). VC neurons are not generated in HOX mutants. Additional data and quantification are provided in supplemental Fig. S6. D – O: Fluorescent worm images of the data shown in panel A–C. Animals are shown in late L4 larval or young adult stages. P – S: Detection of endogenous ric-4 transcripts show no changes in expression levels of ric-4 among wildtype, unc-30 ; unc-3 and quadruple mutant backgrounds. P: The average number of transcripts (yellow) for each embryonic VNC MN (red), in the three different genetic backgrounds (blue) is shown. Small variations in the average number of transcripts for each neuron are not statistically significant, as assessed by a three-way ANOVA statistical analysis. Note the difference in expression levels of the DB neurons (~6 transcripts/neuron) in comparison to the DA and DD neurons (~10 transcripts/neuron) that verifies endogenous variability of expression in different neuron types. Fluorescent images are shown for wild type (Q), unc-30 ; unc-3 (R) and quadruple (S) mutant backgrounds. T: The ric-4 fosmid reporter construct with two deleted regions that contain information for VNC expression [deletion 1 (ric-4prom1 + ric-4prom2) and deletion 2 (ric-4prom26 + ric-4prom27) see Fig. 3B] is shown on top. Fluorescent images of young adult worms show that this construct is still able to drive VNC MN expression in a wild type and lin-39 mab-5 ; unc-30 ; unc-3 quadruple mutant background. Quantification is shown in Fig. S6I. Scale bars are 0.1 mm, except in Q, R, S, where scale bars are 0.01 mm.
Fig. 6
Fig. 6. Multiple parallel inputs are a common theme for pan-neuronal gene regulation
Terminal Selectors affect pan-neuronal gene expression only in the context of isolated cis-regulatory elements but not in the context of the fosmid reporters (A – H). Data of panels (A – H) are summarized in Fig. 7A. Quantification is shown on the right. Y- axis always shows % of animals with expression of the respective reporter. Data are shown in the same way for panels B – H. Double mutant backgrounds (pag-3; mec-3 and lim-4; ceh-36) were used in several cases to avoid homeotic identity transformations (Gordon and Hobert, 2015; Sagasti et al., 1999). Scale bars are 0.01 mm.
Fig. 7
Fig. 7. Distinct Regulation of Pan-neuronal and Neuron-Type Specific Identity Features
A: Summary of distinct regulatory effects of terminal selectors on neuron-type specific and pan-neuronal genes. Mutagenesis of Terminal Selector motifs in neuron type-specific gene fosmid reporters abolishes expression in the respective neuron types, shown in panels B, C and D. Primary data for A is shown in Fig 6A – H; Fig. S7L, M, N except for cases with footnotes* MNs = motor neurons, TRN = light touch receptor neurons. n.d. = not determined. 1: (Wenick and Hobert, 2004), 2: (Hwang and Lee, 2003), 3: (Kratsios et al., 2011), 4: (Eastman et al., 1999), 5: (Howell et al., 2015), 6: (Zhang et al., 2014), 7: (Gordon and Hobert, 2015), 8: (Serrano-Saiz et al., 2013), 9: (Wightman et al., 2005), 10: (Chang et al., 2003) 11: Pereira et al., in preparation. B: cho-1/ChT (choline transporter) fosmid reporter expression in the cholinergic VNC MN and the head interneuron AIY is controlled by the terminal selector unc-3 (Kratsios et al., 2011) and ttx-3 (Altun-Gultekin et al., 2001). Mutagenesis of the AIY motif (replacement by FRT) and of the COE motif (GG to CC substitution) in the nuclear cho-1fosmid::SL2::NLS::yfp::H2B reporter abolishes expression in AIY and VNC MNs respectively. Mutagenesis in the fosmid reporters was done by recombineering an FRT sequence in the place of a binding site (Tursun et al., 2009). A control cho-1fosmid reporter containing only the FRT scar, without the mutations in the COE and AIY motif, drives expression in AIY and VNC MNs same as the not mutated cho-1fosmid reporter. C: gcy-5 expression in the ASER neuron depends on the ASE terminal selector che-1 (Uchida et al., 2003). Mutagenesis of the ASE motif (replacement by FRT*) of the gcy-5fosmid reporter, abolishes expression in ASER. D: eat-4 expression in the Touch Receptor Neurons (TRN) depends on the terminal selector unc-86 (Serrano-Saiz et al., 2013). Mutagenesis of the POU homeodomain motif (replacement by FRT) of the eat-4fosmid reporter abolishes expression in the TRNs.
Fig. 8
Fig. 8. Regulatory architecture of pan-neuronal genes and neuron-type specifi genes
A: Neuron-type specific effector genes are controlled by combinations of terminal selectors (which differ in different neuron types) while pan-neuronal genes are controlled by many parallel-acting transcription factors, including terminal selectors, through modular regulatory elements. As deduced by our cis-regulatory analysis, the redundant regulators may be expressed in many different cell types. B: Different types of modular regulatory architectures.

References

    1. Altun-Gultekin Z, Andachi Y, Tsalik EL, Pilgrim D, Kohara Y, Hobert O. A regulatory cascade of three homeobox genes, ceh-10, ttx-3 and ceh-23, controls cell fate specification of a defined interneuron class in C. elegans. Development. 2001;128:1951–1969. - PubMed
    1. Aoki H, Hara A, Era T, Kunisada T, Yamada Y. Genetic ablation of Rest leads to in vitro-specific derepression of neuronal genes during neurogenesis. Development. 2012;139:667–677. - PubMed
    1. Chang S, Johnston RJ, Jr, Hobert O. A transcriptional regulatory cascade that controls left/right asymmetry in chemosensory neurons of C. elegans. Genes Dev. 2003;17:2123–2137. - PMC - PubMed
    1. Chen L, Fu Y, Ren M, Xiao B, Rubin CS. A RasGRP, C. elegans RGEF-1b, couples external stimuli to behavior by activating LET-60 (Ras) in sensory neurons. Neuron. 2011;70:51–65. - PMC - PubMed
    1. Chen ZF, Paquette AJ, Anderson DJ. NRSF/REST is required in vivo for repression of multiple neuronal target genes during embryogenesis. Nat Genet. 1998;20:136–142. - PubMed

Publication types

MeSH terms

Substances

LinkOut - more resources